
FESORIA
An integrated tool for performance and content analysis, SLA evaluation,
management and smart presentation for video-on-demand services
Xabiel G. Pañeda, David Melendi, Ricardo Bonis, Manuel Vilas, Isabel Rodríguez, Roberto García
Área de Ingeniería Telemática, Universidad de Oviedo, Campus de Viesques sn, Xixón-Gijón, Asturies, Spain
Keywords: performance, content, analysis, quality, video-on-demand, manag
ement, SLA
Abstract: This paper presents an integrated tool for performance and content analysis, management, SLA evaluation
and s
mart presentation for video-on-demand services. The improvement in the users’ access lines has
originated the appearance of several video-on-demand services. Due to the elevated resources consumption
of this kind of services, it is extremely important to obtain a high-quality configuration, which is
compulsorily based on the realization of reliable behavioural analyses. In recent years, some specific tools
for video-on-demand analysis have appeared. They obtain their data from servers and proxies log files.
However, to achieve accurate analyses, further information is necessary, for instance, video metadata or
resources consumption statistics. Fesoria is a tool which combines the analysis of log information gathered
from the streaming servers and proxies, with other data provided by both the content and the ISP managers.
All this information is analyzed in order to generate reports about the service performance and evolution,
and the users’ preferences. In addition, the results of these analyses are also employed to establish an
intelligent presentation of contents for the users of the service.
1 INTRODUCTION
The appearance of the World Wide Web linked to
the improvement in the user’s access lines has
changed the Internet World. Nowadays, the Internet
has become an important market where different
services and contents are offered. One of these is the
video-on-demand. This service is especially
attractive due to the advantages of video as a
communication tool. However, it is one of the most
difficult services to configure. These difficulties are
derived from the important quantity of resources
consumed both in the networks and computers. To
achieve a good configuration it is previously
necessary to have accurate analyses which inform
about important aspects such as service
performance, users’ preferences, or resources
consumption.
When the first video-on-demand services
appea
red, managers tried to use analysis tools, such
as Analog (Analog) (one of the well-known log
analysis tools), designed for the analysis of Web
services. However, these tools were not able to
correctly analyze this type of services due to certain
peculiarities of video transmission, such as the
provision of continuous information. For instance, it
was impossible to evaluate the quality or length of a
video reproduction. During the last three years, some
specific tools have been presented with more
accurate characteristics (Sane), and other existing
tools have been adapted for the analysis of video-on-
demand services (EIQ Pro. Suite). The majority of
the analysis tools use the log files generated by
video servers to perform their studies. In spite of the
interesting results provided, more information is
necessary for a deep service evaluation.
In 2001, a continuous system for video-on-
dem
and analysis was presented by our research team
(Pañeda, 2003). The tool was able to evaluate video
services through the analysis of their servers’ logs,
and presented its results using a web environment.
Moreover, the studies could be performed
continuously thanks to its load modules. The tool
has been used in the analysis of a real service
(www.lne.es
) and in spite of its great success, some
deficiencies were discovered. Taking advantage of
the obtained experience and with the aim of
improving the tool’s functionality, a new style of
tool has been designed. The tool presented in this
paper can be considered as an evolution of the
previous release, and it uses a new architecture with
an evolved information system. New analyses and
191
García Pañeda X., Melendi D., Bonis R., Vilas M., Rodriguez I. and García R. (2004).
FESORIA - An integrated tool for performance and content analysis, SLA evaluation, management and smart presentation for video-on-demand
services.
In Proceedings of the First International Conference on E-Business and Telecommunication Networks, pages 191-198
DOI: 10.5220/0001384201910198
Copyright
c
SciTePress
several modules to manage and present the contents
have been added, forming a powerful multipurpose
tool.
The amount of new functions is important. In the
analysis field, an advanced set of resources, users
and access tests have been included. Furthermore,
complex tests have been performed using the results
of others which are simpler. The capacity of defining
and evaluating SLA has been added. Quality levels
can be defined for different operators (users’ access
providers) and afterwards their fulfilment can be
evaluated. The management module allows both
content and ISP managers to introduce information
such as content description (name, theme,
publication date, etc), associations between IP
addresses and operators, SLA definitions,
fundamental for a deep analysis.
Making use of a powerful information system,
the tool is able to generate a smart web environment
for the presentation of contents. Users can visualize
the contents through a web page where additional
information (author, section, summary, etc) and
some recommendations (the most visualized videos,
the most visualized videos in this topic, the also-
seen videos, etc) are presented.
The tool has been designed following the
analysis and configuration methodology presented in
(Pañeda, 2004A). This methodology specifies all the
stages necessary for the analysis and configuration
of video-on-demand services. Elements such as
analysis metrics, analysis tests, input data, or data
sources are included in the methodology and have
been kept in mind in the design of the tool.
Furthermore, this methodology categorizes the
analyzed services, basing this classification on the
information provided to perform the analyses.
Using this tool, the analyzed service can be
categorized as service oriented, which is an
improvement on the basic category, considered with
the previous tool (Pañeda, 2003).
WEB Server
Information
system
Helix Universal Server
Analysis tool
Off-line
On-line
Management tool
Content
Presentation
tool
Resource
loader
Analizer/Miner
Additional elements
Management and
presentation tools
Access
loader
Real Server 8
On-line
WEB Server
Information
system
Helix Universal Server
Analysis tool
Off-line
On-line
Management tool
Content
Presentation
tool
Resource
loader
Analizer/Miner
Additional elements
Management and
presentation tools
Access
loader
Real Server 8
On-line
Figure 1: Tool architecture
The rest of the paper is organized as follows: In
section 2 the developed tool will be described. A
case study will be presented in section 3. Finally,
conclusions will be pointed out in section 4.
2 DEVELOPED TOOL
Fesoria is a specific tool for the analysis of video-
on-demand services. In order to develop accurate
analyses, the tool permits the realization of tests
whose results can be visualized using web pages.
Furthermore, continuous analyses can be performed
using Fesoria, allowing the managers to obtain
updated information at any time. The main goal of
Fesoria is to provide, continuously and
automatically, deep analyses similar to those
presented in (Almeida, 2001) and (Chesire, 2001),
which needed the support of several technicians, and
a lot of tasks to be performed for each analysis.
Thanks to its information system, Fesoria can
also be used as a powerful tool for SLA evaluation,
and content management and presentation.
Several sources provide the input data necessary
to perform the analysis tasks. The content provider
introduces metadata about contents, and the ISP
manager sets values for the SLA evaluation and
other information related to communication
networks. The rest of the necessary data is extracted
from the video-on-demand servers and proxies,
which generate data about resources consumption
and user access.
ICETE 2004 - GLOBAL COMMUNICATION INFORMATION SYSTEMS AND SERVICES
192
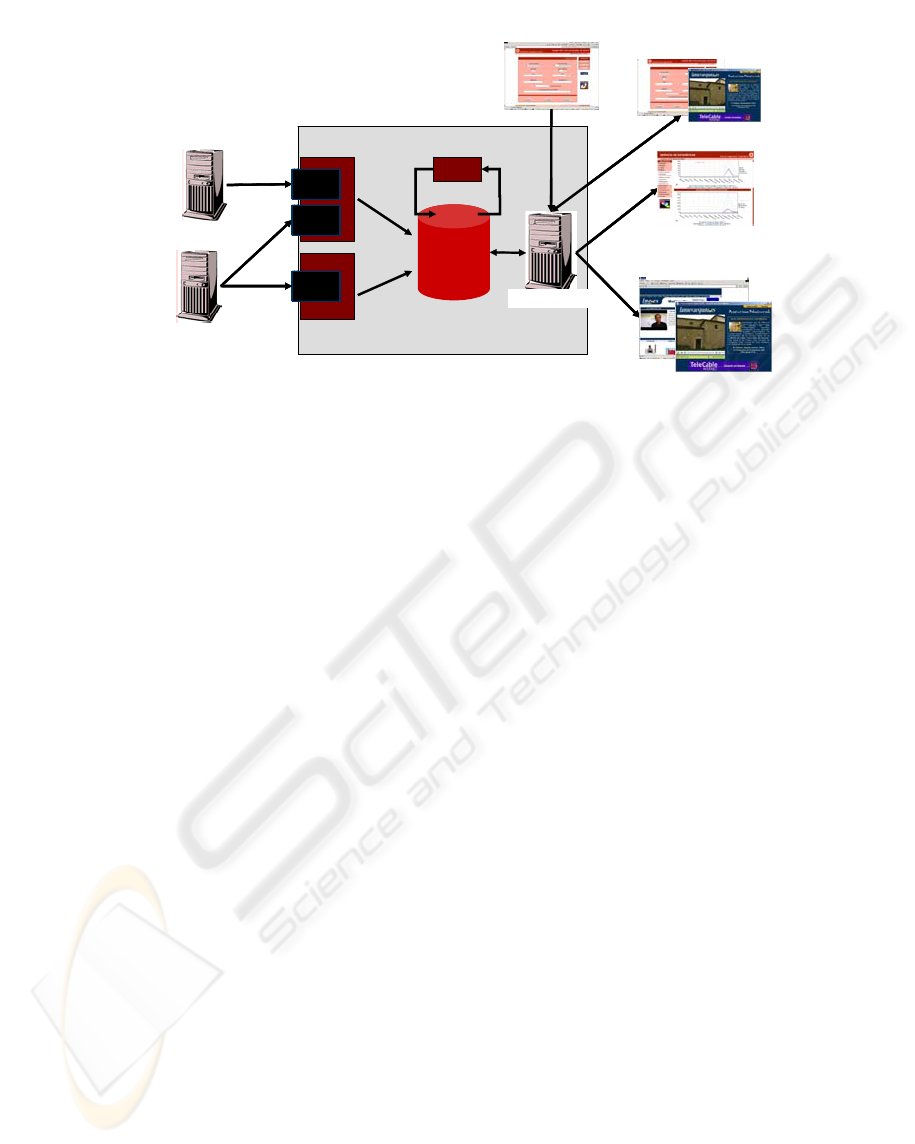
2.1 Tool Architecture
Fesoria presents the architecture shown in figure 1,
composed of several modules in charge of different
tasks. The central element of the tool is its
information system, implemented on a PostgreSQL
database engine. The database stores information
about contents, user access and service performance.
The content information managed by the tool is a set
of metadata descriptors that provide details about the
offered videos, such as title, summary, author,
theme, publication data, etc. On the other hand, the
tool manages information about the behaviour and
experiences of the users, such as date of requests,
duration, bytes delivered, packets lost, users’
interactions (play, pause,…), buffer reloads, etc. The
system also registers information about resources
usage, such as CPU and memory utilization,
bandwidth consumption, etc. Finally, data about
SLA and communication operators is also loaded, in
order to perform SLA evaluations.
Three modules, called loaders, collect data about
resources’ consumption and user access. These
modules can feed the database with this information
in real time or periodically.
A Web module has been implemented to
introduce content metadata and SLA definitions.
Other Web modules have been created to generate
graphical representations for the performed analyses,
and to present the contents to the users.
A module called analyser/miner works
periodically, generating complex analyses and
clustering its results. It must be taken into account
that the heavy load of this process makes it
impossible to constantly update its results.
Using this architecture, new modules can be
added for specific purposes, allowing the tool to
increase its functionality easily.
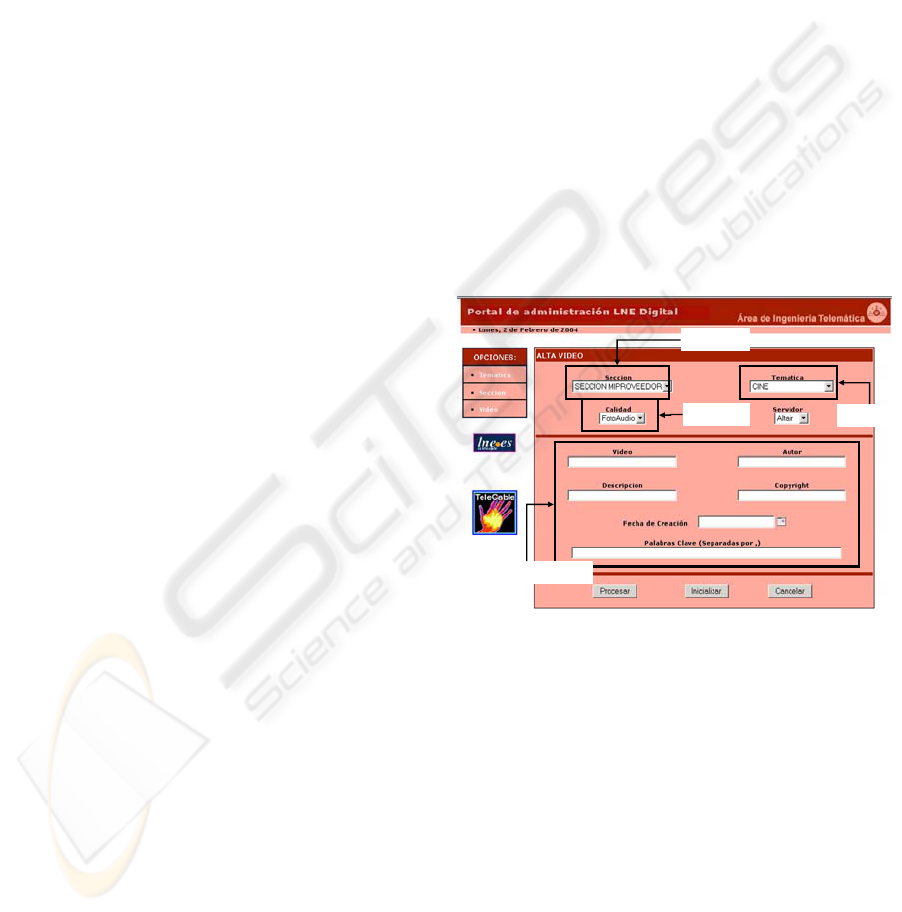
2.2 Content Management
Fesoria‘s management module is accessed from a
web browser in a secure way, thanks to the use of
the https protocol and an authentication control. Two
types of accesses are distinguished: content provider
manager, and ISP administrator. Content provider
managers are in charge of introducing and
maintaining information related to contents. ISP
administrators are in charge of maintaining the rest
of the information needed for the analysis processes,
such as ISP’s IP ranges, multimedia content servers,
supported video qualities and SLA definitions.
The information maintained by content provider
managers about videos, includes data such as name –
or title-, author, section, theme, publication date,
creation date (when the video is introduced in the
information system), copyright, keywords (to
characterize in a fast and easy fashion the contents
of the video), presentation picture, physical name
and location (server, path and extension), supported
qualities, etc. All these attributes allow the analysis
modules to improve their tests, and make the content
presentation easier. Figure 2 shows one of the
screens of the management module.
On the other hand, ISP administrators manage
data about their own companies and devices, and the
IP ranges from other communication operators. This
type of information complements the data obtained
from the server logs, and helps, for instance, to link
the users that access the video on-demand service
with their internet providers.
Another type of data maintained by the ISP
administrator is related to the users of the tool, the
installed video servers, content providers, etc.
Information about users and content providers is
necessary to allow their access to the content
management tool. Finally, information related to
video servers and supported qualities isolates
content provider managers from low level technical
aspects, and makes their job much easier.
Quality
Video metadata
Theme
Section
Quality
Video metadata
Theme
Section
Figure 2: A content manager screen
The last function is to provide an environment
for network operators, in order to establish service
level agreement policies, and evaluate their
fulfilment. It is possible to introduce percentages for
several parameters (lost packets, delayed packets,
reload times) which are acceptable in the SLA deals.
Using user access information the tool evaluates the
agreements and shows their level of fulfilment.
2.3 Automatic Data Loads
Fesoria uses three modules to obtain information
about user access and resources consumption. One
of them loads the evolution of resources usage, and
the rest collect user access information. In the user
access loader, two possibilities are acceptable to
FESORIA - An integrated tool for performance and content analysis, SLA evaluation, management and smart presentation
for video-on-demand services
193
register this type of information in the database: on-
line and off-line loads. The first one allows us to
recover the log information at the same time the
event is produced. By using this type of load the tool
offers the advantage of a just in time analysis.
However, it can only be used with Helix Servers
(RealNetworks, 2002). This server provides several
possibilities for extracting performance information
such as socket connections, http post messages, or
UDP packets. In order to receive the information
sent by the streaming server, a servlet has been
developed. It receives an http post message and
loads the received data into the database.
In the second load type, the off-line method, the
information is retrieved from the log files where the
server saves the events produced by users’ accesses.
A program which parses these files and adds the
information to the database has been designed. This
method makes just in time analyses impossible.
However, several scripts have been designed to
automate the download process from the streaming
server every night.
2.4 Service Analysis
The tool provides a great variety of analyses and
reports in three different areas: resources, users and
contents. In the contents field the analyses can be
generated for the global service, a single section, or
an individual video. Moreover, some tests act over
specific reproductions. Some of the employed
metrics have been specifically designed by our
research team, and were presented in (Arias,
2002A), (Arias, 2002B), (Pañeda, 2004B). Some of
the analyses generated are the following:
2.4.1 Content analysis
• Interest evolution. This test shows the
evolution of the users’ interest in the contents.
This element is calculated counting the number
of accesses.
• Media delivered evolution. The evolution of
seconds of delivered video is presented. This
test shows the success in a given period.
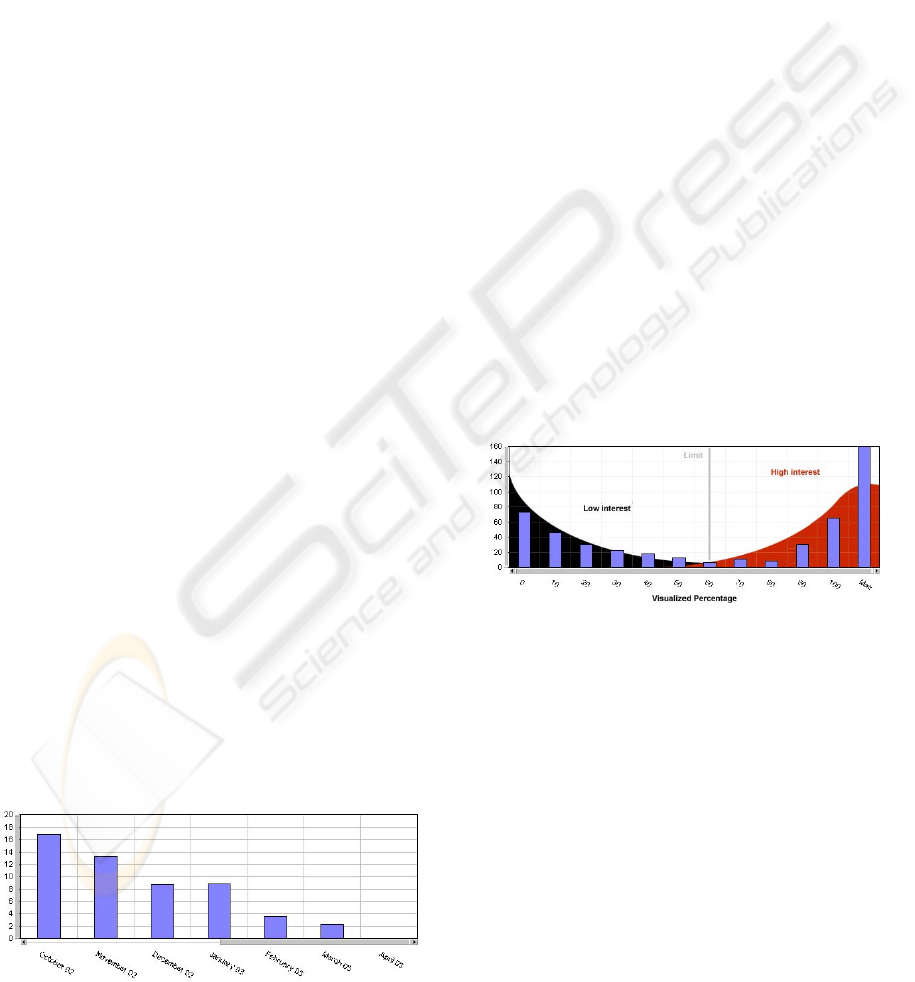
Figure 3: Impact evolution graphic
• Impact evolution. Using the metric presented
in (Pañeda, 2004B), this test evaluates the
impact of a video. Figure 3 shows the evolution
in the impact of a video, where a long duration
can be observed. Moreover, this test allows
content managers to evaluate production
profitability.
• Quality evolution. This test calculates the
number and the percentage of reproductions
with lost and delayed packets. Reproductions
with these problems reflect transmission
difficulties. On the other hand, these incidences
may have been hidden by the user reproduction
buffer. However, they must be considered to
avoid future problems.
• Quality perceived evolution 1. This test counts
the number of reproductions with buffer reloads
which are not preceded by a play. This kind of
reload is produced when the client’s buffer
becomes void due to transmission problems.
• Quality perceived evolution 2. In this case the
length of the buffer reload is taken into account.
This test evaluates the percentage of reloaded
time compared to the length of the reproduction.
• Quality fitting. This test evaluates the
difference between the quality requested by the
user and the real quality transmitted by the
system. It is an interesting test when
surestream (RealNetworks, 2002) technology
is considered.
Figure 4: Length suitability test
• Length suitability. This test aims to check if
the selected length for the videos is suitable. It
is difficult to check if a video is too short.
However, this test enables us to know if a video
is too long. Thanks to the use of a reproduction
length histogram it is possible to know if users
watch the video until the end or not. Figure 4
shows the reproduction length histogram of a
real service. The histogram is a combination of
two distributions, one for users who are not very
interested and another for those who are very
interested. If the reproductions with problems
are not considered in the histogram, the length
can be checked using the weight of both
distributions. If the first distribution is heavier,
then the video is too long. Otherwise the length
is correct.
ICETE 2004 - GLOBAL COMMUNICATION INFORMATION SYSTEMS AND SERVICES
194
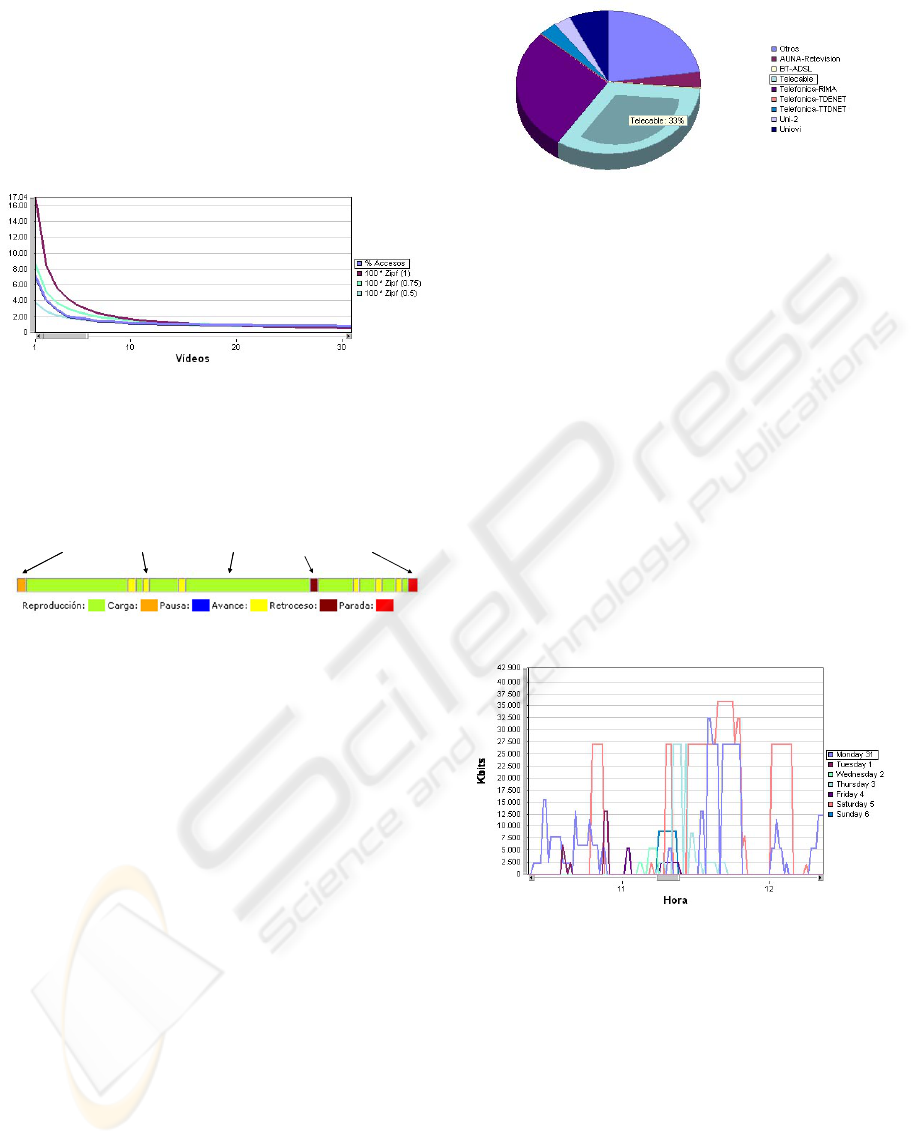
• Popularity. This analysis compares the
popularity of the videos of the real service with
the theoretical Zipf-like distribution. This
comparison is very important to decide which
videos must be produced in the future. Figure 5
shows a graph with the evolution of popularity.
Moreover, an ordered list with the most popular
videos is presented.
Figure 5: Popularity of video
• Individual reproduction analysis. To allow
service managers to profoundly analyze users’
reproductions, the tool is able to generate
graphics similar to Figure 6, where the
interactions are shown.
Stop
Sending
Backwarding
Forwarding
Buffer reload
Stop
SendingSending
Backwarding
ForwardingForwarding
Buffer reloadBuffer reload
Figure 6: Video reproduction
2.4.2 User analysis
• Loyalty. This test aims to check the number of
users and the number of reproductions they have
made. To analyze loyalty, users are classified
according to their number of reproductions. The
obtained graph generates a skew which shows
loyalty. If the skew is concave the majority of
users are not loyal, if convex, the service has
loyal users.
• User’s origin. This test aims to check the origin
of users. It helps to know the quality of their
access line, when this information cannot be
obtained directly from clients. Furthermore, it is
very important to decide the location of proxies
(caches and load balancers) which allow the
improvement of the service. Figure 7 shows a
classification of users by their IP address.
• User value. This test evaluates the value of
users. It helps managers to decide the
importance of a user or a group of users.
Figure 7: User’s origin
• Devices. This test classifies users according to
their access devices. The use of multimedia
services from mobile devices has increased
considerably and it is important to know how
many users access from a mobile device, such
as a PDA or mobile telephone (low capacity,
few resources), or from a PC (high capacity).
2.4.3 Resource analysis
This part of the analysis is composed of several
basic tests which analyze the usage of resources.
These tests check the main performance
parameters in the service devices and their network
access line. Tests for the analysis of CPU and
memory usage, cache utilization and network
consumption have been developed. Figure 8 shows a
graph with the bandwidth consumed in the output of
a streaming server during a week.
Figure 8: Bandwidth analysis
The results of these tests can be combined to
design more complex analyses. For instance, periods
where the bandwidth is near to the limit can be
crossed with the users’ perceived quality, trying to
analyse if a server overload influences the quality of
reproductions.
2.4.4 Multidimensional analysis
As well as basic tests, Fesoria can perform
multidimensional tests, which are a combination of
the basic tests results. Moreover, the obtained
information is clustered to make its analysis easier.
FESORIA - An integrated tool for performance and content analysis, SLA evaluation, management and smart presentation
for video-on-demand services
195

The list of multidimensional analyses is increased
continuously with every new test. Some of the most
important tests are shown in Table 1.
Table 1: Multidimensional tests
Test Test
Theme / reproductions Origin/ packet lost
Theme / impact Connection t. / packet lost
Origin / access User value / connection type
Access / connection type User value / buffer reloads
Connection t. / buffer reloads User value / Origin
Origin / buffer reloads
Contents produced/
reproductions
2.5 Presentation
Presentation is a recent feature included in the tool
Fesoria that strives to show not only the video itself,
but also detailed information such as title, theme,
summary, author, etc. As shown in Figure 9, all this
information has been distributed into three main
areas: the main frame contains the plug-in where
videos are going to be reproduced; another frame
displays complementary information such as title,
author, summary, and a significant picture of the
requested video; the last area recommends other
interesting videos.
Selected video
The most visualized video in the section
The newest video
Selected video
The most visualized video in the section
The newest video
Figure 9: An example of video presentation
Some of the results of the analyses are also used
to implement the content presentation. The analyses
results stored in the database are accessed by the
presentation tool and shown in a proper manner to
the users. For example, the analysis of popularity
mentioned in section 2 is linked with the
presentation and utilized to show the most seen
videos related to the current video.
One of the targets of the presentation module is
to keep the user’s attention for as long as possible.
Hence, some attractive hooks have been situated on
its interface: links to other recommended videos, to
the most requested video of the current section, or to
the most recent video introduced in the system.
At the moment, this module is still in evolution in
order to improve the service, by means of the
inclusion of some important aspects from the users’
point of view, such as to display information related
to users’ preferences or the most requested
information by the users of the service.
2.6 Adding New Functionality
The tool has been designed to facilitate the inclusion
of new modules for the fulfilment of future
requirements. Using the provided information
system it is easy to develop and integrate modules
with additional functionality. For instance, a module
to manage a short film competition has been
developed in recent months.
The new module has a web interface to select
videos from the information system. Once the videos
have been selected, it creates a temporary database
to maintain competition information, such as votes,
commentaries, descriptions, etc. This database will
be deleted once the competition has finished. The
new module also has a presentation section, which is
utilized by users to access the competition. Videos
can be ordered according to their votes or number of
reproductions. Statistical information can be
presented using the data saved in the main
information system (e.g.: number of reproductions),
or the competition information system (e.g.: votes).
3 CASE OF STUDY
Fesoria has been used during the last months in the
video-on-demand service of La Nueva España
Digital (
www.lne.es) which is one of the most
successful news services in Spain. This digital
service has an important number of accesses and has
reached the 8
th
position in the ranking of digital
news sites in Spain.
In 2000,
www.lne.es presented its video-on-
demand service developed by the Computer
Science Department of the University of Oviedo.
The number of visits and the volume of information
have risen since then. Nowadays, the service has a
good reputation due to the level of its own
production.
ICETE 2004 - GLOBAL COMMUNICATION INFORMATION SYSTEMS AND SERVICES
196
3.1 Service Description
The multimedia section of www.lne.es has an
architecture formed by two servers. One of them is
the main streaming server, and the other supports the
web pages used to access the videos, the analysis
system and a redundant streaming server. Figure 10
shows the service architecture.
Streaming
server
Telecable
Switch
Presentation, Analysis &
Redundant Streaming server
Internet
Users
Users
Information
System
Streaming
server
Telecable
Switch
Presentation, Analysis &
Redundant Streaming server
Internet
Users
Users
Information
System
Figure 10: Service architecture
Helix Universal Server is the technology used
to stream the videos delivered on-demand, when a
subscriber performs a request. The analysis server
stores all the modules of the analysis tool, including
the database, the web server, loaders and analyzers.
3.2 Content Description
The multimedia service contents have been
classified in 7 subsections according to their subject,
and they are the following: News, Music, Tourism,
Conferences, Cinema, Visits and Others. The News
subsection groups all kinds of current information,
such as: interviews, reports and news. The length
ranges vary from 30 seconds, the shortest, to 20
minutes the longest. The Music subsection covers all
kinds of information related to music, like video-
clips (short length) and interviews to musicians and
producers (around 20 minutes). The Tourism
subsection has videos about nature, culture and
tourism. Their length varies from 30 to 45 minutes
and they are produced by Productora de Programas
del Principado. The Conferences subsection
presents records of “Ciclo de Conferencias de
Ciencia y Tecnología y Cultura de la Universidad de
Oviedo”. Although they have a scientific theme they
are considered for the general public. Their length is
from 1 to 2 hours, and they have an interactive index
to move to different parts of the lecture. The Cinema
subsection contains films whose length is shorter
than 15 minutes and interviews. The Visits
subsection includes information on excursions of
several schools to La Nueva España headquarters
and their length is under 2 minutes. The last
subsection is Others which groups videos whose
subject cannot be included in the rest.
Currently, the service has approximately 400
videos which are all available in different qualities.
3.3 Results Obtained
The main modifications were the following:
3.3.1 Contents generation
• The tool has detected clients’ accesses using
mainly two network providers: Telefónica and
Telecable. These communication operators
provide accesses of 256 and 128 kbps. However
the bandwidth is not guaranteed, because the
access technology is best-effort. The LNE
service uses RealNetworks’ Surestream
technology, which is able to modify in real-time
the bandwidth consumed during a video
reproduction. Three qualities have been used:
200 kbps, 90 kbps and 40 kbps to cover all types
of users. To avoid delivery failures due to the
lack of guaranteed access quality (detected with
the quality evolution and quality perceived
evolution 1 & 2 tests), two new qualities have
been added: 150 kbps and 70 kbps. These
qualities permit a slight degradation which
avoids reproduction cuts and packet losses.
• Fesoria has allowed us to analyze which themes
are the most successful. Using the previous tool,
it was not possible to be so accurate. It has been
possible to observe that the most successful
theme has been “the Prince of Spain
engagement”, so in the last month all the events
related with this subject have been covered.
3.3.2 Hardware modifications
The tool has permitted the detection of high CPU
utilization in the server machine, when videos are
being uploaded from the production device, and
clients are requesting videos at the same time. To
improve the service a new server with more
processing capacity has been purchased.
3.3.3 Network resource configuration
In recent months, the quantity of delivered
information has been increasing continuously. In a
previous stage the bandwidth in the output server
was increased to 2Mbps, which is generally enough
to ensure good quality. However, on some occasions
the appearance of a high impact video generates a
period with higher consumptions. To avoid quality
problems, a redundant streaming server has been
added to the service architecture, which manages
some requests in these cases. Moreover, the
FESORIA - An integrated tool for performance and content analysis, SLA evaluation, management and smart presentation
for video-on-demand services
197

technology of the service has been changed from
Real8 to Real9. This new technology from
RealNetworks reaches higher compression rates,
decreasing the bandwidth consumption by 15%.
4 CONCLUSIONS
The new tool Fesoria has allowed us to perform
more accurate analyses than those possible using the
previous tool. This improvement has had an
extremely positive impact in the quality of service
and in the selection of contents. Several advantages
have been obtained:
• Efficient analyses over service resources can be
performed.
• Users’ profiles can be defined more accurately.
• Using content’s metadata, deep analyses can be
performed about the length, theme and focus of
the videos.
As well as the main task of the tool, which is to
perform service performance analyses, other
advantages have been obtained with the deployment
of the rest of the modules:
• The presentation module has persuaded users to
watch more than only one video. Its
recommendations generate greater user interest,
who, in turn, make more reproductions. The
number of videos visualized by the same user
has increased, so clients’ loyalty is greater.
• The possibility of using the information system
to generate additional tools has allowed service
managers to save a lot of time in the
construction of new tools.
• The establishment and utilization of SLA
management in the tool has been used to
evaluate which type of agreements could be
defined in the near future. We have studied
what kind of quality parameters could be
established with a minimum quality. The results
of the tests pointed out the possibility of
guaranteeing a packet loss and packet delayed
rate of less than 10%, but only for users from
the same operator where servers are sited.
Regretfully, nowadays it is impossible to think
of guaranteeing quality parameters for users
from other operators. Too many operator
interconnections and best effort channels make
it impossible to ensure any degree of quality.
ACKNOWLEDGMENTS
This research has been financed by the operator
Telecable and the newspaper La Nueva España
(www.lne.es) within the projects NuevaMedia,
TeleMedia, ModelMedia and Media XXI.
REFERENCES
Analog, http://www.analog.cx/
Sane, http://www.sane.com
EIQ. Pro. Suite, http://www.eiqnetworks.com
Pañeda, X.G., Melendi, D., García, M., García, V.G.,
García, R., Riesgo, E., 2003. Analysis tool for a video-
on-demand service based on streaming technology. 6
th
IEEE Conference on High Speed Networks and
Multimedia communications. LNCS 2720, Springer
Verlag. Estoril, Potugal.
Pañeda, X.G., Melendi, D., García, V.G., García, R.,
Neira, A., to appear in 2004. Analysis and
Configuration Methodology for Video-on-Demand
Services Based on Monitoring Information and
Prediction. 6th International Conference on Enterprise
Information Systems (ICEIS2004). Porto, Portugal.
Almeida, J.M., Krueger, J., Eager, D.L., Vernon, M.K.,
2001. Analysis of Educational Media Server
Workloads, NOSSDAV. Port Jefferson, NY.
Chesire, M., Wolman, A., Voelker, G., Lavy, H., 2001.
Measurement and Analysis of a Streaming-Media
Workload, USENIX Symposium on Internet
Technologies and Systems.
RealNetworks, 2002. Helix Universal Server
Administration Guide.
Arias, J.R., Suárez, F.J., García, D.F., Pañeda, X.G.,
García, V.G., 2002. A Set of Metrics for Evaluation of
Interactive News-on-Demand Systems. ACM
International Multimedia Conference. Juan les Pins,
France.
Arias, J.R., Suárez, F.J., García, D.F., Pañeda, X.G.,
García, V.G., 2002. Evaluation of Video Server
Capacity with Regard to Quality of The Service in
Interactive News-on-Demand Systems. Protocols and
Systems for Interactive Distributed Multimedia. LNCS
2515. Springer Verlag. Coimbra, Portugal.
Pañeda, X.G., Melendi, D., García, V.G., García, R.,
Pérez, J., to appear in 2004. Video-on-Demand
Engineering Using an Extensible Method.
IADIS
International Conference Applied Computing 2004
.
Lisboa, Portugal.
ICETE 2004 - GLOBAL COMMUNICATION INFORMATION SYSTEMS AND SERVICES
198
