
QUALITY OF SERVICE PERFORMANCES IN AD HOC IEEE
802.11 WIRELESS LANS
Maria Stella Iacobucci
Telecom Italia Learning Services, Via G. Falcone 25,67100 L’Aquila, Italy
Fabio Graziosi, Panfilo Ventresca
Università degli studi dell’Aquila, Località Monteluco di Roio, 67040 L'Aquila, Italy
Keywords: Quality of Service, Ad Hoc Networks, IEEE 802.11, WLANs
Abstract: WLAN is a wireless network which provides connectivity in a limited area. IEEE 802.11 is the most
widespread standard for wireless LANs, but it is not suitable for real time services. The draft standard
IEEE802.11e provides solutions for Quality of Service (QoS), and maintains the compatibility with the
IEEE802.11 standard. The paper, after a brief introduction on the WLAN technology, describes the
IEEE802.e solutions for QoS and provides simulation results in an ad hoc network with different loads. It is
shown that QoS in an ad hoc network can be provided with completely distributed techniques even if the
network is heavy loaded with real time services.
1 INTRODUCTION
WLAN is a wireless network which provides
connectivity in a limited area. IEEE 802.11 is the
most widespread standard for wireless LANs, which
includes two network topologies:
Infrastructure Network, consisting of a Distribution
System (DS) that connects two or more Access
Points (APs). Each AP provides a radio coverage
and each station (STA) is attached to one AP. One
AP with the attached STAs is called Basic Service
Set (BSS). The DS with the connected BSSs is an
Extended Service Set (ESS). The ESS allows the
communication between STAs belonging to
different BSSs.
Ad Hoc Network, where the STAs are connected
peer-to-peer. An Ad Hoc Network self-creates, self-
organizes, self-administrates. The STAs sharing a
radio channel form an Independent Basic Service Set
(IBSS). Performances of an Ad Hoc Network strictly
depend on the STAs number, on the mutual distance,
and on their instantaneous position. All the
algorithms are completely distributed.
IEEE 802.11 is the most widespread standard for
wireless LANs, but it is not suitable for real time
services. The draft standard IEEE 802.11e provides
solutions for Quality of Service (QoS), and
maintains the compatibility with the IEEE 802.11
standard.
The paper is organized as follows. Section 2
describes the IEEE 802.11 WLAN standard, section
3 deals with the required changes to the MAC
protocol for the support of QoS.
In section 4 the simulation scenario is described; in
section 5 simulation results are provided with
comments and conclusions.
2 IEEE 802.11 WLAN
The standard IEEE 802.11 defines the Physical
(PHY) and Medium Access Control (MAC) layer for
Wireless LANs, both for infrastructure and ad hoc
topologies.
The most important physical layers are:
b, which works at 2.4 GHz and provides up to 11
Mb/s
a, which works at 5 GHz and provides up to 54 Mb/s
g, which works at 2.4 GHz and provides up to 54
Mb/s. The g PHY is backwards compatible with the
b standard.
The MAC is unique for each PHY, and is based on
Carrier Sense Multiple Access/Collision Avoidance
(CSMA/CA). The implemented function is called
160
Stella Iacobucci M., Graziosi F. and Ventresca P. (2004).
QUALITY OF SERVICE PERFORMANCES IN AD HOC IEEE 802.11 WIRELESS LANS.
In Proceedings of the First International Conference on E-Business and Telecommunication Networks, pages 160-165
DOI: 10.5220/0001391501600165
Copyright
c
SciTePress

Distributed Coordination Function (DCF), and
works as follows. Before the transmission, each STA
listens the wireless medium: if it is heard free for a
DIFS (Distributed Inter Frame Space) time, the
STA sends the bits, otherwise it launches the backoff
procedure. The backoff procedure calculates a
backoff time through a random function which takes
uniformly distributed values between 0 and CW
(Contention Window), where CW is always:
CW
min
≤ CW ≤ CW
max
Initially CW is initialised at CW
min.
The backoff
time is calculated as follows:
SlotTimeRandomCWtimeBackoff ×
×
= ()_
Standard values for the SlotTime
are 31µs for
802.11b and 15µs for 802.11a. Because the CW
value is chosen as a power of two minus one, if
Random() assumes integer values the Backoff_time
is:
SlotTimeRandomtimeBackoff
k
××−= ()])12[(_
where CW=2
k
-1. When a STA which has launched
the backoff procedure finds the medium as free, it
begins to decrement of a slot time the backoff timer
until it relieves the medium as occupied. When this
timer reaches zero value, the station transmits the
Mac Service Data Unit (MSDU). Each MSDU
which has been correctly received must be
acknowledged with and ACK frame. If the ACK is
not received into an ACKtimeout time, then the
transmission is considered unsuccessful and the
backoff procedure is launched by duplicating the
previous CW value as follows:
1)1(2 −+×=
oldnew
CWCW
The backoff time at the i-th tentative of access is:
SlotTimerandomtimeBackoff
ik
××−=
+
()])12[(_
When a STA has successful transmitted a MSDU, it
launches a post-backoff procedure in order to allow
other stations to access the medium.
DCF is the basic MAC for both infrastructure and ad
hoc 802.11 networks. An added function, not
mandatory from the standard, is the Virtual Carrier
Sense (VCS), which solves the hidden node problem
with RTS/CTS frames. Finally, the PCF is an
optional access technique which can be implemented
only in infrastructure networks where the Point
Coordinator (PC) regulates the access to the
medium during a time called Contention Free
Period.
3 QOS IN IEEE 802.11
DCF is for best effort services, because it does not
provide QoS. In fact all the stations belonging to a
BSS or an IBSS compete with the same priority to
access the same wireless medium.
In the standardization bodies was accepted that QoS
mechanisms had to be added in the 802.11 standard,
and in 1999 the task group TGe was created, that
later gave birth to the draft standard IEEE 802.11e.
This new MAC maintains the compatibility with
802.11.
In IEEE 802.11e, the stations are named QSTA, the
BSS and IBSS are QBSS and QIBSS. It is worth to
underline that the existence of a QBSS or a QIBSS
does not preclude the good functioning of the non-
QoS stations.
With IEEE 802.11e the MAC is enhanced by the
Enhanced Distributed Coordination Function
(EDCF), which is a completely distributed technique
that provides a service differentiation based on 8
priority levels, named User Priority (UP). Each
QSTA can manage 4 Access Categories (AC), and
each AC has a different value for DIFS, which in
IEEE 802.11e is renamed AIFS (Arbitration
InterFrame Space), CW
min
and CW
max
. In general,
the higher is the priority, the lower are AIFS[AC],
CW
min
[AC] and CW
max
[AC] parameters.
The mapping between UP and AC is represented in
table 1.
Table 1: mapping between UP and AC
User
Priority
(UP)
IEEE Definition Access
Category
(AC)
0 Best Effort (BE) 0
1 Background (BK) 0
2 - 0
3 Excellent Effort (EE) 1
4 Controlled Load (CL) 2
5 Video 2
6 Voice 3
7 Network Control (NC) 3
The backoff interval is given by:
SlotTimeRandomtimeBackoff ×
=
()_
where
()Random
assumes uniformly distributed
values in (1, CW[AC]+1).
In EDCF there are 4 traffic queues, where are
mapped the eight defined User Priorities.
QUALITY OF SERVICE PERFORMANCES IN AD HOC IEEE 802.11 WIRELESS LANS
161
Each queue is characterized by different access
parameters.
Each time the backoff procedure is relaunched
because of transmission failure of internal collision,
the CW value is updated as follows:
{}
12)1]AC[],AC[min]AC[
max
−
×
+
=
oldnew
CWCWCW
Once a STA has won the competition to access the
medium, it transmits MSDUs for a period whose
maximum depends on the AC and is
TXOPlimit[AC]. Therefore the in EDCF a STA is
allowed to transmit more than a frame without
having to regain access to the channel.
4 SIMULATION SCENARIO
Simulations have been performed with Network
Simulator version2, which is an open source
simulator for different kinds of telecommunication
networks.
The simulated scenario is the ad hoc network
represented in figure 1. The ad hoc network is
composed of 6 wireless stations in fixed positions.
Each STA performs one or more transmissions of
real time (voice, videoconference), multimedia
(video and audio streaming) and best-effort (data
transfer) applications.
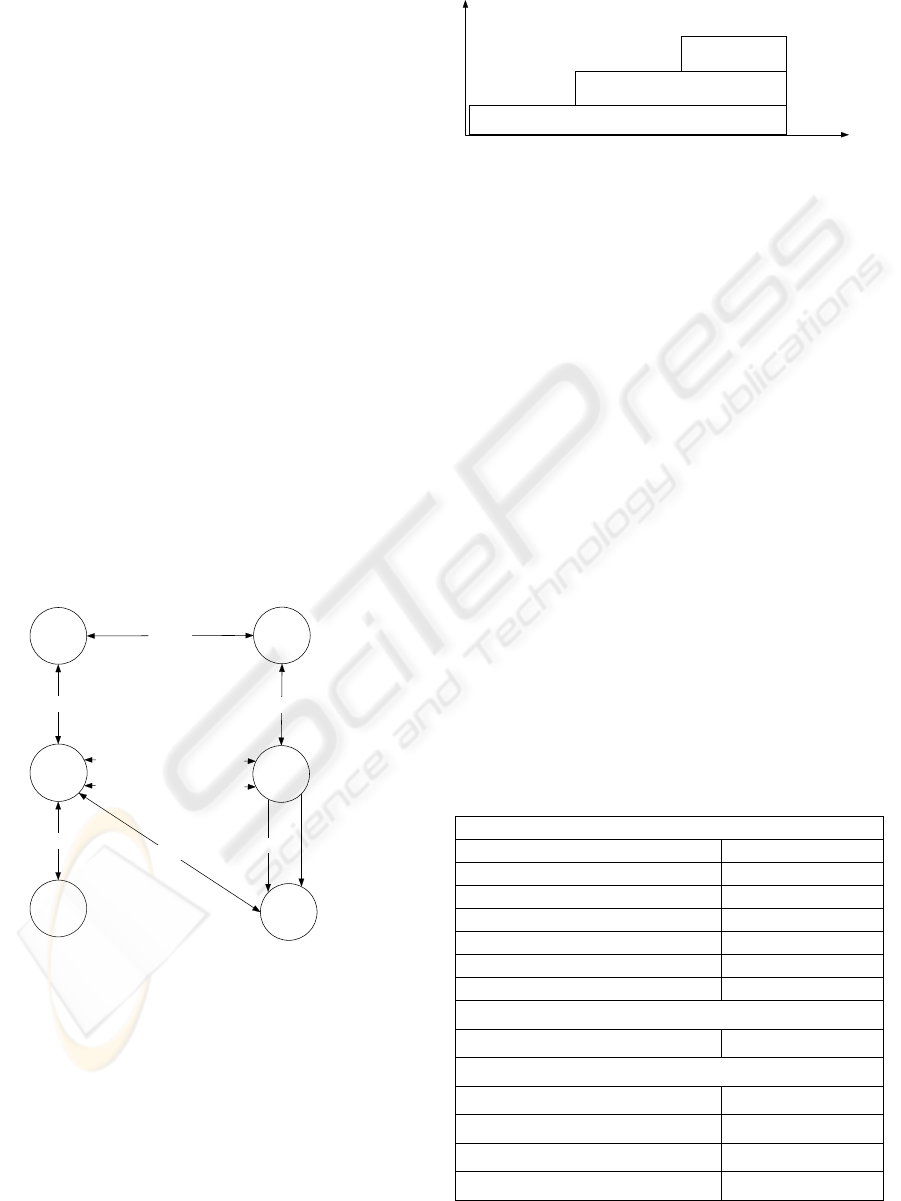
Figure 1: Simulation scenario 1
The simulation time has been divided into three sub-
intervals where the different traffic sources start,
until the network load reaches the full load.
As shown in figure 2, in the first time interval, voice
and videoconference start; in the second time
interval, streaming audio and audio-video are added;
in the third time interval, the network is loaded with
best effort data transfers until the saturation point of
the network. The network load is 17% in the first
time interval (30 s), 88% in the second time interval
(30 s), 104% in the third time interval (30 s).
Figure 2: Source timing
For each traffic source the following models have
been used.
Voice: bi-directional CBR source at 64 kb/s,
packet length 160 bytes, packet interarrival time 20
ms
Videoconference: the traffic is composed of
video and audio, and is modelised as follows:
Video: bi-directional CBR source at 98.4 kb/s,
packet length 1500 bytes, packet interarrival time
122 ms
Audio: bi-directional CBR source at 6.3 kb/s,
packet length 160 bytes, packet interarrival time 203
ms
MPEG-2 video stream: unidirectional CBR
source at 4 Mb/s, packet length 1504 bytes, packet
interarrival time 3 ms
MP3 audio stream: unidirectional CBR source at
128 kb/s, packet length 512 bytes, packet interarrival
time 32 ms
Data traffic: unidirectional CBR source at 128
kb/s, packet length 1500 bytes, packet interarrival
time 9.6 ms
The transport layer implemented for simulations is
UDP for voice, videoconference, MPEG-2 and MP3,
and TCP for data transfer.
Table 2: MAC parameters chosen for DCF and EDCF
simulations
DCF and EDCF common values
SlotTime 20 ms
SIFS 10 ms
PIFS 30 ms
DIFS 50 ms
FragmentationThreshold 2304 byte
RTSThreshold 300 byte
MaxTrasmitMSDULifetime 512*1024 µs
DCF access parameters
CW
min
, CW
max
31, 1023
EDCF access parameters
AIFS[3], CW
min
[3], CW
max
[3] 2, 7, 31
AIFS[2], CW
min
[2], CW
max
[2] 4, 15, 256
AIFS[1], CW
min
[1], CW
max
[1] 8, 31, 1023
AIFS[0], CW
min
[0], CW
max
[0] 16, 63, 1023
DATA
MPEG2
MP3
VOICE
V
i
d
e
o
c
o
n
f
e
r
e
n
c
e
(
V
I
D
E
O
)
DATA
DATA
V
O
I
C
E
V
i
d
e
o
c
o
n
f
e
r
e
n
c
e
(
A
U
D
I
O
)
STA1
STA0
STA2
STA3
STA4
STA5
Voice + Videoconference (audio+video)
1
time (s)
MPEG2+MP3
Data
30
9060
Traffic
ICETE 2004 - WIRELESS COMMUNICATION SYSTEMS AND NETWORKS
162
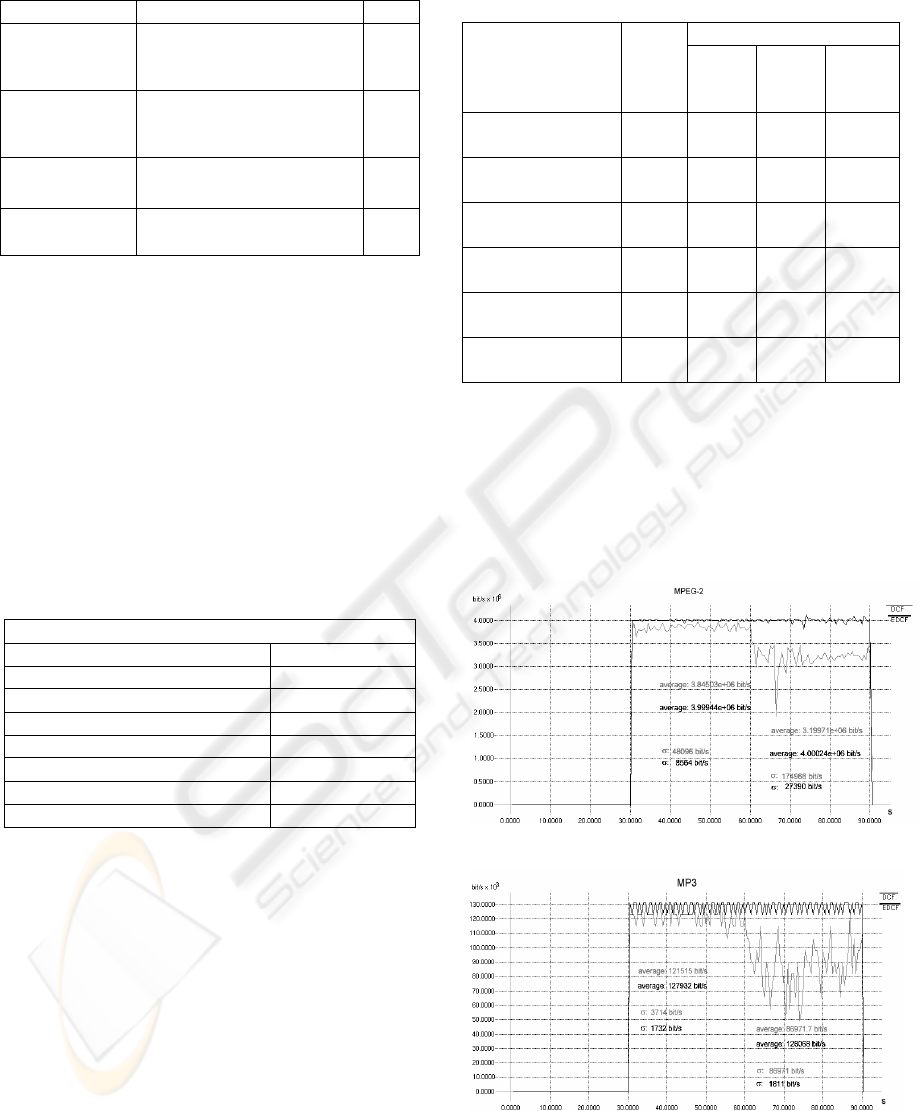
Table 3: traffics and ACs mapping
Priority Traffic sources AC
6-7 (Very
High Priority)
Voice,
Videoconference (audio
and video)
3
4-5 (High
Priority)
Streaming audio (MP3)
and streaming video
(MPEG-2)
2
3 (Excellent
Effort)
- 1
0-2 (Best
Effort)
Data transfer 0
Table 2 shows MAC parameters chosen for DCF
and EDCF simulations. The common values are
default values of the IEEE 802.11b physical level;
EDCF parameters have been chosen in order to
obtain good differentiation among access categories.
The RTSThreshold has been chosen such that the
RTS/CTS mechanism is not applied to voice and
audio of the videoconference traffic.
Table 3 shows the mapping among traffic sources
and ACs; table 4 presents physical parameters used
for simulations. Carrier sense and Rx ranges have
been computed considering antennas height of 1.5
m.
Table 4: PHY parameters chosen for simulations
Definition Value
P
t
(dBm) 20
RXThresh (dBm) -50
CSThresh (dBm) -56
Propagation model Two-ray ground
Carrier Sense range (m) 113
Rx range (m) 80
Max Trasmission Rate (Mbit/s) 11
Min Trasmission Rate (Mbit/s) 1
In the simulation scenario, STA1 and STA2, STA3
and STA4, STA5 and STA6 are 50 m away; STA1
and STA3, STA3 and STA5, STA2 and STA4,
STA4 and STA6 are 60 m away.
The magnitudes that have been computed for QoS
performance evaluation are: throughput, delay, jitter,
Packet Loss Ratio (PLR), IP Packet Delay Variation
(IPDV). The IPDV is defined as follows:
minmax
IPTDIPTDIPDV −=
where
max
IPTD
and
min
IPTD
are respectively the
maximum and minimum IP Packet Transfer Delay
(IPTD) measured in the considered interval.
Table 5 shows needed QoS parameters for the
described simulation scenario.
Table 5: QoS parameters for the described simulation
scenario
QoS Parameters
Applications
Data
Rate
Delay
end-
to-end
IPDV PLR%
Voice
64
Kbit/s
<50ms <50ms < 5%
Real-time audio
(videoconference)
6.3
Kbit/s
<50ms <50ms < 3%
Real-time video
(videoconference)
98.4
Kbit/s
<50ms <50ms < 1%
Streaming audio
MP3
128
Kbit/s
<10 s 1 s < 1%
Streaming video
(MPEG-2)
4
Mbit/s
<10 s 1 s < 1%
Data transfer
128
Kbit/s
<60 s - zero
5 SIMULATION RESULTS
Simulations compare ad hoc network performances
between DCF and EDCF MAC in terms of
throughput, average and instantaneous delay, jitter,
IPDV.
Figure 3: MPEG-2 throughput
Figure 4: MP3 throughput
Figures 3, 4 and 5 show a comparison of MPEG-2,
MP3 and voice instantaneous and average
QUALITY OF SERVICE PERFORMANCES IN AD HOC IEEE 802.11 WIRELESS LANS
163
throughputs between DCF and EDCF functions.
EDCF maintains good throughputs even at high
network loads.
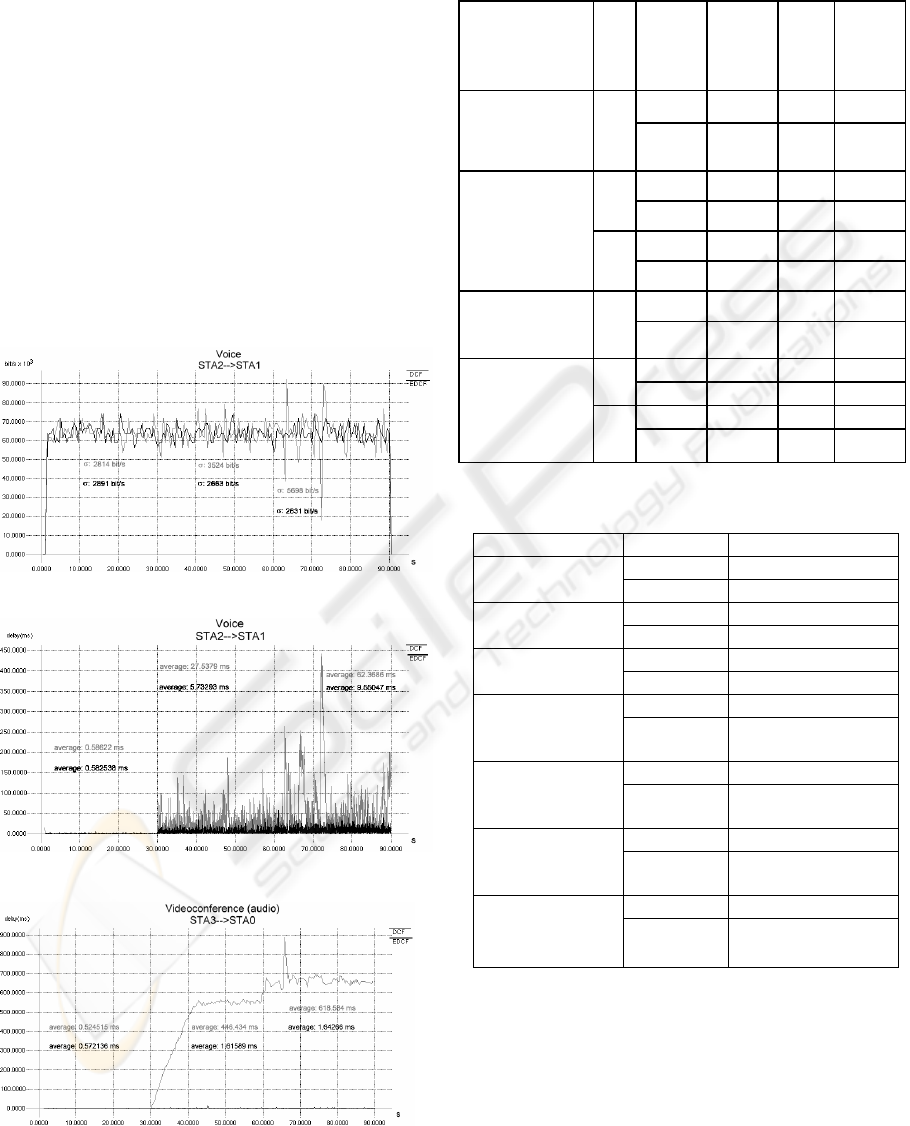
Figures 6 and 7 show the delay of voice and
videoconference traffics, and highlight that delay
limits are not guarantied with DCF even in the
second simulation interval. Table 6 shows the
videoconference average delay, jitter, and IPDV
with DCF and EDCF functions. EDCF guarantees
QoS limits even in the third simulation interval,
when the network is high loaded. In tables 7 is
shown that the probability that the delay of real time
traffic is lower than 50 ms is always higher than
99% with EDCF, and is sometimes lower than 50%
with DCF.
Finally, table 8 shows PLR for EDCF and DFC,
highlighting EDCF better performances.
Figure 5: Voice throughput
Figure 6: Voice delay
Figure 7: Videoconference (audio) delay
Table 6: Average delay, jitter, IPDV of videoconference
traffic
Application s MAC
Avera
ge
delay
(ms)
Jitter
(ms)
IPDV
(ms)
DCF 6.61 25.8 58.95
Videoconf.
(audio)
STA0→STA3
60-
90
EDCF 1.77 3.48 4.19
DCF 446.43 46.1 555
30-
60
EDCF 1.61 4.47 13.17
DCF 618.58 121. 285.7
Videoconf.
(audio)
STA3→STA0
60-
90
EDCF 1.64 3.46 5.89
DCF 6.97 25.2 67.14
Videoconf.
(video)
STA0→STA3
60-
90
EDCF 3.21 3.94 8.81
DCF 446.12 47.8 559.3 30-
60
EDCF 2.93 4.17 8.89
DCF 666.73 149. 282.5
Videoconf.
(video)
STA3→STA0
60-
90
EDCF 3.18 3.92 6.13
Table 7: probability that the delay of real time traffic is
lower than 50 ms
REFERENCES
ANSI/IEEE Std 802.11, 1999. In IEEE Standard for
Information Technology - between system - Local and
metropolitan area network - Specific requirements –
Part 11: Wireless LAN Medium Access Control (MAC)
and Physical Layer (PHY) Specifications.
Application MAC P(delay<50 ms)
DCF 82.34 % Voice
STA1→STA2
EDCF 99.88 %
DCF 99.64 % Voice
STA0→STA4
EDCF 100 %
DCF 100 % Voice
STA4→STA0
EDCF 100 %
DCF 99.77 % Videoconference
(audio)
STA0→STA3
EDCF 100 %
DCF 40.72 % Videoconference
(audio)
STA3→STA0
EDCF 100 %
DCF 99.59 % Videoconference
(video)
STA0→STA3
EDCF 100 %
DCF 39.03 %
Videoconference
(video)
STA3→STA0
EDCF 100 %
ICETE 2004 - WIRELESS COMMUNICATION SYSTEMS AND NETWORKS
164

IEEE Std 802.11b, 1999. In Supplement to IEEE Standard
for Information technology – Telecommunication and
information exchange between system – Specific
requirements – Part 11: Wireless LAN Medium Access
Control (MAC) and Physical Layer (PHY)
specifications: Higher-Speed Physical Layer
Extension in the 2.4 GHz Band.
IEEE 802.11e/D3.3, 2002. In Draft Supplement to
STANDARD FOR Telecommunications and
Information Exchange Between System – LAN/MAN
Specific Requirements – Part 11: Wireless Medium
Access Control (MAC) and physical layer (PHY)
specifications: Medium Access Control (MAC)
Enhancements for Quality of Service (QoS)
http://www.isi.edu/nsnam/ns/
P. Coverdale, 2001. In Workshop on QoS and user
perceived transmission quality in evolving networks
ITU-T Recommendation Y.1541, 2002.
QUALITY OF SERVICE PERFORMANCES IN AD HOC IEEE 802.11 WIRELESS LANS
165
