USING VISUALS TO CONVEY INFORMATION
Luis Borges Gouveia
CEREM, Fernando Pessoa University,Pr 9 de Abril, 349, P4249-004, Porto, Portugal
Keywords: Information Visualisation, Visualisation, visuals
Abstract: This paper summarizes the literature on visualisation and information visualisation and provides a broad
view of available systems and techniques. The paper also argues that the use of visuals can help conveying
information, and that can be an advantage to the use of visualisation and information visualisation to support
information management.
1 INTRODUCTION
As stated by Hamming, “The purpose of computing
is insight, not numbers” (Hamming, 1962). Using
visual representations of data to provide information
is a well-established field. Abstract displays of
information (such as graphs and plots) are a recent
invention (around 1750-1800) (Tufte, 1983).
As considered by Card and others, visualisation is
the use of computer-based, interactive visual
representations of data to amplify cognition (Card et
al., 1999). Wood and others assert that visualisation
is a collaborative activity and propose the existence
of a Computer Supported Collaborative
Visualisation (CSCV) field (Wood et al., 1997).
Jern discusses the existence of a third-generation
GUI paradigm: the Visual User Interface (VUI). The
same author presents a number of characteristics that
a VUI must have (Jern, 1997):
• picture-centric user interface;
• direct interaction – exploration and
navigation;
• graphical object selection and data
probing;
• close connection to data;
• object-oriented focused graphics;
• control of geometry resolution;
• direct engagement of the user.
Vision is the highest bandwidth human sense
(Uselton, 1995). Humans are good at scanning,
recognising, and recalling images. Visualisation
takes advantage of human perceptual abilities
(Johnson-Laird, 1993). If we consider the dictionary
definition of the word “visual”, we obtain several
definitions relating to information gained through
the human eye. However, an alternative dictionary
definition suggests the conveyance of a mental
image. If we now look at the dictionary definition of
“visualisation”, we see in one case that visualisation
is “the power to process and forming a mental
picture or vision of something not actually present to
the sight”. These definitions allow us to consider
that a visualisation can result from input to any
combination of the human senses, which is not
restricted to "visible" images.
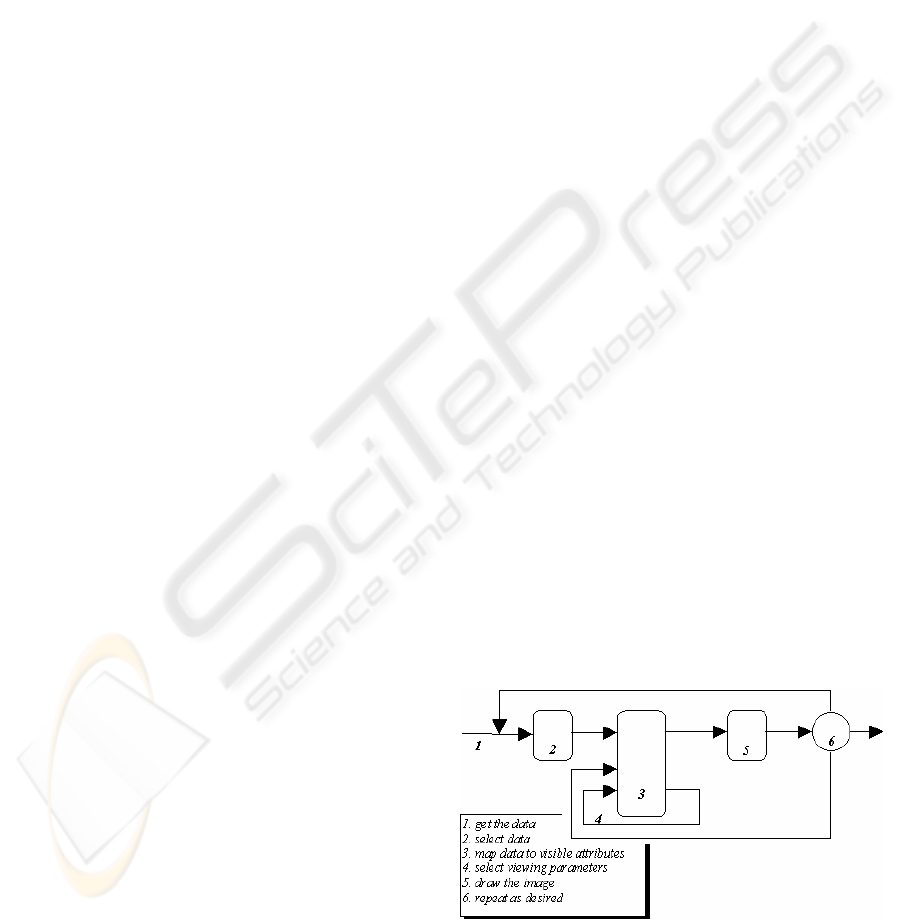
Visualisation can be seen as a process with six
steps. The enumeration of the proposed steps is
adapted from Uselton (Uselton, 1995). Uselton
states that Visualisation extends the graphics
paradigm by expanding the possible input. In
particular, data analysis is a process of reducing
large amounts of information to short summaries
while remaining accurate in the description of the
total data (Yu, 1995).
Figure 1: The visualisation process
216
Borges Gouveia L. (2004).
USING VISUALS TO CONVEY INFORMATION.
In Proceedings of the Sixth International Conference on Enterprise Information Systems, pages 216-220
DOI: 10.5220/0002644102160220
Copyright
c
SciTePress

One particular graphical application use is in
statistics. Yu proposes a framework for
understanding graphics based on the idea of
balancing summary with raw data, and analyses ten
different visualisation methods for multivariate data
(Yu, 1995). The author concludes that the use of
colour in statistical graphics has long been neglected
but this tends to change due to the availability of
better hardware, changing the type of graphics that
can be created and used. He also proposes the
process of visualisation as an adjustment of noise
and smooth (blocking understanding or facilitating
it).
An extension of graphics is the concept of
interactive displays of information. The Interactive
Graphical Methods are defined as the class of
techniques for exploring data that allow the user to
manipulate a graphical representation of the data
(Eick and Wills, 1995). The interactive graphics are
also referred to as direct manipulation graphics or
dynamic graphics.
Eick and Wills list a number of areas in which
interactivity significantly improves static displays,
such as: clarity; robustness; power; and possibility
(Eick and Wills, 1995). The purpose of an
interactive graphical display is to use graphical
elements to encode the data in such a way as to
make patterns apparent and invite exploration and
understanding of the data by manipulating its
appearance. Both Tufte (Tufte, 1997), and Eick and
Wills present a general discussion of interactive
graphics.
Making good visualisations requires
consideration of characteristics of the user and the
purpose of the visualisation. Knowledge about
human perception and graphic design is also relevant
(Uselton, 1995). According to Eick and Wills a good
display must include the following three
characteristics (Eick and Wills, 1995):
1. it should be obvious as to what is being
displayed;
2. it should focus attention on the data;
3. it should indicate scale and location of
the data
Cleveland gives an ordering of the difficulty of
decoding visual cues, starting with the easiest ones:
position along a common scale; position along
identical, non-aligned scales; length; angle; area;
volume; colour hue; colour saturation; and density
(Cleveland, 1985).
In the DARPA’s Intelligent Collaboration &
Visualisation (IC&V) program, aimed at enhancing
collaboration between teams through distributed
information systems, one of the specified key
challenges is to develop team-based visualisation
software for sharing views, and in particular,
visualising abstract spaces (IC&V, 1997). DARPA
describes research challenges in mapping real
objects to data about them; methods for augmenting
real spaces with superimposed information that adds
value, and the more difficult problems of developing
techniques to support visualisation of abstract N-
dimensional spaces, where there is a need to develop
methods for representing abstract information spaces
and for navigating such spaces (IC&V, 1997).
Turner and others described a 4D symbology (3D
symbols plus time-dependence) for battlefield
visualisation where data come from real-time
sensors and from simulations and are positioned in a
high-fidelity 3D terrain (Turner et al., 1996).
2 INFORMATION
VISUALISATION
Andrews defines Information Visualisation as the
visual presentation of information spaces and
structures to facilitate their rapid assimilation and
understanding (Andrews, 1997). In the same
document, the author provides details of a collection
of Information Visualisation related Web resources.
Young reports on three-dimensional Information
Visualisation (Young, 1996). This report provides an
enumeration of visualisation techniques and a survey
of research visualisation systems.
McCormick and DeFanti define Information
Visualisation as the transformation of the symbolic
into the geometric (McCornick and DeFanti, 1987).
Bertin proposes Information Visualisation as an
augmentation to intelligence in helping find the
artificial memory that best supports our natural
means of perception (Bertin, 1967). The main goals
of Information Visualisation are related to aiding the
human in analysis, explanation, decision-making,
exploration, communication, and reasoning about
information (Card et al., 1999).
Visualisation offers a support structure (such as
spatial or graphical representations), for pattern
finding, change detection, or visual cues to help
reasoning about large datasets and multiple and
heterogeneous information sources. These factors
are also reasons for the need to develop cognition
artefacts that use information visualisation
techniques (Norman, 1998). More specifically, it is
possible to summarise that visualisation should
make large datasets coherent and present huge
amounts of information compactly; present
information from various viewpoints; present
information at various levels of detail (from the
more general overviews to fine structure); support
visual comparisons; make visible the data gaps; and
tell stories about the data (Hearst, 1998).
USING VISUALS TO CONVEY INFORMATION
217

Three main perspectives can be considered for
visualise information in 3D (Buscher et al., 1999):
• using the properties of information
objects and defining rules for their
distribution in space – VIBE (Olsen et
al., 1993), BEAD (Chalmers and
Chitson, 1992) and Q-PIT (Colebourne,
1996);
• visualisations of hypermerdia-link based
systems – (Card et al., 1991);
• human-centred tools, allowing people to
structure and display information in
electronic spaces – (Benford et al.,
1997).
An example of an information visualisation
system is the Populated Information Terrains (PIT).
The PIT concept aims to provide a useful database
or information system visualisation by taking key
ideas from CSCW, VR and database technology. A
PIT is defined as a virtual data space that may be
inhabited by multiple users. One particular
characteristic is that users work co-operatively
within data (Benford and Mariani, 1994). Moreover,
VR-VIBE was designed to support the co-operative
browsing and filtering of large document stores
(Benford et al., 1995).
Computers facilitate access to large datasets,
interaction, animation, range of scales, precision,
elimination of tedious work, and new methods of
display (Hearst, 1998).
An overview of graphical visualisation is made
by Ware, where the main issues with visualisation
techniques are listed as: space; time; stability; and
navigation, based on the hierarchy notion (Ware,
2000). A paper collection presenting an overview of
classical visualisation techniques (pan and zoom,
multiple windows, and map view strategy), and
focus+context techniques (fish-eye, hyperbolic
browser, cone-trees, intelligent zoom, treemaps, and
magic lens) is given by Card and others (Card et al.,
1999). Beaudoin and others introduce a novel
approach – Cheops –, and a discussion of strengths
and limitations of focus+context techniques (to
which the Cheops approach belongs) (Beaudoin et
al., 1996).
One of the application areas for Information
Visualisation is Scientific Visualisation, where
applied computational science methods produce
output that could not be used without visualisation.
This happens because huge amounts of produced
data require the high bandwidth of the human visual
system (both its speed and sophisticated pattern
recognition), and interactivity adds the power
(Uselton, 1995). Visualisation systems provide a
single context for all the activities involved from
debugging the simulations, to exploring the data, and
communicating the results.
Other information visualisation application area is
the Software Visualisation, defined as the use of “the
crafts of typography, graphic design, animation, and
cinematography with modern human-computer
interaction technology to facilitate both the human
understanding and effective use of computer
software” (Price et al., 1994). By computer software,
Price, Baecker, and Small intend to include all the
software design process from planning to
implementation. These authors present taxonomy for
systems involved in the visualisation of computer
software.
Chen discusses the use of information
visualisation and virtual environments, presenting
the StarWalker virtual environment (Chen, 1999).
For research opportunities, Uselton points out,
among others, the need for new interaction tools and
techniques; new mappings of data to visual
attributes; new kinds of visuals, and automatic
selection of data or mappings (Uselton, 1995).
Hearst reports that a lot of the new information
visualisation methods have not been evaluated
(Hearst, 1998).
3 FINAL REMARKS
Information management has been recognized as a
fundamental activity by large organizations,
including some governments. In the US, the federal
administration pioneered the management of
information resources in the 70s, and gives high
priority to information management in general. Not
incidentally, these organizations show a level of
readiness for doing electronic business that other
information-unaware organizations lack.
Since the 80s, some authors have proposed
frameworks for information management, and for its
integration with information systems and technology
management. Some of the proposals were inspired in
Library and Information Science views, some in the
Database and Systems design views. M. Earl, at the
London Business School, proposed the information
triangle, and defined the three management
activities, with clear roles and responsibilities (Earl,
1988):
• Information Systems strategy: is demand
driven, has a business emphasis, can be
considered as doing business with IT;
basically answers the “what” we need
question;
• Information Technology strategy: is
offer driven, has a technology emphasis,
can be considered as doing IT with
business; basically answers the “how”
we do it question;
ICEIS 2004 - HUMAN-COMPUTER INTERACTION
218

• Information Management strategy: is
management driven, has a management
emphasis, can be considered as doing IT
and business; basically answers the
“who” does it question;
As a result, such activities can be seen as highly
dependent from human understanding. For such
issues regarding information management, both
visualization and information visualization can
become an important tool to support the individual
and its relation with information within
organisations.
REFERENCES
Andrews, K. (1997). Information Visualisation pointers.
Lecture notes. Graz University of Technology,
(available at http://www.2iicm.edu/ivis).
Beaudoin, L., Parent, M. and Vroomen, L. (1996).
Cheops: a compact explorer for complex hierarchies.
Proceedings of IEEE Visualization’96. 27 October – 1
Nov. San Francisco, USA.
Benford, S. and Mariani, J. (1994). Populated Information
Terrains: Virtual Environments for Sharing Data.
Research report: CSCW/4/1994. Lancaster University.
Benford, S., Snowdon, D., Greenhalgh, C., Ingram, R.,
Knox, I. and Brown, C. (1995). VR-VIBE: A Virtual
environment for co-operative information retrieval.
Eurographics’95, 30th August – 1st Sept, Maastricht,
The Netherlands. Computer Graphics Forum, 14(3),
pp 349-360.
Benford, S., Snowdon, D., Colebourne, A., O'Brien, J. and
Rodden, T. (1997). Informing the Design of
Collaborative Virtual Environments. Proceedings
ACM SIGGROUP Conference on Supporting Group
Work (Group'97). Phoenix Arizona. ACM, pp 71-80.
Bertin, J. (1967). Semiology of Graphics: Diagrams,
Networks, Maps. Madison, WI: University of
Wisconsin Press.
Buscher, M., Mogensen, P., Shapiro, D. and Wagner, I.
(1999). The Manufaktur: Supporting Work Practice in
(Landscape) Architecture. Bodker, S., Kyng, M.,
Schmidt, K. (eds.). Proceedings of the Sixth European
Conference on Computer-Supported Cooperative
Work (ECSCW’99), 12-16 September 1999,
Copenhagen, Demmark. Kluwer, pp 21-40.
Card, S., Robertson, G. and Mackinlay, J. (1991). The
Information Visualizer and Information Workspace.
Proceeedings of the ACM conference on Human
Factors in Computing Systems (CHI’91). 28 April – 2
May. New Orleans, LA: ACM press, pp 181-188.
Card, S., Mackinlay, J. and Shneiderman, B. (1999).
Readings in Information Visualisation. Using vision to
think. San Francisco, California: Morgan Kaufmann
Publishers.
Chalmers, M. and Chitson, P. (1992). BEAD: Explorations
in Information Visualisation. Proceedings of
SIGIR'92. Special issues of SIGIR forum, June. ACM
Press, pp 330-337.
Chen, C. (1999). Information Visualisation and Virtual
Environments. London: Springer
Cleveland, W. (1985). The elements of graphing data.
Monterrey, California: Wadsworth.
Colebourne, A., Mariani, J. and Rodden, T. (1996). Q-PIT:
A Populated Information Terrain. Grinstein, G. and
Erbacher, R. (Eds.). Visual Data Expl. and Analysis
III, pp 12-22. SPIE.
Eick, S. and Wills, G. (1995). High Interaction Graphics.
European Journal of Operational Research, no 81, pp
445-459.
Earl, M., Information Management: the Strategic
Dimension, Oxford University Press, 1988.
Hamming, R. (1962). Numerical Methods for Scientists
and Engineers. McGraw-Hill.
Hearst, M. (1998). Information Visualisation and
presentation, introduction. SIMS 247, University of
California at Berkeley. Internal report.
IC&V. (1997). Intelligent Collaboration & Visualisation.
DARPA, (available at http://ito.darpa.mil/research
/icv/index.html).
Jern, M. (1997). Visual User Interface: A Third-
Generation GUI Paradigm. In Earnshaw, R. and
Vince, J. and Jones, H. (Eds.) Vis & Modeling.
London: Academic Press, pp 439-459.
Johnson-Laird, P. (1993). The Computer and the Mind, an
introduction to Cognitive Science. Second Edition.
London: Fontana Press.
McCornick, B. and DeFanti, T. (1987). Visualization in
Scientific Computing. Computer Graphics &
Applications, vol. 6, no 21, November, pp 61-70.
Norman, D. (1998). The invisible computer. Cambridge,
Massachusetts: The MIT Press.
Olsen, K., Korfhage, R., Sochats, K., Spring and M.
Williams, J. (1993). Visualisation of a Document
Collection: the VIBE system. Info Proc. and
Management, vol. 29: no 1, pp 69-81.
Price, B., Baecker, R. and Small, I. (1994). A Principled
Taxonomy of Software Visualisation. Journal of
Visual Languages and Computing Vol. 4, no 3, pp.
211-266.
Tufte, E. (1983). The Visual Display of Quantitative
Information.Graphic Press.
Tufte, E. (1997). Visual Explanations. Images and
quantities, evidence and narrative. Cheshire,
Connecticut: Graphic Press.
Turner, G., Haus, J., Newton, G., Ribarsky, W., Hodges,
L. and Faust, N. (1996). 4D symbology for sensing
and simulation. Report GIT-GVU-96-12, Proceedings
of the SPIE Aerospace/Defense Sensing & Controls
Symposium, April. Proc. SPIE Vol. 2740, pp 31-41.
Uselton, S. (1995). Scientific Visualisation and
Computational Science: Natural Partners. AAAS
USING VISUALS TO CONVEY INFORMATION
219

Annual Meeting. 16-17 February. Atlanta, Georgia.
EUA.
Ware, C. (2000). Information Visualization: perception for
design. London. Morgan Kaufman.
Wood, J., Wright, H. and Brodlie, K. (1997). CSCV:
Computer Supported Collaborative Visualisation.
Earnshaw, R., Vince, J. and Jones, H. (Eds.)
Visualisation & Modeling. London: Academic Press,
pp 13-25.
Young, P. (1996). Three Dimensional Information
Visualisation. Computer Science Technical Report, No
12/96. University of Durham.
Yu, C. (1995). Visualisation Techniques of Different
Dimensions. Division of Psychology in Education.
Internal report. Arizona State University.
ICEIS 2004 - HUMAN-COMPUTER INTERACTION
220
