
A ROBUST WATERMARKING SCHEME BASED ON EDGE
DETECTION AND CONTRAST SENSITIVITY FUNCTION
John N. Ellinas
Department of Electronic Computer Systems,Technological Education Institute of Piraeus, 12244 Egaleo, Greece
Dimitrios E. Manolakis
Department of Automation, Alexander Technological Education Institute of Thessaloniki, 57400 Thessaloniki, Greece
Keywords: Image watermarking, wavelet transform, Human Visual System, Contrast Sensitivity Function.
Abstract: The efficiency of an image watermarking technique depends on the preservation of visually significant
information. This is attained by embedding the watermark transparently with the maximum possible
strength. The current paper presents an approach for still image digital watermarking in which the
watermark embedding process employs the wavelet transform and incorporates Human Visual System
(HVS) characteristics. The sensitivity of a human observer to contrast with respect to spatial frequency is
described by the Contrast Sensitivity Function (CSF). The strength of the watermark within the
decomposition subbands, which occupy an interval on the spatial frequencies, is adjusted according to this
sensitivity. Moreover, the watermark embedding process is carried over the subband coefficients that lie on
edges where distortions are less noticeable. The experimental evaluation of the proposed method shows very
good results in terms of robustness and transparency.
1 INTRODUCTION
The rapid evolution of multimedia systems and the
wide distribution of digital data over the World
Wide Web addresses the copyright protection of
digital information. The aim is to embed copyright
information, which is called watermark, on digital
data (audio or visual) in order to protect ownership.
In general, a digital watermarking technique must
satisfy two requirements. First, the watermark
should be transparent or perceptually invisible for
image data. The second requirement is that the
watermark should be resistant to attacks that may
remove it or replace it with another watermark. This
implies that the watermark should be robust to
common signal processing operations, such as
compression, filtering, enhancements, rotation,
cropping and translation.
The digital image watermarking techniques in the
literature are typically grouped in two classes: the
spatial domain techniques (Schyndel et al., 1994;
Bender et al., 1996; Wolfgang and Delp, 1996)
which embed the watermark by modifying the pixel
values of the original image and the transform
domain techniques which embed the watermark in
the domain of an invertible transform. The discrete
cosine transform (DCT) and the discrete wavelet
transform (DWT) are commonly used for
watermarking purposes (Swanson et al., 1996; Cox
et al., 1997; Xia et al., 1997; Kim and Moon, 1997;
Dugad et al., 1998; Hsu and Wu, 1999; Wolfgang et
al., 1999; Barni et al., 2001). The transform domain
algorithms modify a subset of the transform
coefficients with the watermarking data and
generally achieve better robustness than spatial
domain methods. Optionally, they may employ a
human visual perception model to weight the
strength of the embedded data. Several research
works employ the wavelet transform because it
presents a number of advantages over the DCT. The
wavelet transform is closer to the human visual
system since it splits the input image into several
frequency bands that can be processed
independently. It is a multi-resolution transform that
permits to locate image features such as smooth
areas, edges or textured areas. Some watermarking
schemes embed watermarking data in textured areas
93
N. Ellinas J. and E. Manolakis D. (2007).
A ROBUST WATERMARKING SCHEME BASED ON EDGE DETECTION AND CONTRAST SENSITIVITY FUNCTION.
In Proceedings of the Second International Conference on Computer Vision Theory and Applications - IFP/IA, pages 93-100
Copyright
c
SciTePress
or edges where human visual system (HVS) is less
sensitive. Many HVS models have been developed
for quality assessment or image compression (De
Vleeschouwer et al., 2002). Similar visual models
are employed for digital watermarking with a great
success. One model for perceptual watermarking
exploits the contrast sensitivity of the human eye
over the spatial frequency, which is described by the
contrast sensitivity function (CSF), in order to
weight the coefficients of a transform domain.
In this paper, an additive watermarking algorithm
embeds the signature data to selected groups of
wavelet transform coefficients, weighting the
watermark strength according to the CSF sensitivity
of the subband where the corresponding coefficients
reside. The input image is decomposed into four
levels by a DWT, an approximation subband
including the low frequency components and 12
detail subbands including the high frequency
components. Every subband occupies a specific
spatial frequency interval that corresponds to an
average contrast sensitivity factor which is the
weight of the watermark strength. Moreover, the
proposed algorithm detects edges in each subband
and distributes the watermark energy in these
regions, where HVS is less sensitive to. Finally, the
receiver detects the signature data by correlating the
watermarked image with the watermark sequence
and comparing the correlation factor to a threshold
value. The motivation of the present work is to adapt
a watermark sequence to the local image properties
by employing a visual model, providing a
transparent and robust watermark.
2 CSF CHARACTERISTICS
The characteristics of the contrast sensitivity
function in HVS model may be applied on the
coefficients of the detail subbands in the wavelet
decomposition of an image.
2.1 The Contrast Sensitivity Function
Based on the research of the human visual system,
several mathematical models have been devised to
characterize humans’ sensitivity to brightness and
color (Wandell, 1995). The contrast sensitivity
function describes humans’ sensitivity to spatial
frequencies. A model of the CSF for luminance (or
grayscale) images, originally proposed by Mannos
and Sakrison (Mannos and Sakrison, 1994), is given
by:
1.1
)114.0(
)114.0192.0(6.2)(
f
effCSF
−
+=
(1)
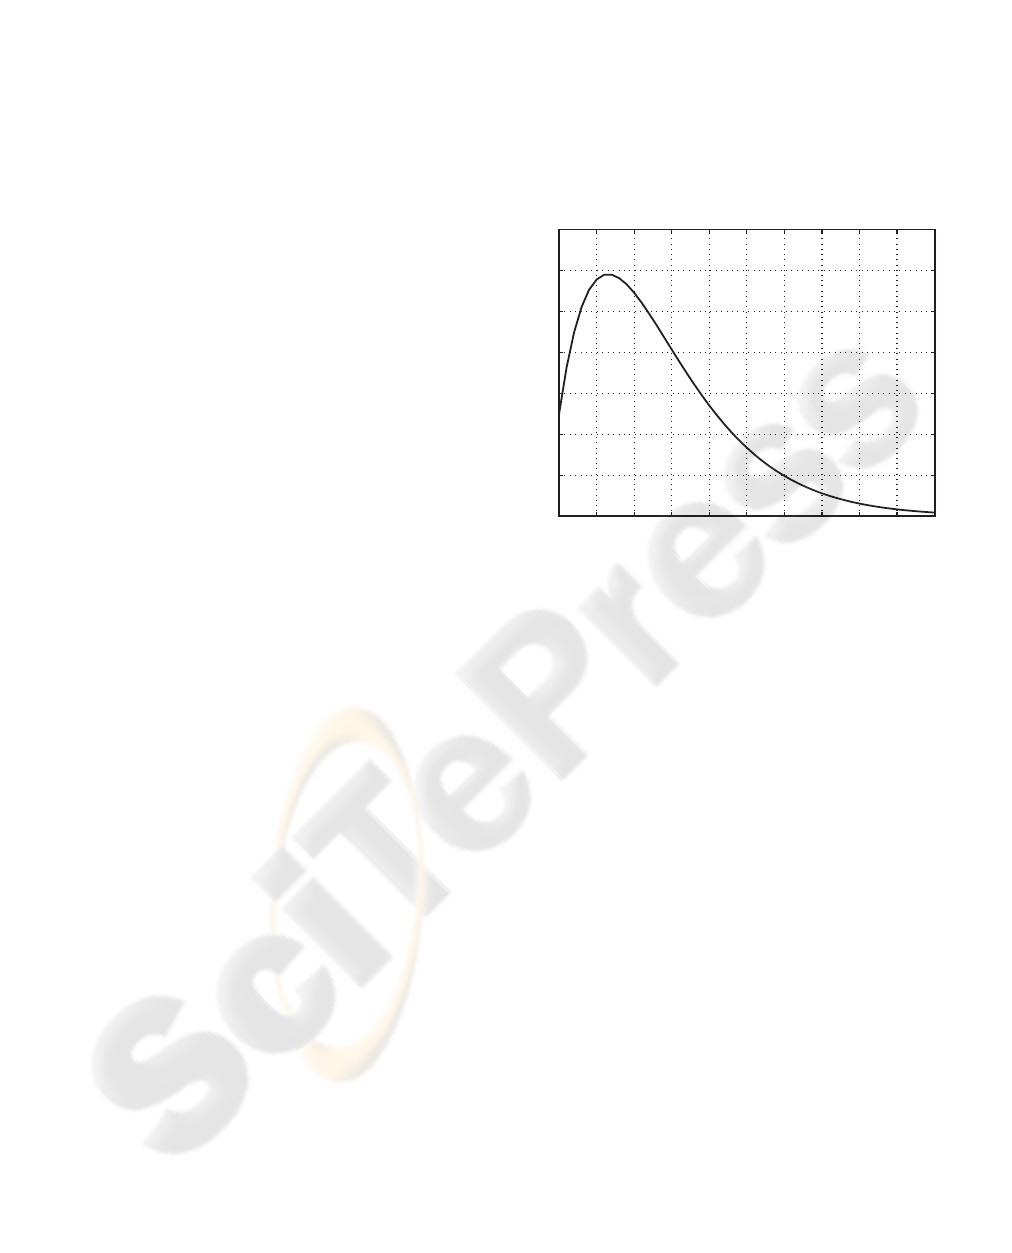
Fig. 1 illustrates the CSF curve which
characterizes the luminance sensitivity of HVS with
respect to spatial frequency. According to this curve,
HVS is less sensitive at very low and very high
frequencies. The properties of CSF may be used to
weight the watermark embedded data so that to be
transparent for a human observer.
Figure 1: Luminance contrast sensitivity function.
2.2 CSF Weighting in DWT Domain
The DWT decomposes a two dimensional image
into subbands using low and high pass filters for the
rows and columns successively. The edge
components of the image are confined within the
high frequency part (detail subbands) whereas the
low frequency part (approximation subband) splits
again until reaching the desired resolution.
Fig.2 shows a four level wavelet decomposition
where each subband is covered by a specific spatial
frequency range. For example, subband HL3 of level
l=3 and orientation θ=1, which describes the vertical
details by indicating the luminance variations along
the horizontal direction, is covered by horizontal
frequencies from 0.125f
max
to 0.25f
fmax
and vertical
frequencies from 0 to 0.125f
max
. The area of the CSF
along the horizontal and vertical directions that
corresponds to the spatial frequency range covered
by this subband is shaded. Therefore, the weighting
for the coefficients of the specific subband must be
estimated by the shaded portions of the CSF
function.
0 5 10 15 20 25 30 35 40 45 5
0
0
0.2
0.4
0.6
0.8
1
1.2
1.4
Relative sensitivity
Spatial frequency (cycles/degree)
VISAPP 2007 - International Conference on Computer Vision Theory and Applications
94
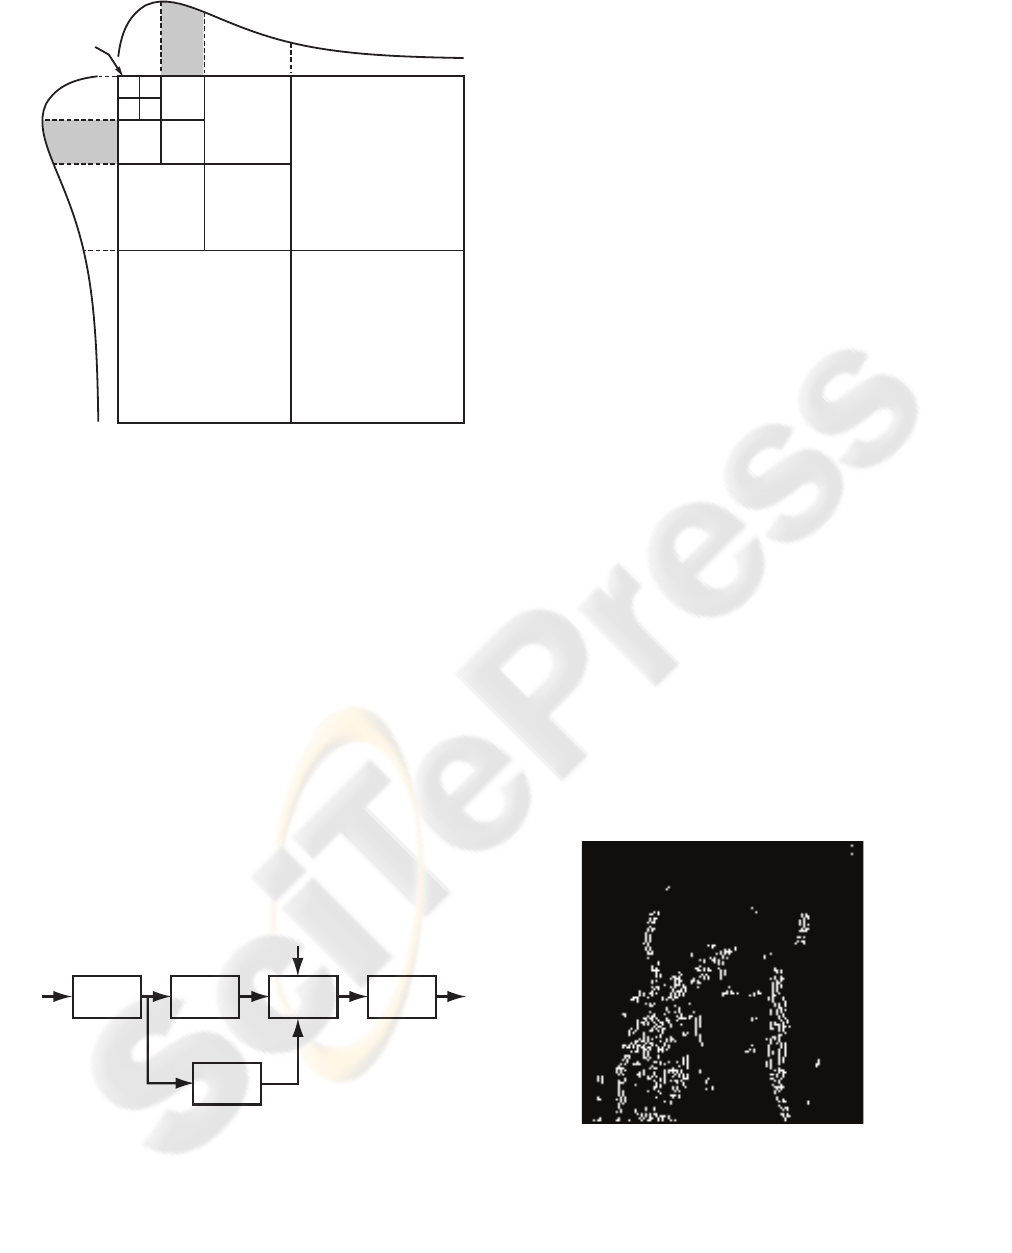
Figure 2: Luminance CSF along horizontal and vertical
directions of four level wavelet decomposition.
3 CSF BASED WATERMARKING
The CSF exploitation in the watermarking process is
accomplished by weighting the coefficients of the
wavelet transform according to the subband they
belong to. The additive embedding algorithm and its
detection at the receiver’s end are analyzed as
follows:
3.1 The Watermark Embedding
Process
Fig. 3 shows the overall process of watermark
insertion. The input image is subjected to a four
level DWT decomposition using the Daubechies 8-
tap filter.
Figure 3: Block diagram of the watermark insertion
process.
The perceptually important wavelet coefficients of
each subband are detected by Sobel edge detector.
To the selected coefficients, the watermark is
inserted in an additive way using (2). The detail
subbands, where the watermark is inserted, contain
edge information or high frequency coefficients.
Consequently, adding the watermark to these
coefficients makes the insertion invisible to the
human visual system. Moreover, the insertion is
weighted according to the sensitivity of the human
visual system to the contrast, which depends on the
spatial frequency.
vuvu
l
lvuvu
NXwXY
,
'
,
'
,
'
,
θ
α
+=
(2)
where
'
,vu
Y are the modified wavelet coefficients,
'
,vu
X
are the edge selected wavelet coefficients,
l
α
is a level dependent parameter controlling the
watermark strength,
θ
l
w
is the subband visual weight
at level
l
and orientation
θ
, and
vu
N
,
is the
watermark sequence which is represented by
Gaussian noise with zero mean and unit variance.
Fig. 4 illustrates the perceptually significant
wavelet coefficients of the vertical detail subband at
level 2 for “Lena”. The visual weighting factors for
each subband are estimated by averaging the portion
of the CSF curve that corresponds to the high spatial
frequency part. The magnitude of the watermark
strength scale factor is selected for each level of the
wavelet decomposition such that not severely
degrading the watermarked image quality and
considering the fact that the average magnitude of
the coefficients is approximately doubled in each
level from the finest to the coarsest resolution.
Figure 4: Edge coefficients of the vertical orientation
subband at level 2.
DWT
x
i,j
X
u,v
X
'
u,v
edge
detector
watermark
insertion
IDWT
Y
'
u,v
y
i,j
CSF
weighting
N
u,v
w
l
è
Vertical detail
LH1 - è=1
Diagonal detail
HH1 - è=2
Horizontal detail
HL1 - è=3
LL
è=0
f
max
/2
f
max
/2
f
max
/4
f
max
/4
horizontal
vertical
LH2
HH2HL2
LH3
HH3HL3
A ROBUST WATERMARKING SCHEME BASED ON EDGE DETECTION AND CONTRAST SENSITIVITY
FUNCTION
95

3.2 The Watermark Detection Process
The possibly distorted watermark sequence is
detected by combining the original image
x
with
the possibly distorted watermarked image
*
y
reversing the steps of the insertion process, as Fig. 5
shows.
Figure 5: Block diagram of the watermark detection
process.
The extraction process is performed by
subtracting the original perceptual significant
coefficients from the corresponding received
watermarked coefficients (which may have been
attacked and distorted) and scaling the difference by
the weighting and watermark strength factors. The
watermark detection is accomplished without
referring to the original image, considering the
correlation between the watermarked coefficients
and the watermarking sequence (Barni et al., 2001):
∑∑
−
=
−
=
=
1
0
1
0
,
'
,
1
M
u
N
v
vuvu
NY
MN
ρ
(3)
where
'
,vu
Y represents the watermarked perceptually
significant coefficients and
vu
N
,
is the watermark
sequence.
The correlation factor is compared to a threshold
value, as in (4)
watermarkfalseT
watermarktrueT
w
w
〈
〉
ρ
ρ
(4)
where
2
297.3
σ
=
w
T
(5)
Variance
σ
is defined as
()
2
1
0
1
0
'
,
2
)(
1
∑∑
−
=
−
=
ΜΝ
=
M
u
N
v
vu
Y
σ
(6)
3.3 Image Quality Assessment
The objective evaluation of image quality is
performed by the PSNR, which is defined as
⎟
⎠
⎞
⎜
⎝
⎛
×
=
mse
PSNR
255255
log10
10
(7)
where
mse is the mean square error:
[]
2
1
0
1
0
),(),(
1
∑∑
−
=
−
=
−=
M
i
N
j
jiyjix
MN
mse
(8)
where
M
,
N
are the dimensions of the input image
and
y
x
, are the original and the watermarked
images.
However, PSNR declines from the perceived
subjective quality because the HVS does not
correlate well with the square of the error. For this
reason, the weighted PSNR that takes into account
the local variance is also used as follows:
⎟
⎠
⎞
⎜
⎝
⎛
×
=
wmse
wPSNR
255255
log10
10
(9)
where
2
1
0
1
0
),var(1
),(),(1
∑∑
−
=
−
=
⎥
⎦
⎤
⎢
⎣
⎡
+
−
=
M
i
N
j
ji
jiyjix
MN
wmse
(10)
4 EXPERIMENTAL RESULTS
The proposed method is evaluated in four images:
“Lena”, which is an image with large smooth
regions, “Barbara”, “Baboon” and “Boat”, which
have textured regions. The size of all images is
512×512 pixels. The performance measures are the
invisibility of the inserted watermark and the
robustness of the method against various types of
attacks. The attacks employed for testing are JPEG
compression, median filtering, Gaussian noise and
cropping.
DWT
x
i,j
X
u,v
X
'
u,v
edge
detector
similarity
measure
Y
'
u,v
y
i,j
decision
threshold
N
u,v
w
l
è
DWT
CSF
weighting
*
*
-
VISAPP 2007 - International Conference on Computer Vision Theory and Applications
96
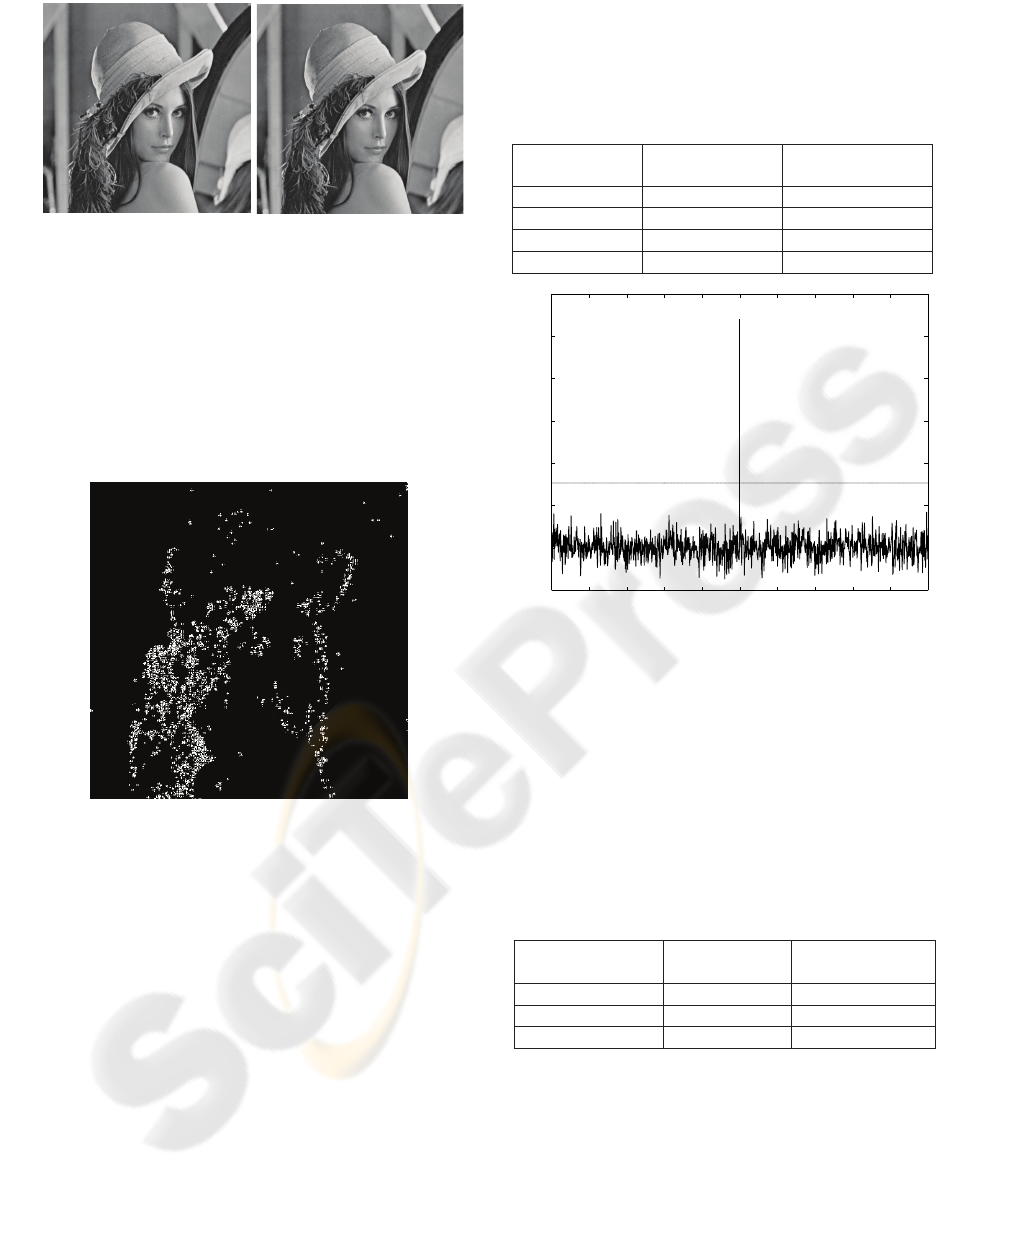
(a) (b)
Figure 6: (a) Original image; (b) Watermarked image.
Fig. 6 shows the original image of “Lena” and its
watermarked copy whereas Fig. 7 shows their
difference. It is obvious that the watermarked copy
is undistinguishable from the original image. In the
difference, which is suitably scaled for display, it is
evident that most of the watermark data are added to
the edges where they are perceptually invisible.
Figure 7: Scaled difference between original and
watermarked images.
Table 1 depicts the objective quality values of
the proposed method for the tested images. These
values are obtained setting the watermark strength
factor to a low value so that the detector response is
just over the threshold value. It is well known that
the two desirable features of watermarking,
invisibility and robustness, are contradictory. Thus,
the values of the watermark strength factor
l
α
are
properly tuned so that the watermarking sequence is
completely invisible although robustness is at a
medium level. Fig. 8 shows the response of the
watermark detector to 1000 randomly generated
watermarks, with the original watermark placed in
the middle. In this case, the watermark strength is
such that the watermark sequence is robust enough
and the objective quality of the watermarked image
is just above 35 dB, which is a typical value just
before image is degrading.
Table 1: PSNR and wPSNR values of watermarked test
images.
Images
PSNR
(dB)
wPSNR
(dB)
Lena 45.18 65.66
Barbara 44 64.21
Baboon 42.65 61.95
Boat 44.45 63.67
Figure 8: Response of watermark detector for “Lena”.
Table 2 shows the effectiveness of the proposed
scheme against two other typical algorithms on
wavelet-based watermarking (Dugad et al., 1998;
Kim and Moon, 1999). The first method employs a
unique threshold value over all the detail subbands
for embedding the signature data, whereas the
second method uses level adaptive thresholding for
more accurate estimation of edge coefficients.
Table 2: PSNR and detector response values of three
watermarking schemes for the test image “Lena”.
Algorithms
PSNR
(dB)
Detector
response
Proposed 35.11
53.76
Dugad et al. 35.73 28.20
Kim and Moon 35.18 43.60
The proposed scheme outperforms significantly
over the other two methods for about the same
objective quality of the watermarked image. This
robust performance lies on the fact that watermark
data are placed exactly on the detected edges where
HVS is less sensitive to distortions. The threshold
values employed by the other algorithms can not
0 100 200 300 400 500 600 700 800 900 100
0
−10
0
10
20
30
40
50
60
Watermarks
Detector response
A ROBUST WATERMARKING SCHEME BASED ON EDGE DETECTION AND CONTRAST SENSITIVITY
FUNCTION
97
exactly locate the edges on the wavelet domain and
for that reason some watermark data are placed on
coefficients that affect the quality of the image.
Moreover, in the proposed method there are no
threshold values that are image dependent and their
tuning to optimum values is a serious drawback.
To appreciate the robustness of the proposed
method against several common attacks, the
following experiments were performed in “Lena”
image.
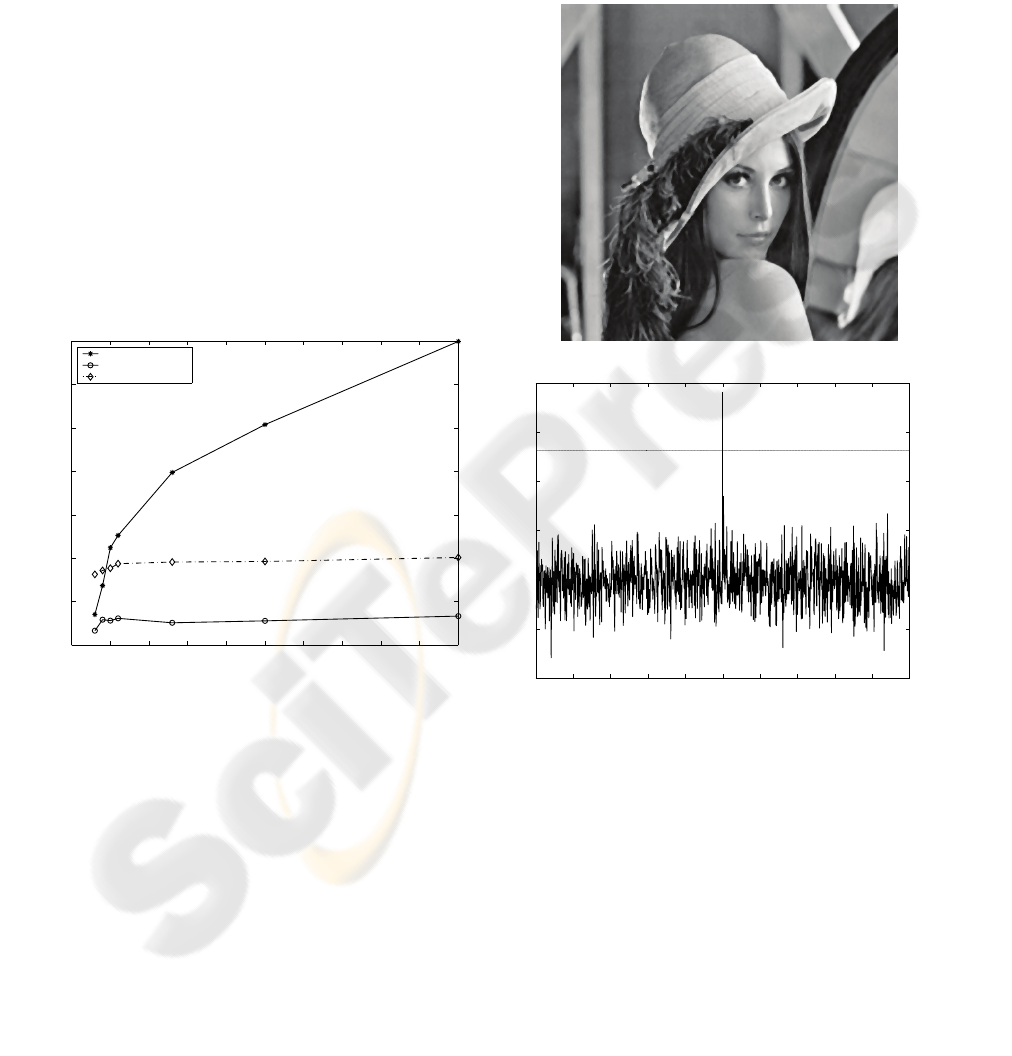
Firstly, JPEG coding with variable quality factor
was applied to the watermarked image and 1000
watermarks were inserted for examining the
detector’s response about their presence. In Fig. 9,
the response of the detector to the embedded
watermark is plotted against the JPEG quality factor.
Also, the detection threshold and the second highest
response are shown. The detector response remains
above threshold up to a quality factor of 5 whereas
the second highest response remains always under
the threshold value. This proves the robustness of
the proposed method against JPEG compression.
Figure 9: Detector response versus JPEG quality factor.
Fig. 10(a) illustrates the watermarked image
after median filtering with a window size of 3×3
whereas Fig. 10(b) shows the detector response to
this kind of attack. Comparing this figure with Fig.
8, we observe that correlation factor decreases to
about one third of its initial value because of median
filtering. This may be explained since median
filtering smoothes the edges of an image where
nearly all of the watermarking data have been
embedded.
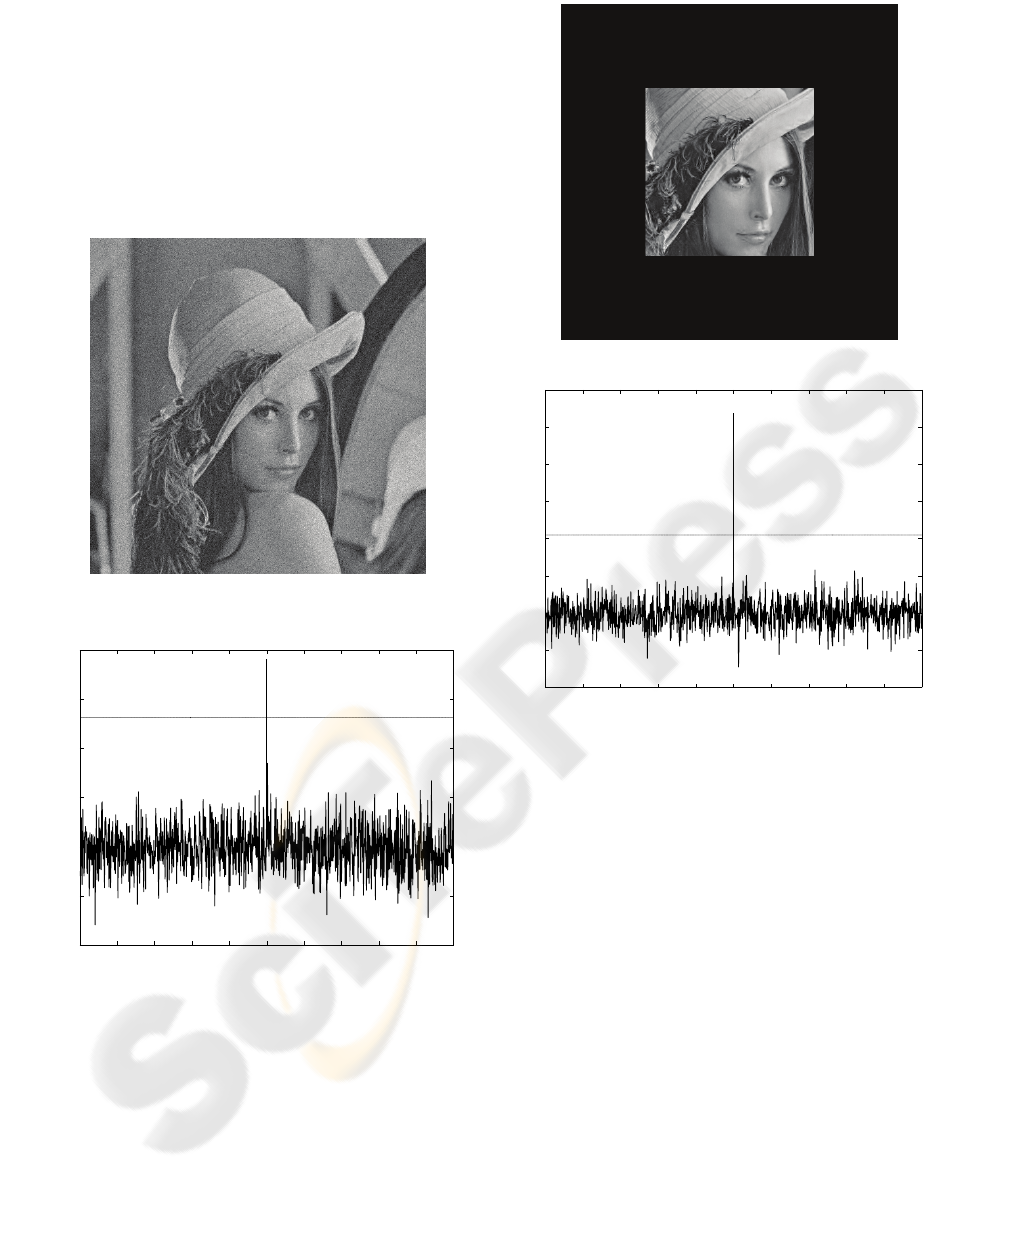
The proposed method is quite immune to
Gaussian noise, as Fig. 11 shows. Fig. 11(a) presents
the watermarked copy which has been contaminated
with Gaussian noise of zero mean and variance of 20
whereas Fig. 11(b) shows the detector response. The
output of the detector is slightly lower than that of
Fig. 8, where no attack is involved.
Finally, the robustness of the proposed
watermarking method against cropping is examined.
When the watermarked image is cropped, part of the
embedded information is discarded making the
detection more elaborate.
(a)
(b)
Figure 10: (a) Watermarked copy after median filtering;
(b) Detector response of the attacked watermarked image.
Thus, it is important the watermark method to
spread the information all over the image so that, if
possible, any remaining part to include enough
information for the watermark recovery. Our
experiment on cropping is to examine the resilience
of the watermark after the removal of a substantial
part of the original image. Fig. 12(a) shows the
cropped watermarked image which is half of the
original image. The ability of the decoder to trace
the watermark of the sub-image is shown in Fig.
0 5 10 15 20 25 30 35 40 45 5
0
5
10
15
20
25
30
35
40
Quality factor
Detector response
inserted watermark
second highest peak
threshold level
0 100 200 300 400 500 600 700 800 900 100
0
−10
−5
0
5
10
15
20
Watermarks
Detector response
VISAPP 2007 - International Conference on Computer Vision Theory and Applications
98
12(b). It is quite impressive that the detector
response is well above threshold, revealing the
robustness of the proposed method. The watermark
sequence is hidden on the wavelet coefficients that
reside on the detail subbands or on the edges which
exist all over the input image. The proposed method
may be less effective when the remaining part
contains mainly smooth areas where the embedded
information is less, but this is difficult to be
accomplished.
(a)
(b)
Figure 11: (a) Watermarked copy after Gaussian noise; (b)
Detector response of the attacked watermarked image.
(a)
(b)
Figure 12: (a) Cropped watermarked copy; (b) Detector
response of the cropped watermarked image.
5 CONCLUSIONS
In this paper, a novel method for image
watermarking has been presented. The method
embeds the watermarking data on selected wavelet
coefficients of the input image considering the CSF
characteristics of the HVS. The selected coefficients
reside on the detail subbands and describe the edges
of the image. Thus, exploiting the HVS which is less
sensitive to alterations on high frequencies, the
embedded information becomes invisible. The
evaluation of the proposed method shows very good
performance as far as invisibility and robustness is
concerned. The proposed scheme behaves very well
in various common signal processing methods as
compression, filtering, noise and cropping.
0 100 200 300 400 500 600 700 800 900 100
0
−10
−5
0
5
10
15
20
Watermarks
Detector response
0 100 200 300 400 500 600 700 800 900 100
0
−10
−5
0
5
10
15
20
25
30
Watermarks
Detector response
A ROBUST WATERMARKING SCHEME BASED ON EDGE DETECTION AND CONTRAST SENSITIVITY
FUNCTION
99

ACKNOWLEDGEMENTS
The project is co-funded by the European Social
Fund and National Resources-EPEAEK II-
ARCHIMEDES granted to Technological Education
Institute of Thessaloniki under program number 10.
REFERENCES
Schyndel, R., Tirkel, A. and Osborne, C., 1994. A digital
watermark. In IEEE Proc. of International Conference
on Image Processing 1994.
Bender, W., Gruhl, D., Morimoto, N. and Lu, A., 1996.
Techniques for data hiding. In IBM Systems Journal,
35(3-4).
Wolfgang, R. B. and Delp, E. J., 1996. A watermark for
digital images,” In IEEE Proc. of International
Conference on Image Processing 1996.
Swanson, M. D., Zhu, B. and Tewfik, A. H., 1996.
Transparent robust image watermarking. In IEEE
Proc. of International Conference on Image
Processing 1996.
Cox, I. J., Kilian, J., Leighton, T. and Shamoon, T., 1997.
Secure spread spectrum watermarking for multimedia.
In IEEE Transactions on Image Processing, 6(12).
Barni, M., Bartolini, F. and Piva, A., 2001. Improved
wavelet-based watermarking through pixel-wise
masking. In IEEE Transactions on Image Processing,
10(5).
Xia, X., Boncelet, C. G. and Arce, G. R., 1997. A
multiresolution watermark for digital images. In IEEE
Proc. of International Conference on Image
Processing 1997.
Kim, J. R. and Moon, Y. S., 1999. A robust wavelet-based
digital watermarking using level-adaptive
thresholding. In IEEE Proc. of International
Conference on Image Processing 1999.
Hsu, C. T. and Wu, J. L., 1999. Hidden digital watermarks
in images. In IEEE Transactions on Image Processing,
8(1).
Dugad, R., Ratakonda, K. and Ahuja, N., 1998. A new
wavelet-based scheme for watermarking images. In
IEEE Proc. of International Conference on Image
Processing 1998.
Wolfgang, R. B., Podilchuk, C. I. and Delp, E. J., 1999.
Perceptual watermarks for digital images and video. In
SPIE Proc. of International Conference on Security
and watermarking of multimedia contents 1999.
De Vleeschouwer, C., Delaigle, J. F. and Macq, B., 2002.
Invisibility and application functionalities in
perceptual watermarking an overview. In IEEE Proc.,
90(1).
Wandell, B. A., 1995. Foundations of Vision, Sinauer
Associates Inc., Sunderland MA.
Mannos, J. and Sakrison, D., 1974. The effects of a visual
fidelity criterionon the encoding of images. In IEEE
Transactions on Information Theory, 20.
VISAPP 2007 - International Conference on Computer Vision Theory and Applications
100
