
3D SPATIAL DATA MINING ON DOCUMENT SETS FOR THE
DISCOVERY OF FAILURE CAUSES IN COMPLEX TECHNICAL
DEVICES
Timo Götzelmann,
1
Knut Hartmann,
1
Andreas Nürnberger
2
and Thomas Strothotte
1
1
Department for Simulation and Graphics
2
Department for Knowledge and Language Engineering
Keywords:
Spatial data mining, visualization, association rules, discovery of error causes, product improvement.
Abstract:
The retrospective fault analysis of complex technical devices based on documents emerging in the advanced
steps of the product life cycle can reveal error sources and problems, which have not been discovered by
simulations or other test methods in the early stages of the product life cycle. This paper presents a novel
approach to support the failure analysis through (i) a semi-automatic analysis of databases containing product-
related documents in natural language (e. g., problem and error descriptions, repair and maintenance protocols,
service bills) using information retrieval and text mining techniques and (ii) an interactive exploration of the
data mining results. Our system supports visual data mining by mapping the results of analyzing failure-related
documents onto corresponding 3D models. Thus, visualization of statistics about failure sources can reveal
problem sources resulting from problematic spatial configurations.
1 INTRODUCTION
Our approach to retrospectively analyze error sources
of complex technical devices has been inspired by
statistical analysis methods on patient data sheets
used in medical science and pharmaceutics in order
to detect correlations between potential causes and
diseases. Analogously, within the product life cycle
of complex technical devices, a multitude of different
documents emerge, which are often directly related
to errors or malfunctions. The statistical analysis
of comprehensive databases containing documents
in natural language which emerged throughout the
product life cycle can help to discover correlations
between conditions causing malfunctions and thus
help to find knowledge which is already present, but
hidden in the data. Due to the large number of
correlations and hypotheses which could be derived
through statistical methods, powerful visualization
techniques can assist domain experts in extracting
relevant data from complex data sets.
If these statistical data can be linked to a spatial
context, visualizations which integrate abstract data
into maps may reveal correlations even more easily
to a human observer than it is possible with abstract
statistical diagrams. A famous example of the power
of that type of visualization is the work of Dr. John
SNOW (a British physician and one of the fathers
of epidemiology), who detected the cause of the
great cholera epidemic in the year 1854, when many
thousands citizens died in London (Tufte, 1997). By
associating deaths statistics with addresses, where the
victims lived in, and their visualization on a map,
his graphics were able to communicate the source
of this disease — centrally located pumps incubated
with germs. Based on this idea meanwhile several
approaches have been proposed to map statistical
information based on geographic metadata. This
includes a broad variety of data and applications
(Bernhardsen, 2002), from studies in social sciences
(Orfor et al., 1997) to analysis and design of telephone
networks (Flavin and Totton, 1996; Schmidt, 1998).
Different to these approaches, that are based
usually on simple mappings based on geographic
metadata, the aim of the approach proposed in
this paper is to analyze a set of documents which
are describing malfunctions and errors for complex
technical devices, followed by a projection of the
results on a corresponding 3D model. Domain experts
can evaluate the results gained by the automatic
analysis of documents in natural language with a set
of standard data mining methods by exploring an en-
137
Götzelmann T., Hartmann K., Nürnberger A. and Strothotte T. (2007).
3D SPATIAL DATA MINING ON DOCUMENT SETS FOR THE DISCOVERY OF FAILURE CAUSES IN COMPLEX TECHNICAL DEVICES.
In Proceedings of the Second International Conference on Computer Graphics Theory and Applications - AS/IE, pages 137-145
DOI: 10.5220/0002082101370145
Copyright
c
SciTePress
riched 3D model interactively in order to find spatial
relationships between the different components of the
product.
This paper is organized as follows: After sketch-
ing an application scenario and considering some
basic questions and motivations of our approach, we
discuss the related work which inspired our work.
The next section defines the data basis and discusses
the individual steps of our visual data mining ap-
proach. Then we present some results which could
be achieved with our prototypical system. Finally, we
summarize the main assumptions and contributions of
our paper and provide ideas for future research.
2 CONTINUOUS FAILURE
ANALYSIS
The project which is presented in this paper was
driven by several questions:
1. Why are information retrieval and data mining
techniques useful in the proposed application
scenario?
2. Which visualization techniques are appropriate
for the spatial mapping of the results of informa-
tion retrieval and data mining techniques?
3. How to evaluate visual data mining techniques
based on large product-related document sets?
Our approach aims at a continuous evaluation of
failure causes over the full life cycle of a complex
technical device, i. e., in design, manufacturing, qual-
ity assurance, marketing, maintenance, and repair. In
all these stages a multitude of documents emerge,
some of them describing geometric aspects such as
3D models. One important aspect of the design
stage is to detect failure causes in order to minimize
the overall manufacturing, maintenance, and support
costs. Frequently, extensive simulations are run to test
important features and properties of a product, while
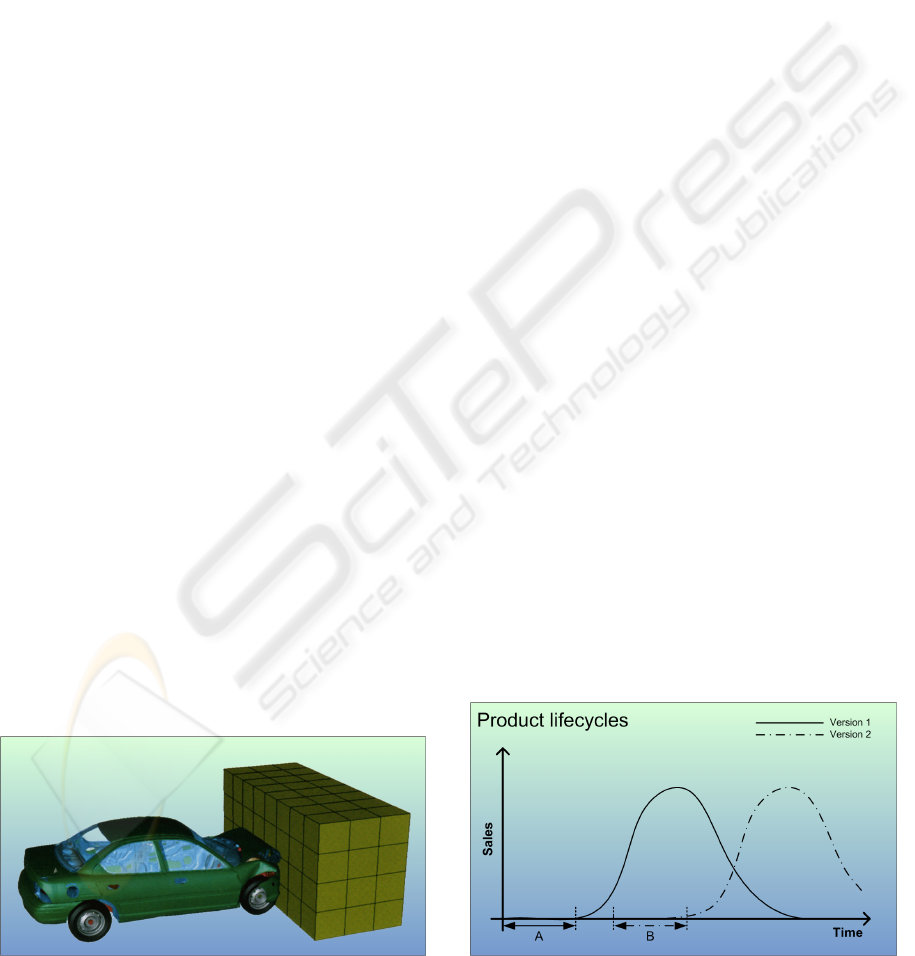
Figure 1: FEM crash-simulation of a virtual car (Source:
(Zienkiewicz and Taylor, 2000)).
powerful visualizations are needed to extract impor-
tant features from vast simulation datasets (Fig. 1
presents a visualization of a simulation of arising
deformations on a car using finite-element methods
FEM).
In order to discover a broad variety of failure
causes, our approach aims at extending failure tests
from the design stage to the entire product life cycle
by analyzing failure-related documents. When com-
plex technical devices are in use, they are typically
maintained and repaired in a continuous fashion. The
dealer’s workshops store documents about service
protocols and bills of the actions done with the
individual components of the products. While the
automatic analysis of information stored in structured
databases is well studied and broad amount of meth-
ods are available (Hand et al., 2001; Hipp et al., 2002;
Berthold and Hand, 2003), the automatic extraction of
a formal representation for the knowledge contained
in unstructured text documents is still beyond the cur-
rent state-of-the-art in natural language processing;
a manual analysis would be impossible due to the
pure amount of documents. Therefore, we employ
a combination of information retrieval and statistical
data analysis (text mining) techniques in order to
gather useful and statistically relevant information
that can then be used for visualization.
Semantically segmented 3D models, i. e., geo-
metric models where the individual geometric com-
ponents are associated with their denotation and
descriptive texts, enable a flexible spatial mapping
of results of statistical analysis. The spatial data
mining approach, i. e., the visualization of statistical
data on their spatial reference object by modifying
visual properties to encode data, can reveal a-priori
unknown facts, which were hidden in the database.
By interactively exploring the enriched 3D model,
unknown sources and correlations of failures can be
discovered that rely on the spatial configuration of
Figure 2: Overlapping development with former product
versions’ life cycles.
GRAPP 2007 - International Conference on Computer Graphics Theory and Applications
138

several components and the shape of complex formed
geometric objects.
As the product life cycles of the products in a
product family commonly overlap. The life cycle
starts with a developing stage (see Fig. 2-A and -
B). Often similar products are in the stage of selling
and servicing them while new products are already
in the developing stage (see Fig. 2-B). Hence, a
retrospective analysis of weak spots of on-market
products can help to improve new ones.
In the next section we briefly review the ter-
minology and the (visual and spatial) data mining
techniques that are closely related to our work.
The description of the architecture of our prototype
includes some preliminary answers to the second
question raised at the beginning of this section. The
discussion of the third challenge — an evaluation of
our approach — is given at the end of the paper.
3 RELATED WORK
TUFTE (Tufte, 1997, chap. 2) coined the term In-
formation Graphics for visualizations aiming at an
improved understanding of statistics and to detect
correlations in the statistical data. From TUFTE’s
point of view, SNOW’s cholera map and other hand-
made illustrations are ideal examples of information
graphics. But due to their static nature, neither
their style or other parameters of the presentation
nor their content can be adjusted to explore further
aspects of the underlying data in an interactive modus.
Hence, several research directions combine automatic
analysis techniques of large data sets with dynamic,
interactive visualizations:
The research in Data Mining (see for instance
(Witten and Frank, 1999; Hand et al., 2001; Berthold
and Hand, 2003; Tan et al., 2005)) is focused on
the non-trivial extraction of potentially significant
relationships and regularities which are implicit but
hidden in large databases (this aspect is focused
by another term Knowledge-Discovery in Databases
(Frawley et al., 1992)).
Humans have a great ability to recognize patterns.
Therefore, Visual Data Mining systems enable do-
main experts to adjust and control the data mining
process. The preprocessed data sets are visualized in
abstracted 2D or 3D graphics and can be interactively
explored. These visualizations can also be considered
as information graphics. Visual data mining uses
information visualization techniques to generate ab-
stract views of the preprocessed data (Keim, 2002).
However, external spatial information is neither taken
into account for determining association rules nor for
generating the visualizations.
Spatial Data Mining (see for instance (Ester et al.,
2000)) is a special type of visual data mining which
exploits spatial data contained in graphical informa-
tion systems (GIS). These systems generate maps that
contain additional data. The integration of statistic
data into a spatial context can help viewers to find new
relationships and rules. Note, that the cholera map
is a perfect example for these kind of visualizations.
Like in visual data mining, the visual capabilities
of domain experts to detect pattern are exploited by
combining the graphical and computational power of
interactive computer systems. The term Geographic
Data Mining (Miller and Han, 2001) is used for
systems, where the spatial context is restricted to GIS
data, i. e., two-dimensional spatial data.
The approach we propose in this paper naturally
extends the idea of spatial data mining: We project
abstract data related to real-world objects onto cor-
responding three-dimensional models. Subsequently,
the resulting visualization can be interactively ex-
plored by domain experts. Due to its characteristics
we call this approach 3D Spatial Data Mining.
4 A SPATIAL DATA MINING
ARCHITECTURE
The architecture of our spatial data mining approach
is presented in Fig. 3. Starting from a corpus of
documents, which are analyzed automatically and a
3D model serving as a corresponding spatial context,
our architecture comprises three sequential steps.
First, a domain expert restricts the analysis to a set
of relevant documents (data selection). The data
analysis comprises several text mining techniques
and an analysis of spatial relations between error
sources in the 3D model. Finally, the results
are visualized by adapting the visual properties of
corresponding geometric component in the 3D model
(data visualization). An interactive exploration of this
enriched 3D model enables domain experts to modify
all parameters of the data mining pipeline in order to
detect unknown failure sources. The next subsections
describe the individual components of the spatial data
mining pipeline in more detail.
4.1 Preprocessing the Corpus of
Documents
The data mining process is based on a set of
documents D (e. g., service reports, bills, problem
3D SPATIAL DATA MINING ON DOCUMENT SETS FOR THE DISCOVERY OF FAILURE CAUSES IN COMPLEX
TECHNICAL DEVICES
139
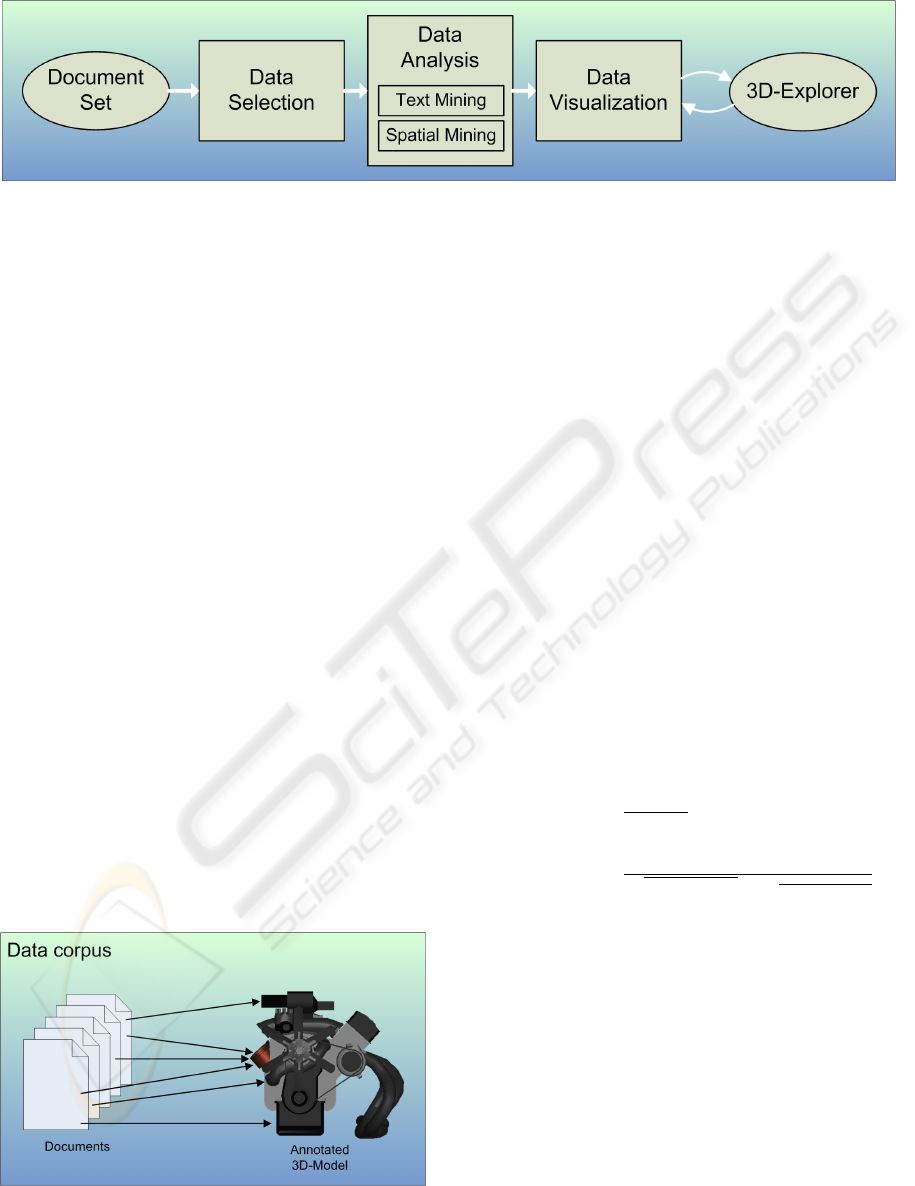
Figure 3: The process of 3D spatial data mining.
descriptions, . . . ). Each of the documents contain text
in natural language. We assume that the documents’
terms referring to individual components of the
technical device correspond to those terms used in the
semantic annotation of the individual component of
the 3D model (see Fig. 4). All fill-words and words
which are not used in the spatial context (i. e., in the
annotation of the 3D model M) are not considered
in the approach presented in this paper. Moreover,
our approach does not employ a syntactic or semantic
analysis — a restriction which is common in text data
mining (Hotho et al., 2005).
4.2 Data Selection
Domain experts should be able to control the scope
of the data analysis. Therefore, optionally they can
select a subset of documents, reflecting their point
of interest. In spatial data mining, it is usual to
utilize relational databases to perform SQL queries
on it. But, since our analysis is based on an
unstructured corpus of documents in natural language
we use information retrieval techniques to select only
relevant documents for this task based on a given
query.
For an efficient representation of a large corpus
of documents, we employ the standard vector space
Figure 4: Terms used in documents correspond to annotated
components of 3D model.
model (Salton et al., 1975), where both the query
q and the documents d ∈ D are transformed into
a vector representation
~
d and ~q respectively. Our
initial index T contains terms used in the document
set D which are also contained in the semantic
annotation of the associated spatial context M, i. e.,
{
T | t ∈ D ∧ t ∈ M
}
. Based on these index terms we
compute weighted word vectors for each document
and the query as described in (Salton et al., 1994): For
each term t a weight w
d
t
is computed that describes its
importance for the description of the document d.
w
d
t
= tf
d
t
· log(N/n
t
), (1)
where N is the size of the document collection D, n
t
is
the number of documents in D that contain term t and
tf
d
t
defines how often the term t occurs in document
d. Based on these weights a vector is defined for
each document:
~
d = (w
d
1
,w
d
2
.. .,w
d
n
) , where n is the
number of terms in T . The similarity of the query
and a document vector is finally computed based on
the inner product of both vectors (commonly called
cosine similarity):
sim(
~
d,~q) =
~
d ·~q
~
|d| ×
~
|q|
=
∑
t∈T
w
d
t
× w
q
t
q
∑
t∈T
(w
d
t
)
2
×
p
∑
t∈T
(w
q
t
)
2
The resulting subset are all documents with a defined
minimum relevance rel
min
:
n
d
result
| sim(
~
d,~q) > rel
min
∧ d ∈ D
o
The subset of documents chosen by this optional
selection step are subsequently considered in the data
analysis steps.
4.3 Data Analysis
The analysis of the documents follows SHNEIDER-
MAN’s Information Seeking Mantra: Overview first,
zoom and filter, then details on demand (Shneider-
man, 1996). In this paradigm domain experts can
GRAPP 2007 - International Conference on Computer Graphics Theory and Applications
140

switch between different perspectives: (i) an overview
about the results of analyzing the selected subset of
documents, (ii) the restriction of the presentation to
selected aspects in order to find correlations, and (iii)
and in-depth inspection of the spatial configuration in
the 3D model.
To decouple the analysis from the visualization
system, we first define a relevance vector
~r which represents the relevance of each
component c of the 3D model M, where
{
~r | c ∈ M ∧ relevance(c) ∈ [0..1]
}
.
Overview. To provide an overview of the subset
of documents onto the 3D model we sum up the
overall term frequencies and normalize them as
follows:
~r
overview
=
∑
d∈D
~
d
|
∑
d∈D
~
d|
.
Zoom and Filter. The underlying data are
analyzed by employing standard data mining methods
in order to find association rules — a common
technique in data mining. There are several different
approaches for rule-finding. In this step a set of
association rules can be selected and inspected while
interacting with the enriched 3D model.
Detail on Demand. Each individual~r found with
the exchangeable standard text mining approach or
determined by spatial mining, can be selected by the
user during the exploration of the 3D model.
4.3.1 Text Mining
Besides the visualization of simple frequency sta-
tistics of names or annotations of model parts that
are mentioned in the text documents, especially
information about frequently co-occuring names or
annotations might provide strong indications about
reasons for system faults that are caused by a com-
bination of faults on specific parts. In order to detect
these frequently occuring names or tags we decided
to use association rule learning methods.
There are several approaches for mining rules in
sets of text documents (transactions). The two best-
known basic algorithms for mining association rules
are Apriori (Agrawal et al., 1993) and Eclat (Zaki
et al., 1997). In our approach we apply the Apriori
implementation of (Borgelt, 2003) for determination
of rules for our text collection~r
text-rule
.
The input for the association rule learner are
lists containing the terms used in each document
d ∈ D (the so-called item sets). The first step of
the association rule learning algorithm determines
frequent itemsets, i.e. it extracts sets of terms (items)
that frequently occur together in the documents.
The required minimal frequency with which the
items must occur together in order to be selected as
’frequent’ is defined by the support value. In a second
step association rules are generated for which a pre-
defined confidence, i.e. the frequency with which the
rules are supported by the documents, holds. Thus,
we finally obtain rules of the form:
t
n
← t
m
[,t
o
,. . .](Confidence x%,Support y%)).
The list of derived association rules is finally pre-
sented to domain experts in an interactive 3D browser
which allows to select relevant rules and adapts
visualization accordingly.
For example, if in fault protocols of machineries
three parts are frequently mentioned together with a
specific fault, the association rule learner will propose
– among other rules – an association rule that depicts
these parts together with the cause (ideally, with the
cause as consequent of the rule). Depending on the
3D browser configuration these three parts might be
automatically highlighted and thus providing visual
information about this detected dependency to the
user.
4.3.2 Spatial Mining
3D models are geometric approximations of objects
in the real world. We assume that we can use those
3D models that have been created in the development
stage of the product’s life cycle. Therefore, the spatial
relations between components in the real product
can be analyzed in these 3D models. Although the
discovery task is done primarily by domain experts
with the enriched 3D model, our approach determines
suggestions of the failure causes based on the asso-
ciation rules found by text mining. The following
steps are applied on all association rules~r
text-rule
and on
the overview vector ~r
overview
. The geometric analysis
emphasizes objects, which are close to the center of
spatial accumulations.
The cholera map mentioned in the introduction
motivates a heuristic to detect unknown error sources
by revealing clusters and agglomerations of spatial
related errors. These potential failure sources might
not be reported in the maintenance documents. Thus,
they might not be discovered purely by text mining
techniques. We use that insight and transfer it to
our approach by determining the weighted centroid
~
cand of the faulty components C. To do so, initially
the bounding box centers
~
b of the components of the
3D model are determined (see Fig. 5). Finally, the
component’s relevance is considered in a weighted
centroid:
~
cand =
1
n
∑
i∈C
r
i
~
b
i
.
3D SPATIAL DATA MINING ON DOCUMENT SETS FOR THE DISCOVERY OF FAILURE CAUSES IN COMPLEX
TECHNICAL DEVICES
141
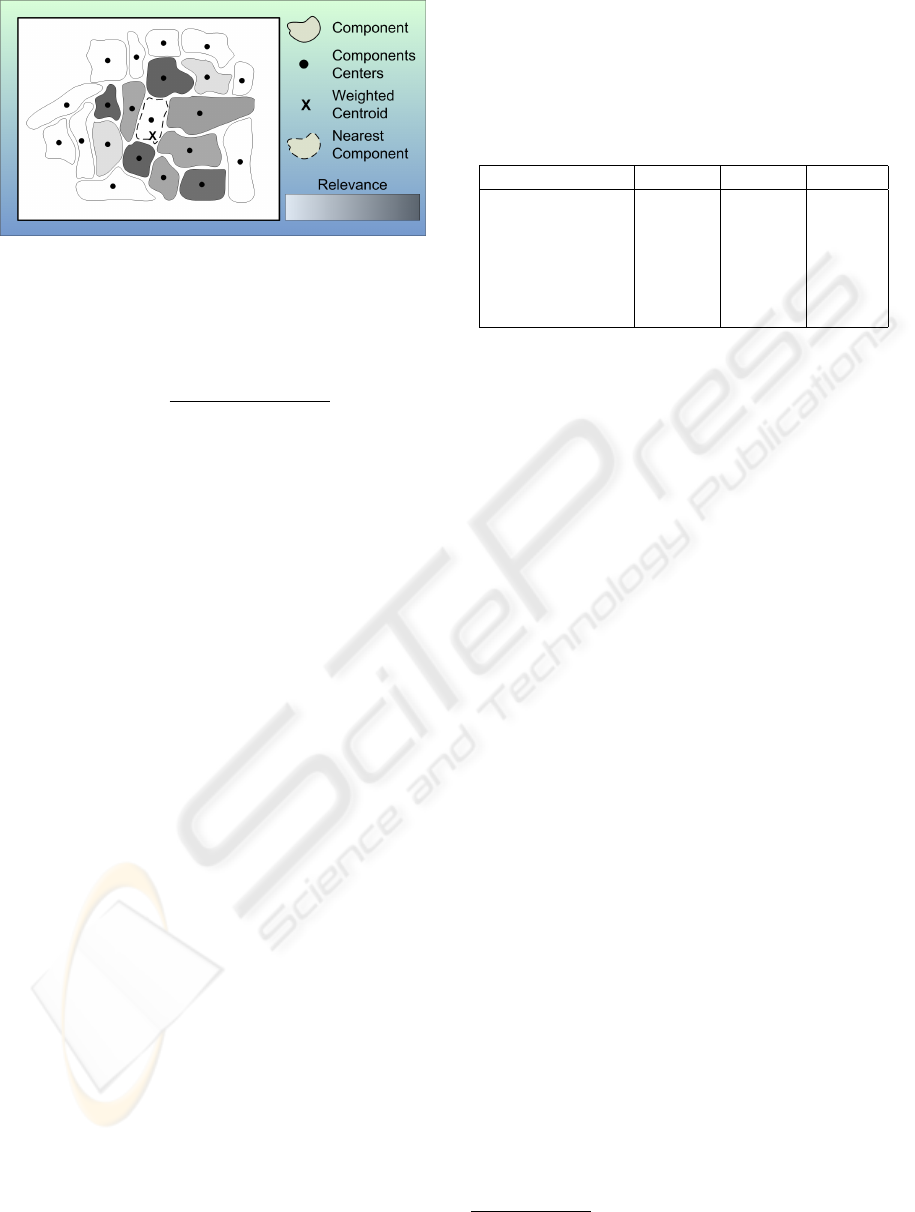
Figure 5: Determining the object nearest to the weighted
centroid.
Next, the component which is nearest to the weighted
centroid is determined:
min
i∈M
q
∑
3
j=1
(cand
j
− b
i, j
)
2
.
Finally, a relevance vector ~r
spatial-rule
is constructed
where the component determined is emphasized.
Of course, this heuristic is only applicable for
models where a spatial neighborhood might be re-
sponsible for a fault. However, in complex machiner-
ies a fault might also be frequently caused by parts
that are spatially far away but technically connected,
e.g., by pipes, wires or transmission systems.
4.4 Data Visualization
There are several constraints for an ideal visualization
of relevance values associated with graphical objects:
First, the most relevant objects should be detected
easily, i. e., they have to be visible and should have
a minimal contrast to the background. Therefore, we
employ attentive or pre-attentive mechanisms to focus
the attention of the viewer onto the most relevant
objects.
Secondly, we should provide indications for the
relevance values for all objects, as (i) an identification
of salient objects relies on the identification of contex-
tual objects, (ii) as the relevance values are based on
heuristics, and (iii) as our visualizations should assist
domain experts in detecting failures due to spatial
configurations. Graphical emphasis techniques must
not alter spatial configurations or shapes of objects.
Thus, graphical abstraction techniques are applied in
an importance driven presentation of the object.
There are a couple of graphical emphasis tech-
niques which can convey the relevance or salience of
geometric components in illustrations (the broad va-
riety of illustration techniques in technical documen-
tations and scientific textbooks already inspired the
research on non-photorealistic rendering (Gooch and
Gooch, 2001; Strothotte and Schlechtweg, 2002)).
We evaluated a number of graphical emphasis tech-
niques with respect to our requirements (see Tab. 1).
Table 1: A qualitative evaluation of graphical emphasis
techniques for 3D models.
Method Config. Shape Visible
Color Attributes original original no
View Adaption original original no
Transparency original original yes
Cutaway altered altered yes
Simplification original altered (yes)
Size altered altered (yes)
The first dimension color attributes comprises
changes applied to material attributes like color,
brightness, saturation, and reflectance. Unfortunately,
this emphasis technique as well as the view adaption
on the model does not ensure, that unimportant
components do not hide important ones. Carefully
adjusted transparency values for irrelevant objects, or
the application of abstraction techniques that alter the
geometry like cutaway views, polygon simplifications
and deformations of the 3D models can commonly
avoid that problem. But as the latter techniques
either alter the spatial configuration or the shape
of geometric entities they are not adequate for our
approach. Thus, modifying the transparency of each
individual component, according the their importance
seems to be optimal.
1
To control the transparency, we
use the relevance vector~r which is determined by text
or spatial mining techniques.
4.5 Data Exploration
The detected association rules are presented to the
user, who explores the enriched 3D model interac-
tively. The user can decide if the model has to be
enriched according ~r
overview
or any ~r
rule
i
. Additionally,
the interactive 3D browser should offer the user to
select several transfer functions H(~r) (e. g., linear,
logarithmic) of the importance value to the compo-
nents’ transparency. For the sake of modularity the
transfer functions have to guarantee that the resulting
values are normalized, e. g.,
H(~r) =
~r, linear
log(10(~r + 1)), logarithmic
... where H(~r) ∈ [0..1].
1
However, (Viola et al., 2004) and (Diepstraten et al.,
2002) more extensively studied transparency techniques.
GRAPP 2007 - International Conference on Computer Graphics Theory and Applications
142
5 RESULTS AND DISCUSSION
We developed an experimental application of the pre-
sented framework, using Coin3D for the interaction
with the enriched 3D model and Qt for the graphical
user interface. For our approach, we generated test
data sets of documents, which contained unequal
portions of the terms used in the assigned 3D models.
In our application the user was able (i) to make a
selection on the data set of documents via defining
an IR query. The resulting subset was (ii) analyzed
by the Apriori (Agrawal et al., 1993) algorithm,
utilizing the user defined parameters #association
terms, minimum support and minimum confidence.
The analysis of ~r
overview
was (iii) visualized in the
corresponding components of the 3D model using the
chosen transfer function. Finally, the user was able to
(iv) interactively explore the enriched 3D model and
select each relevance vector ~r
text−rule
and ~r
spatial −rule
of the previously determined association rules, which
adapted the appearance of the 3D model (see Fig. 6).
As all construction and failure-related data of
commercial products are highly confidential, it is
unlikely to get real data sets (e. g., 3D-models, failure
reports, and service bills) or to get a permission to
publish possible results. But discussions with several
industrial manufactures supported the basic assump-
tion of our approach — that there is a need of visual
data mining techniques for failure-related documents.
Thus, we developed a tool, which generates artificial
test documents sets, containing predefined terms with
user chosen frequencies with an unequal distribution
over the resulting documents, to approximate real
documents. These controlled document sets were
used for the experimental application to evaluate our
user studies.
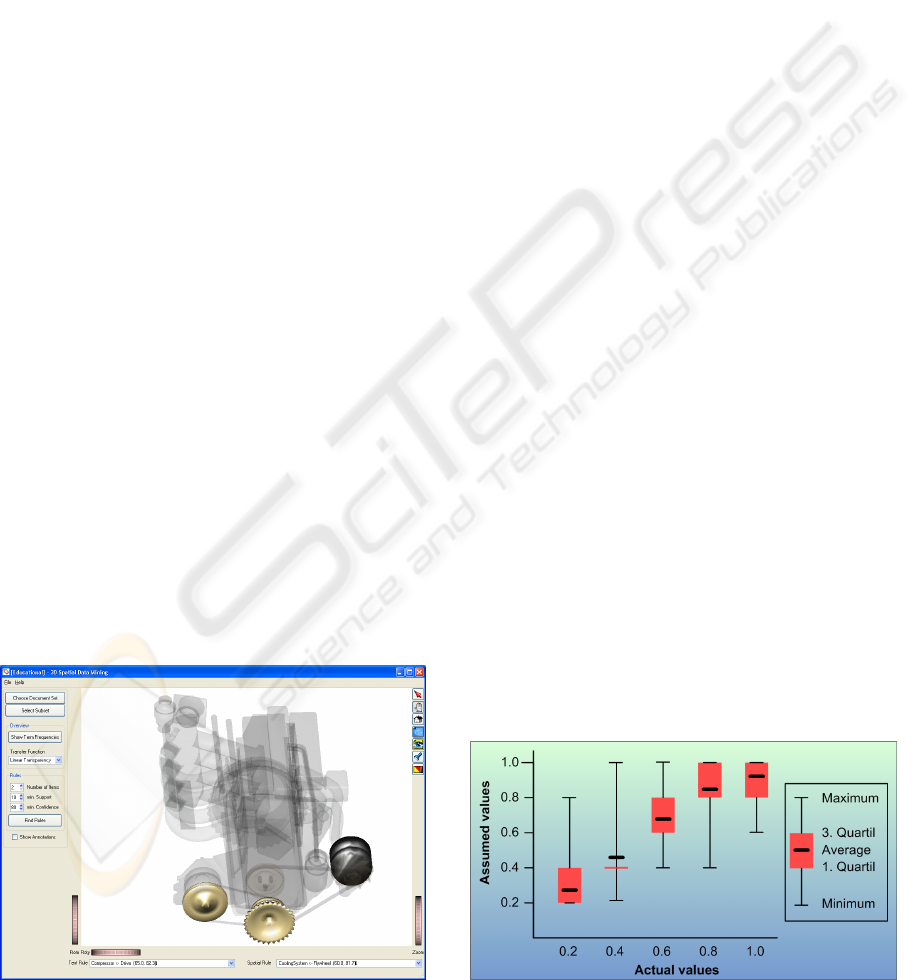
The first test was performed in order to evaluate
Figure 6: Interactive explorer with relevance vectors~r
rule
.
how suitable transparency is to encode object-related
statistical data and how many levels users can identify
while interactively exploring an enriched 3D model.
We used 5 document sets with different term distrib-
utions. The geometric test configuration consisted of
27 spheres, which were spatially arranged to a cube
with the edge length of 3 spheres. The corresponding
terms used in the document sets were ’sphere1’ to
’sphere27’. The documents were analyzed accord-
ing to term frequencies, which were considered as
relevance values; a linear transfer function was used
to map them onto the transparency values of the
corresponding spheres. In the test application were
sliders for each of the spheres on the right side of
the screen. The users had to explore the test object
interactively and assign the individual values for the
transparencies of the spheres onto the corresponding
sliders.
In this test, there were 5 levels of transparency
to distinguish. For each of the test runs the term
frequencies (transparency values) were chosen ran-
domly and written to a file. Accordingly, the user
selected values were logged as well, so that it was
possible to compare the actual and assumed values.
It consisted of 5 test runs, which the 21 participants
had to solve. Student’s t-test significantly showed
(F=374.368, p<0.001) that most of the users correctly
recognized the correct importance of the objects (see
Fig. 7). Although transparency seems to be an
adequate abstraction technique, the statistic reveals
that some users may have difficulties differentiating
some of the values (min/max). In that case, offering
several transfer functions could reduce that problem.
We performed a second test in order to test the
user’s ability to recognize spatial relationships in a
3D context. The test was oriented on the paradigm
of the cholera map. The users were given a set of
27 spheres, which were arranged in the same fashion
like in the first test. A certain number of these spheres
were opaque, while the remaining spheres were 90%
Figure 7: Results of first user test on transparency.
3D SPATIAL DATA MINING ON DOCUMENT SETS FOR THE DISCOVERY OF FAILURE CAUSES IN COMPLEX
TECHNICAL DEVICES
143
transparent. The users were asked to find out, which
of the transparent spheres was spatially most related
with all of the opaque ones.
Table 2: Times for solving tests.
Group 1 2 3 4
A 31.7s 25.5s 8.9s 11.7s
B 50.0s 48.0s 16.1s 73.7s
Both the fault rate and the time used were
measured. Additionally, we distinguished between
participants with experience (Group A: 15 persons)
in 3D applications and those without (Group B:
6 persons). Most of the users solved the 4 test
runs correctly (∼95%), but there were significant
(F=11.916, p<0.001) time differences between group
A and B (see Tab. 2). Since the target group of this
approach are construction engineers, this should not
be a problem.
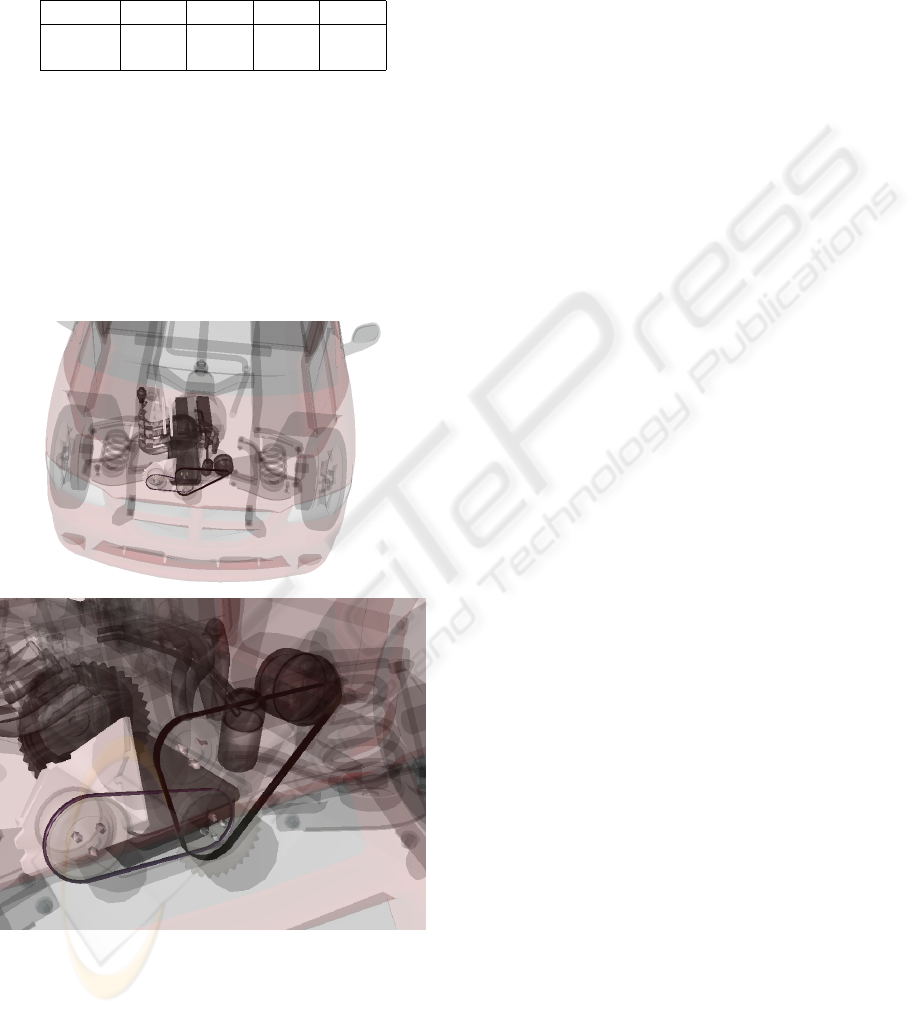
Figure 8: Exploring faults projected onto a car model.
6 CONCLUSION
This paper introduced (i) a novel approach which
maps analysis results from document sets on corre-
spondingly annotated 3D models. We (ii) suggested
a framework, which separates the analysis and visu-
alization to be flexible enough to be interchangeable
with other analysis methods. We (iii) developed an
experimental application of this approach, generated
test data sets, and (iv) applied a user study, to evaluate
our approach and the methods used (see Fig. 8).
The most challenging problem of our — and of
all other approaches based on text analysis — is to
cope with the ambiguity of natural language and the
huge amount of domain specific and common-sense
knowledge required to analyze texts. Maintenance
documents normally contain only the correct desig-
nations of components, hence if the 3D model is
annotated correspondingly, there will be no problem
to establish the links between the terms contained
in documents an the geometric components of the
3D model. But HARTMANN’s text illustration system
(Hartmann et al., 2002; Hartmann and Strothotte,
2002) has shown, that even shallow morphological,
syntactical, and semantical analysis can improve the
robustness of the text analysis. Further on, thesauri
and word taxonomies (e. g., WordNet (Fellbaum,
1998)) could be used to get more general results.
Additional meta-data can be exploited to analyze
temporal changes. Bills and service reports com-
monly include dates and product numbers. This
information has to be extracted by specialized pars-
ing algorithms and should be associated with the
document vector. Chronological ordered data sets
would be able to reveal temporal association rules. In
combination with additional geometric information,
especially the connectivity between the individual
components, the propagation of faults can be traced
(e. g., one component perishes and the neighboring
components are negatively affected by it).
Another challenge is the validation of simulation
data with failure reports extracted from many prod-
ucts over a long period of time and the application of
our approach to other geometric representations (e. g.,
voxel models) and domains.
(i) Our visual data mining pipeline is designed in
a modular fashion and we plan to integrate a volume
renderer as a visualization component. By comparing
FEM simulations from the design phase with the
retrospectively enriched voxel models, a target/actual
comparison with approach could help to adjust the
parameters for future FEM studies.
(ii) Another interesting application domain is
medicine and pharmacy, where unique (Latin) terms
are used as denotations of for all domain entities
(organs, muscles, and bones). There also exist
polygonal (e. g., viewpoint catalog) and voxel models
(e. g., visible human data set) which approximate the
human body with its single parts and are annotated
GRAPP 2007 - International Conference on Computer Graphics Theory and Applications
144

with their denotation. As these terms are almost
unambiguous, data mining techniques can be applied
on medical or pathological findings (e. g., (McDonald
et al., 1998; Moore and Berman, 2000)) to ground
spatial related correlations between the records in
the database. As an example, it could be revealed
that an artificial bone often negatively affected other
organs, muscles or bones; or e. g., if there is a
spatial relation between 2 organs, which often suffer
damages together.
REFERENCES
Agrawal, R., Imielienski, T., and Swami, A. (1993). Mining
Association Rules between Sets of Items in Large
Databases. In Conf. on Management of Data, pages
207–216.
Bernhardsen, T. (2002). Geographic Information Systems.
John Wiley and Sons.
Berthold, M. R. and Hand, D. J., editors (2003). Intelligent
Data Analysis, An Introduction. Springer, 2nd edition.
Borgelt, C. (2003). Efficient Implementations of Apriori
and Eclat. In 1st WS of Frequent Item Set Mining
Implementations (FIMI).
Diepstraten, J., Weiskopf, D., and Ertl, T. (2002). Trans-
parency in interactive technical illustrations.
Ester, M., Frommelt, A., Kriegel, H.-P., and Sander, J.
(2000). Spatial Data Mining: Database Primitives,
Algorithms and Efficient DBMS Support. Data
Mining Knowledge Discovery, 4(2/3):193–216.
Fellbaum, C., editor (1998). WordNet: An Electronic
Lexical Database. MIT Press, Cambridge, MA.
Flavin, P. G. and Totton, K. A. (1996 ). Computer
Aided Decision Support in Telecommunications. BT
Telecomm. Series. Chapman Hall Publishers, London.
Frawley, W. J., Piatetsky-Shapiro, G., and Matheus, C. J.
(1992). Knowledge Discovery in Databases: An
Overview. AI Magazine, 13(3):57–70.
Gooch, B. and Gooch, A. (2001). Non-Photorealistic
Rendering. A. K. Pteres, Natick.
Hand, D., Mannila, H., and Smyth, P. (2001). Principles of
Data Mining. MIT Press, Cambridge.
Hartmann, K., Schlechtweg, S., Helbing, R., and Strothotte,
T. (2002). Knowledge-Supported Graphical Illustra-
tion of Texts. In Int. Working Conf. on Advanced
Visual Interfaces, pages 300–307.
Hartmann, K. and Strothotte, T. (2002). A Spreading
Activation Approach to Text Illustration. In 2nd Int.
Symp. on Smart Graphics, pages 39–46.
Hipp, J., Güntzer, U., and Nakhaeizadeh, G. (2002). Data
Mining of Association Rules and the Process of
Knowledge Discovery in Databases. In Industrial
Conference on Data Mining, pages 15–36.
Hotho, A., Nürnberger, A., and Paaß, G. (2005). A Brief
Survey of Text Mining. GLDV-Journal for Comp.
Linguistics and Language Technology, 20(1):19–62.
Keim, D. A. (2002). Information Visualization and Visual
Data Mining. IEEE Transactions on Visualization and
Compututer Graphics, 7(1):100–107.
McDonald, J. M., Brossette, S., and Moser, S. A.
(1998). Pathology Information Systems: Data Mining
Leads to Knowledge Discovery. Archives of Pathol-
ogy & Laboratory Medicine in Health & Fitness,
122(5):409–411.
Miller, H. J. and Han, J., editors (2001). Geographic Data
Mining and Knowledge Discovery. Taylor & Francis,
London.
Moore, G. W. and Berman, J. J. (2000). Anatomic
Pathology Data Mining. In Cios, K. J., editor, Medical
Data Mining and Knowledge Discovery, pages 61–
107. Springer Verlag, Berlin.
Orfor, S., Dorling, D., and Harris, R. (1997). Review of
Visualization in the Social Sciences: A State of the
Art Survey and Report. Technical report, School of
Geographical Sciences, University of Bristol, UK.
Salton, G., Allan, J., Buckley, C., and Singhal, A.
(1994). Automatic Analysis, Theme Generation, and
Summarization of Machine-Readable Texts. Science,
264:1421–1426.
Salton, G., Wong, A., and Yang, C. S. (1975). A Vector
Space Model for Automatic Indexing. Communica-
tions of the ACM, 18(11):613–620.
Schmidt, V. S. (1998). Turning Telecommunication Data
into Accessible Information with SDE and Data
Visualization Tools. In ESRI Europ. User Group Conf.
Shneiderman, B. (1996). The Eyes Have It: A Task by
Data Type Taxonomy for Information Visualization.
In IEEE Symp. on Visual Languages, pages 336–343.
Strothotte, T. and Schlechtweg, S. (2002). Non-
Photorealistic Computer Graphics: Modeling, Ren-
dering, and Animation. Morgan Kaufman, Los Altos.
Tan, P.-N., Steinbach, M., and Kumar, V. (2005). Introduc-
tion to Data Mining. Addison-Wesley.
Tufte, E. R. (1997). Visual Explanations: Images and
Quantitatives, Evidence and Narrative. Graphics
Press, Cheshire, Connecticut.
Viola, I., Kanitsar, A., and Gröller, M. E. (2004).
Importance-driven volume rendering. In Proceedings
of IEEE Visualization’04, pages 139–145.
Witten, I. H. and Frank, E. (1999). Data Mining: Practical
Machine Learning Tools and Techniques with Java
Implementations. Morgan Kaufmann.
Zaki, M., Parthasarathy, S., Ogihara, M., and Li, W. (1997).
New Algorithms for Fast Discovery of Association
Rules. In 3rd Int. Conf. on Knowledge Discovery and
Data Mining (KDD), pages 283–296.
Zienkiewicz, O. C. and Taylor, R. L. (2000). The
Finite Element Method. Vol 2: Solid Mechanics.
Butterworth-Heinemann, Oxford, 5th edition.
3D SPATIAL DATA MINING ON DOCUMENT SETS FOR THE DISCOVERY OF FAILURE CAUSES IN COMPLEX
TECHNICAL DEVICES
145
