
EFFICIENT EVALUATION OF THE INFLUENCE OF ELECTRIC
PULSE CHARACTERISTICS ON THE DYNAMICS OF CELL
TRANS-MEMBRANE VOLTAGE
N. Citro, L. Egiziano, P. Lamberti and V. Tucci
Dept. of Electrical and Information Engineering, University of Salerno, Via ponte don Melillo, Fisciano (SA), Italy
Keywords: Electroporation, Trans-Membrane Voltage, Design Of Experiments, Response Surface Method, Hodgkin-
Huxley model.
Abstract: This paper aims at presenting a systematic approach for evaluating the effects induced on the dynamics of
the Trans-Membrane Voltage of a biological cell by the characteristics of the non-ideal (trapezoidal) applied
electric pulses. The proposed methodology is based on a combined use of the Design of Experiments (DoE)
and Response Surface Methodology that allows to put in evidence the self and mutual effects produced by
the characteristic parameters of the pulse (slew rate, the total duration of the impulse and its amplitude) on
the time evolution of the Trans-Membrane Voltage (TMV). In particular, the effects on the max
instantaneous value of the TMV are analysed: its qualitative behaviour vs. the considered parameters, the
combination of parameters leading to the highest amplitude and the most influencing parameter are
identified with an efficient search based on an optimal set of numerical trials. The analysis concerning the
dependence of the max value of TMV on the pulse parameters is performed by considering either a basic
Hodgkin-Huxley (HH) circuit or a modified one taking also into account the electroporation phenomenon.
1 INTRODUCTION
An externally applied electrical field pulse
determines fast structural modifications of the
plasma membrane of biological cells. This
phenomenon, known as electro-permeabilization or
electroporation has been proposed as an efficient
tool to interact with biological materials in several
applications. An irreversible electroporation has
been used in biology for the decontamination of
water and in food processing for the nonthermal
killing of harmful microorganisms (Joshi et al.,
2004). On the other side, a transient membrane
permeabilization has been proposed in medicine for
gene therapy, cancer chemotherapy, drug delivery,
etc. (Sukharev, et al., 1992, Weaver 2000). In fact,
the application of a pulsed electric field has been
shown to improve the uptake of drug with respect to
conventional methods (Hofmann, et al. 1999). The
most remarkable phenomena associated to
electroporation are linked to the formation of pores
in the lipid bilayer membrane and the growth of their
dimensions. The opening of these gateways allows
the transport of ions and water-soluble species
through the membrane (Beebe et al., 2001, Neumann
et al., 1989).
In order to study how the characteristics of the
externally applied electric field pulses influence the
cell dynamics, either field or circuit-based models
approaches have been used (Miller and Henriquez,
1988, Heida et al., 2002). The field-based models,
although allowing very detailed determinations of
the relevant quantities, require great efforts in
modelling the different cellular subsystem and in
performing the computations by suitable numerical
schemes (FEM, BEM, etc.) in time domain. The
circuit-based models are less accurate but more
flexible and easy to manage. Moreover, a straight
association of the electrical quantities to the
biological transport phenomena can be achieved.
The lumped parameters circuits employed to
represent a small patch of the biological cell can be
derived from the so called Hodgkin-Huxley (HH)
model after their seminal work concerning the
conduction and excitation of nerve membranes
(Hodgkin and Huxley, 1952). In this model the
membrane is represented by a capacitance, the ionic
channels as linear or nonlinear conductances and the
voltage generators are linked to the so called Nernst
140
Citro N., Egiziano L., Lamberti P. and Tucci V. (2008).
EFFICIENT EVALUATION OF THE INFLUENCE OF ELECTRIC PULSE CHARACTERISTICS ON THE DYNAMICS OF CELL TRANS-MEMBRANE
VOLTAGE.
In Proceedings of the First International Conference on Biomedical Electronics and Devices, pages 140-145
DOI: 10.5220/0001046201400145
Copyright
c
SciTePress
equilibrium potential, determined by the ratio of the
specific ionic concentrations inside and outside the
cell. An improved model, where a voltage controlled
current generator takes into account the
electroporation phenomenon, has been recently
proposed (Citro and Tucci, 2006).
The circuit approach is adopted in a large
number of papers in order to perform an easy and
efficient analysis of the modifications of the cell
response to either the variations of the circuit
parameters (Citro et al, 2005), or those associated to
the input voltage and current characteristics (Bilska,
DeBruin, Krassowska, 2000). However, in most
cases the identification of the parameters ranges, in
which the variability of the response is studied,
seems to be carried out with rather naïve criteria.
For this reason, in this paper a systematic
approach based on the Design of Experiments (DoE)
and Response Surface Methodology (RSM) is used
in order to evaluate the most influencing parameters
on the dynamics of Trans-Membrane Voltage
(TMV) of a cell subjected to a non ideal pulse field
modelled by means of a trapezoidal voltage pulse
v(t). The slew rate (dv/dt), the total duration of the
impulse t
hold
and its amplitude V
max
are considered as
factors of influence. In particular, the effects induced
on the maximum value of TMV are studied. The
combination of parameters which determines the
highest amplitude of TMV and the most influencing
parameter (i.e. the max value of the applied pulse)
are identified by a suitable choice of tests. The
adopted approach, whose efficiency relies in the
limited number of proper numerical trials needed,
allows also to put in evidence the qualitative
behaviour of the TMV vs. the considered
parameters. A HH circuit, in which the
electroporation phenomenon may be taken into
account by a voltage controlled current generator, is
considered. The obtained results concerning the
TMV dynamics favourably compare with those
obtained by other researchers (DeBruin and
Krassowska, 1999, Kotnik and Miklavcic, 2006,
Vasilkoski et al., 2006). After a brief description of
the adopted circuit model in Sect. 2, the application
of the DoE is presented in Sect.3. In Sect. 4 the
results obtained by RSM are discussed and in Sect. 5
the main conclusions are drawn.
2 CIRCUIT MODEL
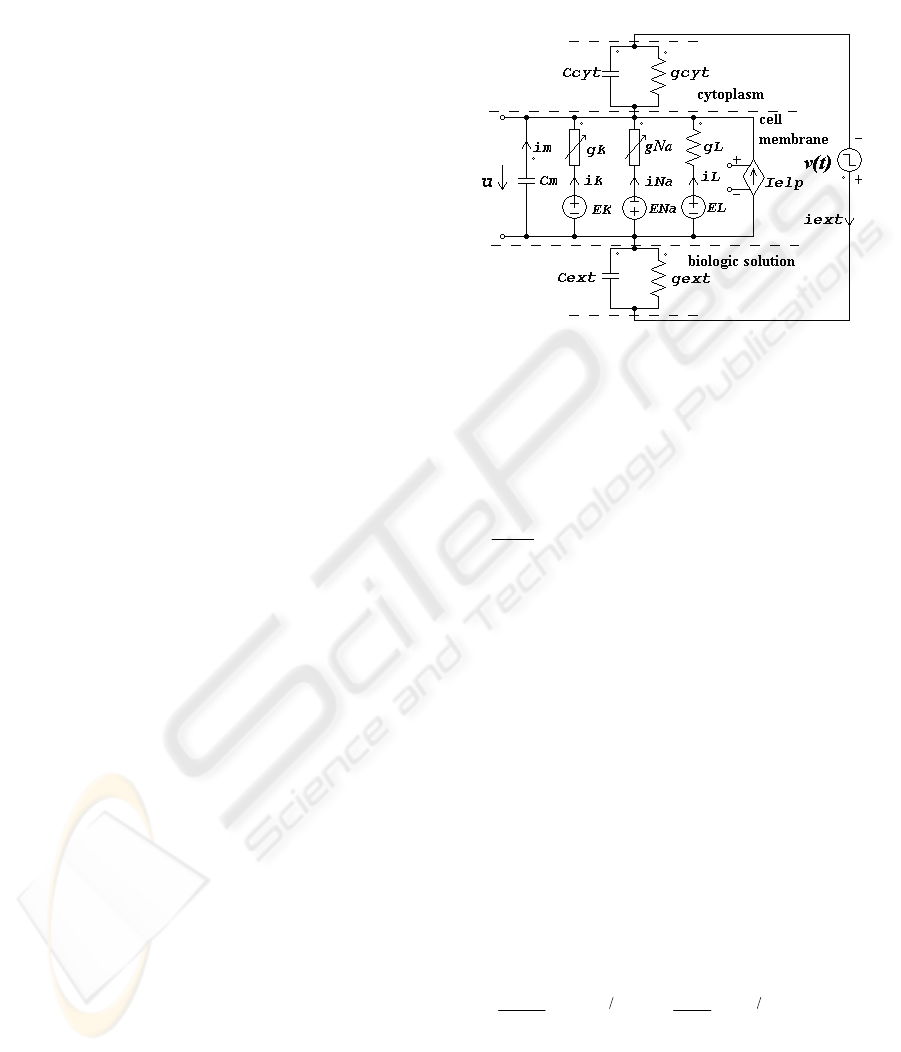
The analysis is carried out for the modified HH
circuit shown in Figure 1 which mimics the
behaviour of a cell membrane patch subjected to a
trapezoidal voltage pulse. The circuit takes also into
account the behaviour of the biologic solution
outside the cell (the parallel C
ext
-g
ext
) and the internal
cytoplasm (the parallel C
cyt
-g
cyt
).
Figure 1: Modified HH circuit.
The details of the model are discussed in (Citro and
Tucci, 2006). Here we just summarise the main
aspects. The Kirchhoff current law applied to the
circuit of Figure 1 gives:
(
)
() () () () ()
[
]
titititIti
d
t
tdu
C
NaKLelpextm
+++−=
(1)
In fact the total ionic current is given by four
contributions. The first three contributions (leaking
channel current i
L
, sodium channel current i
Na
,
potassium channel current i
K
) are the same of the
basic HH circuit and therefore g
L
is a constant value
whereas g
Na
and g
K
are non linear time dependent
conductances such that
hmgg
NaNa
⋅⋅=
3
max,
and
4
max,
ngg
KK
⋅=
where m, n and h are nonlinear
variables describing the activation or inactivation of
the channels and given by a first order non linear
differential equation (Hodgkin and Huxley, 1952).
The fourth is the electroporation current, given by a
voltage controlled current source I
elp
=N
⋅
i
elp
where i
elp
is the current through a single pore and N is the pore
density governed by the Smoluchowsky-equation:
(
)
()
()
()
()
()
⎟
⎟
⎠
⎞
⎜
⎜
⎝
⎛
−=
−
22
0
1
epep
VtuqVtu
e
N
tN
e
dt
tdN
α
(2)
where u(t) is the Trans-Membrane Voltage (TMV),
N
0
is the pore density for u(t)=0 and
α
, V
ep
and q are
suitable constants (DeBruin and Krassowska, 1999).
By using the characteristic equation of the
EFFICIENT EVALUATION OF THE INFLUENCE OF ELECTRIC PULSE CHARACTERISTICS ON THE
DYNAMICS OF CELL TRANS-MEMBRANE VOLTAGE
141

membrane capacitance it results that the dynamic
evolution of the TMV and the different ionic
currents can be determined by evaluating at each
time step a non linear differential equation system in
5 unknowns u, m, n, h, N:
()()()()()
[]
T
tNtuhtuntumtu ,,,,,,,=Y
()()
⎪
⎩
⎪
⎨
⎧
=
==
=
0
0
,,,,,,
YY
Yff
Y
t
tNuhnmt
dt
d
(3)
In Table 1 the values adopted for the different
quantities appearing in (1)-(3) are reported.
Table 1: Values of the parameters adopted in the model.
g
L
g
Na,max
g
K,max
g
cyt
g
ext
0.3
mS/c
m
2
120
mS/cm
2
36
mS/cm
2
24
S/cm
2
24
S/cm
2
u
0
E
L
E
Na
E
K
V
ep
0
mV
49.39
mV
55
mV
72
mV
258
mV
C
cyt
=
C
ext
C
m
N
0
q
α
14.16
6
nF/cm
2
1
μF/cm
2
1.5·10
5
1/cm
2
2.46
100
cm
-2
ms
-1
The numerical system (3) has been solved by
using the commercial software FlexPDE.
3 DOE METHOD FOR THE BEST
SET OF PARAMETERS
Design of Experiments (DoE) is a well known
technique adopted in experimental or numerical
campaigns. It allows the minimisation of the number
of tests intended for the identification of the most
relevant factors affecting the behaviour of a system.
DoE methods allow to ascertain the relative
importance of the different parameters and get
indications on their interactions. In our case the
characteristics of the trapezoidal electric pulse
depicted in Figure 2 applied to the HH circuit
represent the degrees of freedom considered in our
application of DoE. The values of the parameters are
chosen in suitable ranges reported in Table 2
according to those suggested in other works (Joshi et
al., 2004, Kotnik and Miklavcic, 2006).
V
max
v(t)
t
hold
t
dv/dt
V
max
v(t)
t
hold
t
dv/dt
F
igure 2: Shape and relevant parameters of the applied
electrical pulse.
In order to have an effective but not too heavy
scan of the possible range of the parameters space,
we choose 9 distinct levels for the slew rate, and 3
for both t
hold
and V
max
.
Table 2: Parameters considered for the DoE and their
levels.
Paramete
r
encoding
Number of
levels
range
values
dv/dt
[V/ns]
X1 9 [0.25,34.30]
t
hold
[ns]
X2 3
[11.0;280.0
]
V
max
[V] X3 3 [10.0; 60.0]
The total number of experiments for a full factorial
design would be 9*3*3=81 points in the parameters
space, i.e. the compact D defined as
[
]
[
]
3
maxminmaxmin
3,31,1 ℜ⊂××= XXXXD " . Each
experiment is a vector X
=(X1,X2,X3)∈D. However,
since some combinations of parameters are
unfeasible (as for example, when t
hold
is lower than
the sum of rise and fall time), the design matrix
results in a reduced set of experiments which in our
case is equal to 57. As a response Y, we consider the
maximum value of the TMV with (Y
elp
) or without
electroporation (Y
nelp
):
(
)
XtuY
t
,max
=
(4)
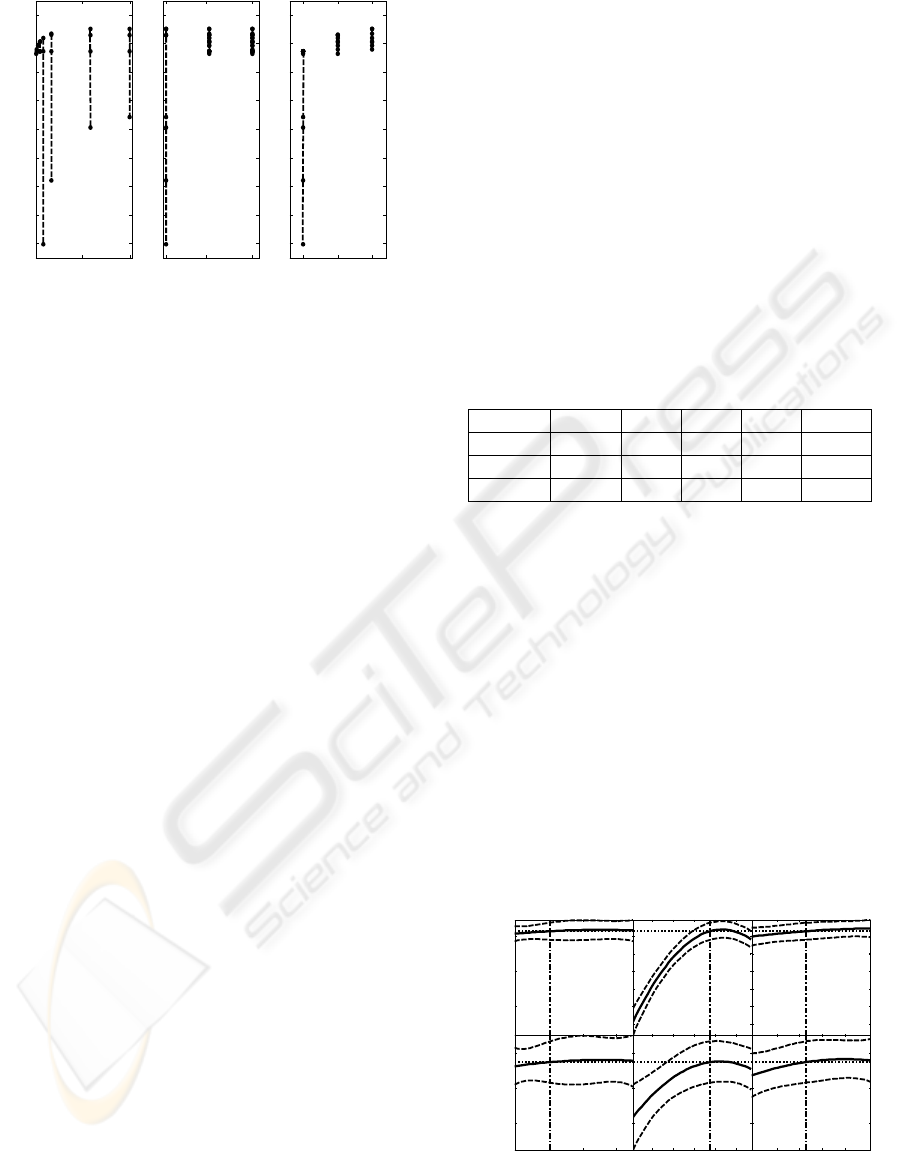
The design of experiments plot (dex scatter plot)
(NIST/SEMATECH, 2006), also known as main
effects plot, reported in Figure 3 allows to put in
evidence the most influencing factors and the best
choice for the setting parameters. In this Figure the
values of the response Y
elp
are reported in
correspondence of a fixed level of a given
parameter, whereas the other two are varied from the
min (-) to the max (+) value of the corresponding
range.
BIODEVICES 2008 - International Conference on Biomedical Electronics and Devices
142
- mid +
0.9
1
1.1
1.2
1.3
1.4
1.5
1.6
1.7
X1
Y
elp
[V]
- mid +
0.9
1
1.1
1.2
1.3
1.4
1.5
1.6
1.7
X2
- mid +
0.9
1
1.1
1.2
1.3
1.4
1.5
1.6
1.7
X3
Figure 3: Three factors - dex scatter plot of Y
elp
.
In a dex scatter plot a factor can be considered as
principal one if, when scanning its variability range
from the min to the max value, it produces a
significant change in the response. By analyzing the
Figure 3 we can observe that X3 appears to be a
principal factor. In fact, we have a great excursion in
the response for the min of X3 whereas the
responses are concentrated in a small interval for
both the mid point value and for the max of X3.
Furthermore, the values of the response increase as
X3 increases. Also for X2 an effect similar to X3 in
terms of excursion in the responses is evident: a
great excursion for the min of X2, whereas the
responses are concentrated in a small interval for its
midpoint and max level. Indeed, the ranges of Y
elp
when X2 is fixed at its second or third level are
nested, with the third including the second: this
implies a lower dependence of the response with
respect to that due to X3 and a second order
dependence. Instead the amplitude of the response
due to changes in the X1 levels does not exhibit
sensible variations. A low shift in the maximum
value corresponds to a limited first order influence
of this factor. Moreover, the factors combination
allowing the max value in the response is achieved
when X1=max, X2=midpoint, X3=max, as
evidenced in the following paragraph.
4 APPLICATION OF THE
RESPONSE SURFACE
METHOD
The Response Surface Method (RSM) allows to get
quantitative information on the dependence of the
response on the considered factors. In order to
perform such an analysis, the results of the
numerical simulations are interpolated on a response
surface. In particular, the response surface can be
obtained by considering a second order model
representing an hyper-surface in a 4-dimensional
space:
ji
k
iji
iji
k
i
i
xxxy
∑∑
≤==
++=
,11
0
βββ
(5)
where y is the desired response (i.e. the maximum
value of the simulated TMV), k is the number of the
parameters, x
i
(i=1,.., k) represents the i-th factor,
β
i
and
β
ij
, (i,j=1,.., k) denote the effect of i-th factor
and the mutual interaction of i-th and j-th factor
respectively. By using the previous 57 combinations
of the parameter levels we obtain the RSM
coefficients, summarized in Table 3 .
Table 3: RSM coefficients at a confidence level of 99%.
Factor 1 X1 X2 X3 X1
2
effect 969.820 13.122 4.374 8.890 -0.155
Factor X2
2
X3
2
X1⋅X2 X1⋅X3 X2⋅X3
effect -0.008 -0.054 -0.035 0.032 -0.019
In order to graphically show the correlation among
the response and the factors, we use the MATLAB
®
function RSTool which allow to interactively plot
the response (either in presence or in absence of
electroporation) as a function of one parameter at a
time while letting the remaining two fixed. In Figure
4 we compare the responses with (Y
elp
) and without
(Y
nelp
) the electroporation generator in the circuit of
Figure 1.
The results in Figure 4 show that there is a linear
dependence of the TMV maximum with respect to
X1 and X3, whereas it is of quadratic type for X2.
These behaviours are evident for the responses
obtained either in absence of the electroporation
phenomenon (Y
nelp
in the upper part of Figure 4) or
in presence of it (Y
elp
in the lower part of Figure 4).
10 20 30
1000
1500
2000
X
1
=dV
input
/dt [V/ns]
Y
elp
[mV]
2000
4000
6000
Y
nelp
[mV]
50 100 150 200 250
X
2
=t
hold
[ns]
20 30 40 50
X
3
=V
max
input
[V]
Figure 4: Behaviour of the responses as a function of one
parameter at a time while the remaining two are fixed.
EFFICIENT EVALUATION OF THE INFLUENCE OF ELECTRIC PULSE CHARACTERISTICS ON THE
DYNAMICS OF CELL TRANS-MEMBRANE VOLTAGE
143
Moreover, since the shapes of the curves remain the
same in these two cases, it is possible to state that
the behaviour is not influenced by the
electroporation phenomenon, but it is mainly
dictated by the non-linear conductances of the ionic
channels, i.e. the common part of the circuit. By
looking at the values of the response, it is evident
that, according to similar results obtained by other
research groups (DeBruin and Krassowska, 1999),
the maximum of the TMV is three times greater in
the basic HH model than that obtained when
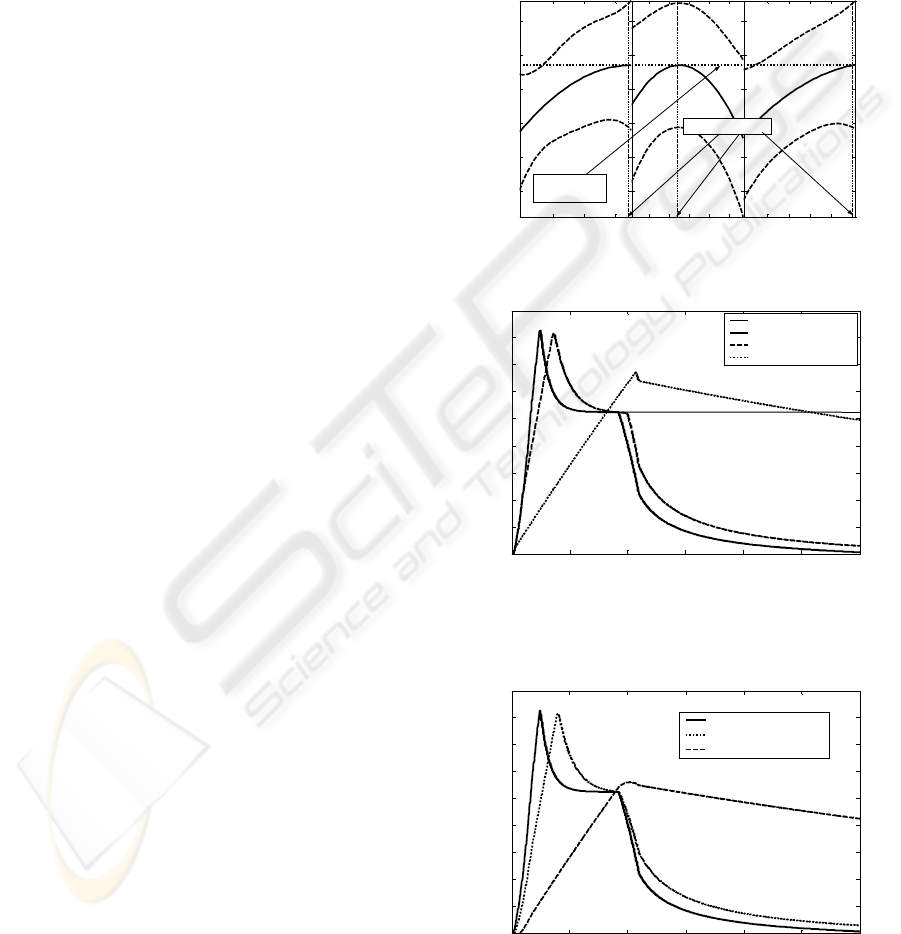
electroporation is taken into account. In Figure 5 the
resultant maximum of the responses Y
elp
is depicted,
where we have set X1=34.3V/ns, X2=120.7ns
X3=60V corresponding to the Best Parameters Set
(BPS=(X1
*
,X2
*
,X3
*
)), as previously obtained by the
DoE approach. Such a combination gives
Y
elp
=1.77V. As found also by using DoE, the most
influencing factors are X3 and X2 because they give
rise to the greater variation of the response.
The effectiveness of the BPS identification
procedure based on RSM is checked by evaluating
the real TMV peak value in correspondence of the
BPS from the circuital model described by the
equation system (3). Firstly we note that the time
evolutions depicted in Figures 6-7 are characterised
by a change of the shape similar to that found by
other researchers (Vasilkoski et al., 2006) for similar
values of t
hold
and dv/dt. The plots depicted in Figure
6 show the time evolutions of TMV for the BPS
(thin continuous line) and for other combinations of
the parameters. In particular, the other three curves
are obtained for X1=X1
*
, X2 set to its min value and
three different values of X3 (including X3
*
). We
obtain for the BPS the highest actual peak value of
TMV equal to 1.65V. Such a value exhibits a small
discrepancy of about 7% to the value (1.77V)
obtained by means of the RSM. Better accordance
may eventually be achieved by adopting a
polynomial Response Surface of higher order. We
also note that the two solid curves corresponding
respectively to BPS (thin line) and that obtained for
(X1
*
,X2
min
,X3
*
) (thick line) overlap in the first part
and are characterised by the same peak value, since
the applied stress during the rising front, i.e. the
main cause influencing the peak, coincides.
Moreover, a decrease of X3 determines a sensible
decrease in the peak value of TMV.
The effects induced in the response by varying
X1 and X3 and keeping constant the pulse duration
t
hold
to its min value (X2
min
=11ns) can be appreciated
by comparing the plots of Figure 6 and 7. In
particular, we observe that the same reduction of
V
max
(from X3=60V to X3=35V) associated to a
reduction of the slew rate (from X1=34.3V/ns to
X1=19.9V/ns) does not lead to appreciable
differences in the peak value of the TMV, as shown
by the two leftmost curves of Figures 6 and 7. On
the other side, a reduction in the slew rate
(X1=5.7V/ns in Figure 7) for the lowest level of
V
max
(X3=10V) induces a significant change in
either the peak value or the shape of the TMV
dynamics.
10 20 30
1400
1500
1600
1700
1800
1900
50 100 150 200 250 20 30 40 50
Y
elp
max
=1.77V
X1 [V/ns]
X2 [ns]
X3 [V]
Y
elp
[mV]
BPS =(X1
*
,X2
*
,X3
*
)
Figure 5: Identification of the BPS for the response Y
elp
.
0 0.5 1 1.5 2 2.5 3
x 10
-8
0
0.2
0.4
0.6
0.8
1
1.2
1.4
1.6
1.8
time [s]
TMV [V]
BPS
(34.3V/ns,11ns,60V)
(34.3V/ns,11ns,35V)
(34.3V/ns,11ns,10V)
Figure 6: Time evolutions of TMV. BPS=(34.3V/ns,
120.7ns, 60V). The parameters values corresponding to
the other curves are reported in the insert.
0 0.5 1 1.5 2 2.5 3
x 10
-8
0
0.2
0.4
0.6
0.8
1
1.2
1.4
1.6
1.8
time [s]
TMV [V]
(34.3V/ns,11ns,60V)
(19.9V/ns,11ns,35V)
(5.7V/ns,11ns,10V)
Figure 7: Time evolutions of TMV. The parameters values
corresponding to the curves are reported in the insert.
BIODEVICES 2008 - International Conference on Biomedical Electronics and Devices
144

5 CONCLUSIONS
A systematic approach based on the combined use of
Design of Experiments and Response Surface
Methodology has been applied for evaluating the
effects induced on the dynamics of the Trans-
Membrane Voltage of a biological cell by the
characteristics of the applied electric pulses. The
proposed methodology is applied to a lumped
parameter circuit, subjected to a trapezoidal pulse.
The combined use of DoE and RSM allows to
reliably identify the parameters set leading to the
highest peak value of the TMV. The parameters
which show the greatest influence are the max value
of the applied pulse and the slew rate whereas the
response is almost insensitive to the pulse duration.
The proposed approach can be easily extended in
order to study the effects of the pulse characteristics
on the response of more complex circuit models
taking into account also the internal cell structures
(nucleus, organelles, etc), such as those describing
the cell behaviour to ultrashort, high-intensity pulses
for intracellular manipulation.
ACKNOWLEDGEMENTS
This work has been carried out with the financial
support of ex MURST 60% funds of the University
of Salerno.
REFERENCES
Beebe S.J.,. Buescher E.S, Schoenbach K.H.,
“Intracellular effect of ultrashort electrical pulses,”
Bioelectromagnetics, vol. 22, pp.440–448, 2001.
Bilska, A.O., DeBruin, K.A., Krassowska W. 2000,
Theoretical modelling of the effects of shock duration,
frequency and strength on the degree of
electroporation, Bioelectrochemistry, 51, 2000, 133-143.
Citro, N., Tucci, V. 2006. A detailed analysis of the
electrical dynamics of the Hogkin-Huxley cellular
model including electroporation. Proc. of the 4th Int.
Workshop on Biological Effects of Electromagnetic
Fields. ISBN/ISSN: 960-233-173-9, Vol. 2: 853-860.
Citro, N., De Vivo, B., Spagnuolo, G., Tucci, V. (2005),
“Range Analysis of Biological Cells Subjected to
Pulsed Electric Fields”, Conf. on Electrical Insulation
and Dielectric Phenomena, 10.1109/
CEIDP.2005.1560732, pp. 511-514.
DeBruin, K.A., Krassowska W., 1999. Modelling
Electroporation in a Single Cell. I. Effects of Field
Strength and Rest Potential. Biophysical Journal. 77:
1213-1224.
Heida, T., Wagenaar, J. B. M., Rutten, W. L. C., Marani,
E. 2002. Investigating Membrane Breakdown of
Neuronal Cells Exposed to Nonuniform Electric Fields
by Finite-Element. Modeling and Experiments. IEEE
Trans. On Biomedical Engineering. 49-10:1195-1203.
Hodgkin, A.L., Huxley, A.F. 1952. A quantitative
description of membrane current and its application to
conduction and excitation in nerve. Journal of.
Physiology. 117: 500-544.
Hofmann, G. A., Dev, S. B. Dimmer, S., Nanda G. S.
1999. Electroporation therapy: a new approach for the
treatment of head and neck cancer, IEEE Trans. On
Biomedical Engineering. Volume: 46, Issue: 6, 752-
759.
Joshi, R.P., Hu, Q., Schoenbach, K.H. 2004. Modeling
studies of cell response to ultrashort, high-intensity
electric fields-implications for intracellular
manipulation. IEEE Transactions on Plasma Science.
Vol. 32, issue 4, part II: 1677- 1686.
Joshi, R.P., Hu, Q., Schoenbach, K.H. 2004. Energy-
landscape-model analysis for irreversibility and ist
pulse-width dependence in cells subjected to a high-
intensity ultrashort electric pulse. Physical Review E
69, 051901.
Koyamada, K., Sakai, K., Itoh, T. 2004. Parameter
Optimization Technique Using The Response Surface
Methodology. Proc. of the 26th Annual Int. Conf. of
the IEEE EMBS San Francisco, CA, USA Sept. 1-5.
Kotnik, T., Miklavcic, D. 2006. Theoretical Evaluation of
Voltage Inducement on Internal Membranes of
Biological Cells Exposed to Electric Fields.
Biophysical Journal. 90:480-491.
Miller, C. E., Henriquez, C.S. 1988. Three Dimensional
Finite Element Solution for Biopotential: Erythrocyte
in an Applied Field. IEEE Transaction on Biomedical
Engineering. Vol. 35, No. 9: 712-718.
Neumann, E., Sowers E., and Jordan C. A.,
Electroporation and Electrofusion in Cell Biology
.
New York: Plenum, 1989.
NIST/SEMATECH e-Handbook of Statistical Methods,
http://www.itl.nist.gov/div898/handbook/
Sukharev, S. I., et al. 1992,. Electroporation and
electrophoretic DNA transfer into cells. The effect of
DNA interaction with electropores. Biophys. J. 1992,
63(5): 1320–1327.
Vasilkoski, Z., Esser, A. T., Gowrishankar, T. R., Weaver,
J.C. 2006. Membrane electroporation: The absolute
rate equation and nanosecond time scale pore creation.
2006. Physical Review E 74. 021904.
Weaver, J.C. 2000, Electroporation of cells and tissues,
IEEE Transactions on Plasma Science, 2000, Vol. 28,
Issue: 1, 24-33.
EFFICIENT EVALUATION OF THE INFLUENCE OF ELECTRIC PULSE CHARACTERISTICS ON THE
DYNAMICS OF CELL TRANS-MEMBRANE VOLTAGE
145
