
APPLICATION OF WEIGHTED LEAST SQUARES TO
CALIBRATE A DIGITAL SYSTEM FOR MEASURING THE
RESPIRATORY PRESSURES
José Leonardo Ferreira, Nadja Carvalho Pereira, Marconi de Oliveria Júnior, João Lucas da Silva
Flávio Henrique Vasconcelos, Carlos Julio Tierra-Criollo
Department of Electrical Engineering, UFMG, Av. Antônio Carlos 6627, Belo Horizonte, Brazil
Raquel Britto, Verônica Franco Parreira
Department of Physiotherapy,UFMG, Av. Antônio Carlos 6627, Belo Horizonte, Brazil
Keywords: Calibration, measurement uncertainty, respiratory pressures measuring, weighted least squares.
Abstract: This article presents the results associated to calibration and evaluation of the measurement uncertainty of a
digital respiratory pressures measuring system developed at the Biomedical Engineering Research &
Development Laboratory (NEPEB) of the Department of Electrical Engineering – UFMG. The proposed
method uses the least squares weighted regression to establish the measurement model and to evaluate the
uncertainty. The standard expanded uncertainty estimated by the model was 1.4 kPa.
1 INTRODUCTION
The qualitative and quantitative characterization of
the result of a measurement is a demand of
metrology organisms, providing knowledge about
the reliability, important to quality control of
products and services. In Brazil, the National
Institute of Metrology, Standardization and
Industrial Quality (INMETRO) is the local NMI
(national measurement institute) and as such is
organism responsible for metrology politics and for
establishing criterions and general normalization
relative to expression of uncertainty (INMETRO,
2007).
Brazilian Ministry of Health (MS) established
the compulsory certification for medical and hospital
equipment (MHE), not only attributing conditions
for a major credibility of use, but, also causing a
huge demand for calibration services in the country.
A non-calibrated medical equipment can lead clinic
diagnostic errors, wrong therapies and iatrogeny in
patients.
Today, regulation of certification process of
MHE quality in Brazil is defined by two normative
documents: MS and ANVISA (1999) and MIDIC
and INMETRO (2006). The former defines the
strategies, while the latter describes the technical
details for certification.
A digital system was developed at NEPEB
(Silva, 2006) in order to measure the maximum
pressures exerted by the muscles of the human
respiratory system. It was designed as equipment to
be used in diagnostic and therapy and, therefore,
must be submitted to metrological evaluation
according to the standards of the MS. Thus, the
measuring system must be certificated, and this
process requires instrument calibration and the
evaluation of the measurement uncertainty.
The measuring system includes a signal
acquisition module for pressure and an analogical to
digital signal conversion module that allows the
digital data to be acquired using a personal computer
(PC) through an USB interface.
2 OBJECTIVES
The signal acquisition module of pressure,
denominated manovacuometer, uses two sensors of
differential pressure, model MPX5050 by Freescale
Semicondutor Inc. (Austin, Texas). The sensor
possesses two pressure sides (figure 1) and the
measured value corresponds to the differential
220
Leonardo Ferreira J., Carvalho Pereira N., de Oliveria Júnior M., Lucas da Silva J., Henrique Vasconcelos F., Julio Tierra-Criollo C., Britto R. and Franco
Parreira V. (2008).
APPLICATION OF WEIGHTED LEAST SQUARES TO CALIBRATE A DIGITAL SYSTEM FOR MEASURING THE RESPIRATORY PRESSURES.
In Proceedings of the First International Conference on Biomedical Electronics and Devices, pages 220-223
DOI: 10.5220/0001052602200223
Copyright
c
SciTePress
pressure taken between the two sides. Nevertheless,
it is important to emphasize that pressure in one side
(P1) must be always higher than that in the other
side (P2).
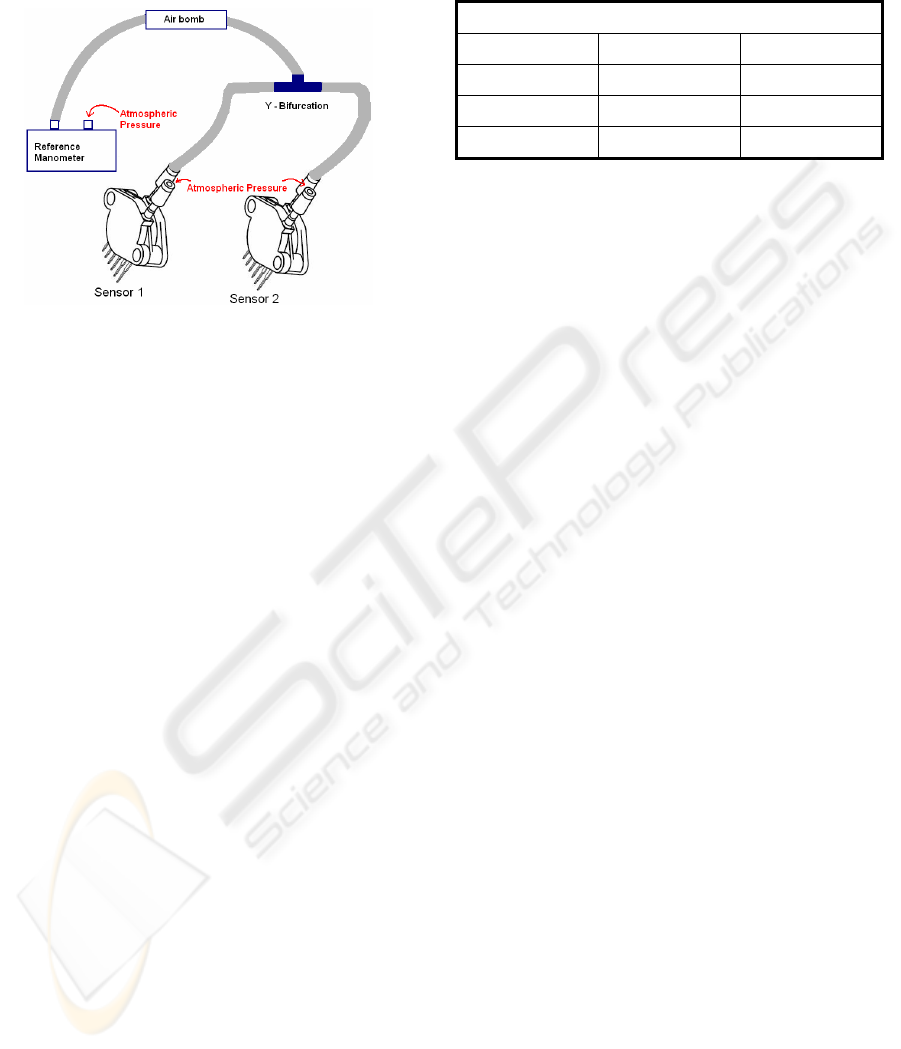
Figure 1: Schematic implementation for prototype
calibration.
The purpose of this work is to carry out the
calibration of digital manovacuometer developed by
NEPEB. The proposed metrological model was built
using the weighted least squares method, and, in that
way, the measurement uncertainties was evaluated.
3 METHODOLOGY
3.1 Calibration Measurement System
Protocol
In order to carry out the calibration of the digital
manovacuometer, the protocol describe in
(INMETRO, 1997) was used. Two were the
motivation for the use of that procedure: (i) the
sphygmomanometers with aneroid manometer was
one of few clinic equipments that have
normalization, regulation and control by INMETRO;
(ii) although the normalization is specific for
sphygmomanometers with aneroid manometer, this
refers to the same type of physical quantity
measured by the manovacuometer.
Tests were implemented to get the calibration
curves for the two sensors of the developed
equipment: i) the maximum indication error test and
ii) the hysteresis test.
According to that procedure, the pressure applied
to the sensors has to be increased and thereafter
decreased. The pressure values (table 1) were
applied during approximately five seconds, and an
average voltage was evaluated at the output of the
manovacuometer. The tests were performed four
times, and a curve of the output voltage versus
applied pressure, for each sensor, was plotted.
Table 1: Reference pressure values applied to prototype.
Pressure (kPa)
4.0 9.3 12.0
13.3 20.0 26.7
33.3 40.0 46.7
53.3 60.0 –
Curve fitting was implemented using the method of
weighted least squares (ABNT and INMETRO,
2003; Lira, 2002; Mathioulakis and Belessiotis,
2000; Press et al., 1992). It was chosen to make the
fitting for the average rising and fall curves of each
sensor. Hence, two curves (rising and fall) were
obtained for each sensor.
The instrument which measure the pressure
applied to the prototype was a digital commercial
manovacuometer (reference manometer) by Ecil
(model BB480003) with reported maximum
uncertainty of 0.03% (k=2), traceable to the SI
standard. In figure 1, it is illustrated the schematic
for calibration of the prototype, built in our
laboratory.
3.2 Evaluating Measuring Uncertainty
Protocol
The proposed model to calculate the measuring
uncertainty, u
Pc
, which is associated to the pressure
corrected value, was built using the regression fitting
obtained with the weighted least squares method.
The u
Pc
and the uncertainty of the reference mano-
vacuometer lead to the evaluating of the standard
combined uncertainty u
c
(P) and, consequently, to the
expanded uncertainty U
p
of the measured pressure
with the prototype for a test pressure of 26.7 kPa.
4 RESULTS
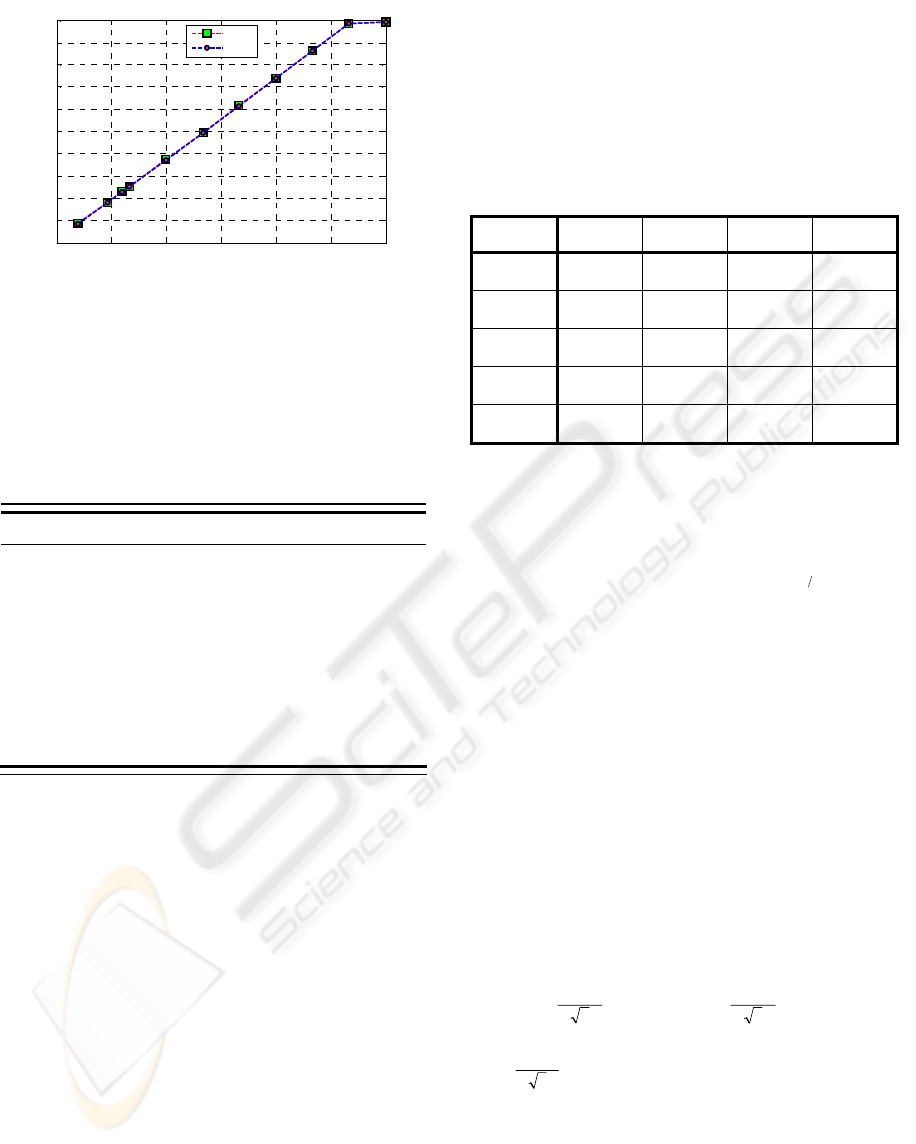
Figure 2 shows the average calibration curves (rising
and fall) for sensor 1 of the manovacuometer under
calibration (similar calibration curves to sensor 2).
For fitting implementation, the linear region (up to
53.3kPa) was used. For each calibration curve, the
fitting was approximated by the equation:
mrc
aVbP +=
(1)
where P
rc
corresponds to pressure given a voltage on
the output of the manuovacuometer (V
m
) under
calibration.
APPLICATION OF WEIGHTED LEAST SQUARES TO CALIBRATE A DIGITAL SYSTEM FOR MEASURING THE
RESPIRATORY PRESSURES
221
0 10 20 30 40 50 60
0
0.5
1
1.5
2
2.5
3
3.5
4
4.5
5
Calibration Curves for Sensor 1
Pressure (kPa)
Voltage (V)
Rising
Fall
Figure 2: Calibration average curves for sensor 1.
In table 2, are given the reference pressure values
associated to measured output voltage values
(calibration points) and the respective standard
combined uncertainty to rising curve of sensor 2.
Table 2: Reference pressure and output voltage values and
associated uncertainties – sensor 2 (rising curve).
P
r
(kPa) u
Pr
(kPa) V
m
(V) u
Vm
(V)
4.0 0.0006 0.4578 0.0024
9.3 0.0014 0.9257 0.0066
12.0 0.0018 1.1753 0.0022
13.3 0.0020 1.2909 0.0036
20.0 0.0030 1.8904 0.0035
26.7 0.0040 2.4955 0.0050
33.3 0.0050 3.0974 0.0047
40.0 0.0060 3.7094 0.0045
46.7 0.0070 4.3333 0.0034
53.3 0.0080 4.9410 0.0050
The uncertainty u
Pr
associated to reference
manovacuometer, was evaluated using the value of
the related standard expanded uncertainty, as long as
the uncertainty u
Vm
was estimated based on
fluctuation of the repeated readings in each
calibration point (Mathioulakis and Belessiotis,
2000), correspondent to type A uncertainty.
The mathematics of linear regression fitting
using weighted least squares is described with more
details in Lira (2002), Mathioulakis and Belessiotis
(2000) and Press et al. (1992). The slope a and the
intercept b as well as the associated uncertainties u
a
e u
b
can be obtained from:
(
)
LKCKK
TT
⋅=⋅⋅
(2)
where, C is a vector whose elements are the fitted
coefficients a and b; and W=(K
T
.L)
-1
is a matrix
whose diagonal elements are the variances of a (w
2,2
)
and b (w
1,1
). The off-diagonal elements w
1,2
=w
2,1
are
the covariances between these parameters. K and L
are a matrix and a vector, respectively, whose
elements are weighted by pounds that depend on the
uncertainties u
Pr
and u
Vm
. Solving (2), one obtains
the parameters and their uncertainties for each
average curve. The results are shown in table 3.
Table 3: Values for the parameters a and b and its
uncertainties u
a
and u
b
.
Sensor 1 -
Rising
Sensor 1 -
Fall
Sensor 2 -
Rising
Sensor 2 -
Fall
a
(kPa/V)
10.9747 10.9797 11.0159 10.9747
u
a
(kPa/V)
0.0050 0.0034 0.0086 0.0026
b
(kPa)
-0.5845 -0.5280 -0.9506 -0.7989
u
b
(kPa)
0.0169 0.0079 0.0206 0.0077
Cov(b,a)
(kPa/V)
-7.44x10
-5
-2.13x10
-5
-1.43x10
-4
-1.71x10
-5
Calculation of the uncertainty u
Pc
associated to
calibration points is derived from the law of
propagation of uncertainties (ABNT and
INMETRO, 2003) and equation (1):
(
)
21
22222
),(2 abCovVuVuuau
mambVPc
m
+++=
(3)
The standard combined uncertainty, in turn, was
obtained by:
22
)(
Mc
uuPu
Pc
+=
(4)
where u
M
is the uncertainty associated to reference
manovacuometer.
The measuring uncertainty was calculated in
relation to a calibration point (26.7 kPa) arbitrarily
chosen of the average rising curve of the sensor 2.
To this point, the average output voltage is
V
m
= 2.4955 V. The uncertainty u
Vm
is estimated
considering the type A uncertainty, u
V
, the sensor
accuracy, u
E
, and the resolution of manovacuometer
under calibration, u
R
:
Vu
V
0050.0
4
0100.0
==
Vu
E
0650.0
3
1125.0
==
Vu
R
00006.0
3
0001.0
==
Vuuuuu
VmREVVm
0652.0
2222
=⇒++=
Taking account these values, those of third column
of table 3 and (3) result u
Pc
=0.7183 kPa. For the
reference pressure of 26.7 kPa, the value of u
M
is
equal to 0.0040 kPa. Hence, the standard combined
uncertainty is estimated as 0.7 kPa. Finally, the
value for the standard expanded uncertainty is
BIODEVICES 2008 - International Conference on Biomedical Electronics and Devices
222

evaluated using the expression of Welch-
Satterthwaite (ABNT and INMETRO, 2003).
For the confidence interval of 95.45%, the obtained
value for the effective number of degrees is ν
eff
→∞,
which indicates a coverage factor of k=2. Therefore,
the estimated value for the standard expanded
uncertainty is equal to U
p
=1.4 kPa.
5 DISCUSSIONS
The repeatability of measurement of calibration
curves, as discussed in other works of NEPEB, was
confirmed here. The maximum value obtained for
the type A uncertainty associated to the values of V
m
is equal to 0.0066 V.
Calculations of hysteresis were performed
considering the fitting curves. The maximum
absolute value obtained for hysteresis was equal to
0.1467 kPa for sensor 1 and 0.2957 kPa for sensor 2.
These values are much lower than the value
established by INMETRO for sphygmomanometers
with aneroid manometer. In the same way, when is
considered the linear region, it is noticed that the
results obtained in maximum indication error test are
also inside the tolerance range determined by
INMETRO for this equipment (0.4 kPa).
The standard combined and expanded
uncertainties estimated for the prototype (for
reference pressure of 26.7 kPa) were 0.7 kPa and
1.4 kPa, respectively. The last value is lower than
that suggested in INMETRO (2006) for analogical
pressures measuring systems, that is, 12 kPa.
6 CONCLUSIONS
The proposed model to calibrate the digital
manovacuometer developed at NEPEB uses the
weighted least squares. This model indicates that the
hysteresis, maximum indication error and
uncertainty of the prototype were inside the
tolerance range established by INMETRO.
In future works it must be investigated and
inserted to the proposed metrological model other
possible factors that can be influencing the result
prototype uncertainty, as those associated to A/D
converter, temperature variation and correlation
between the curves parameters and input pressure.
ACKNOWLEDGEMENTS
To FAPEMIG and CNPq for financial support. To
CETEL/SENAI/FIEMG represented for Luiz
Henrique, Marcus Vinicius and Reiner that lent the
laboratory and reference manovacuometer for the
measurements. To Rômulo Martini of FHEMIG.
REFERENCES
ABNT; INMETRO, 2003. Measurement uncertainty guide
(free translation). ABNT, INMETRO, Rio de Janeiro.
Brazilian Ministry of Development, Industry and Foreign
Commerce (MIDIC); INMETRO, 2006. Establishes
the evaluation of conformity for MHE. Portaria N
o
86
de 3 de abril de 2006.
Brazilian Ministry of Health (MS); Brazilian National
Health Vigilance Agency (ANVISA), 1999.
Establishes the certification for MHE. Resolução N
o
444 de 31 de agosto de 1999.
INMETRO, 2007. Homepage: http://www.inmetro.gov.br
INMETRO, 1997. Procedure for verification of the
sphygmomanometers with aneroid manometer (free
translation). INMETRO, Rio de Janeiro.
INMETRO, 2006. Guidelines to carry out the calibration
of analogical system measuring pressure (free
translation). INMETRO, Rio de Janeiro.
Lira, I., 2002. Evaluating the measurement uncertainty:
fundamentals and practical guidance. Bristol and
Philadelphia: IoP.
Mathioulakis, E.; Belessiotis, V. 2000. Uncertainty and
traceability in calibration by comparision. Meas. Sci.
Technol., 11: 771-775
Press, W.; Teukolsky, S.; Vetterling, W; Flannery, B.
1992. Numerical recipes in C: the art of scientific
computing. 2nd ed. Cambridge University Press,
Cambridge, 2
nd
edition.
Silva, J, 2006. Development of a digital system for
measuring maximum respiratory pressures (free
translation). Monografia (Bacharelado em Engenharia
de Controle e Automação) – Escola de Engenharia,
Universidade Federal de Minas Gerais, Belo
Horizonte.
APPLICATION OF WEIGHTED LEAST SQUARES TO CALIBRATE A DIGITAL SYSTEM FOR MEASURING THE
RESPIRATORY PRESSURES
223
