
AUTOMATIC SEGMENTATION OF CAPILLARY NON-PERFUSION
IN RETINAL ANGIOGRAMS
Amit Agarwal, Jayanthi Sivaswamy
CVIT, International Institute of Information Technology, Hyderabad, India
Alka Rani
Aravind Eye Institute, Hyderabad, India
Taraprasad Das
LV Prasad Eye Institute, Hyderabad, India
Keywords:
Capillary Non-Perfusion, Retina, Extrema Pyramid, Disease detection.
Abstract:
Capillary Non-Perfusion (CNP) is a condition in diabetic retinopathy where blood ceases to flow to certain
parts of the retina, potentially leading to blindness. This paper presents a solution for automatically detecting
and segmenting CNP regions from fundus fluorescein angiograms (FFAs). CNPs are modelled as valleys, and
a novel multiresolution technique for trough-based valley detection is presented. The proposed algorithm has
been tested on 40 images and validated against expert-marked ground truth. Obtained results are presented as
a receiver operating characteristic (ROC) curve. The area under this curve is 0.842 and the distance of ROC
from the ideal point (0, 1) is 0.31.
1 INTRODUCTION
Diabetes is occurring in an ever increasing percent-
age in the world. Diabetes mellitus affects many or-
gans of the body, and the eye is one of the organs
that is affected relatively early (compared to the kid-
ney). While diabetes affects all parts of the eye, the
retina (retinopathy) is most commonly affected. Dia-
betic retinopathy progresses in phases. It starts with
microaneurysms and superficial retinal hemorrhages
(non-proliferative diabetic retinopathy; NPDR), pro-
gresses to accumulation of hard exudates in the pos-
terior pole (diabetic maculopathy), and finally ends
with new vessels in the surface of the retina and/or the
optic disc (proliferative diabetic retinopathy; PDR).
The underlying cause of the terminal event, the reti-
nal new vessels, is retinal ischemia which manifests
as areas of CNP that is most clearly seen in an FFA.
These lesions appear as dark regions in the FFA im-
ages as shown in Fig. 1. If not treated in time, the
CNP areas grow and spread across the entire retina.
Large areas of non-perfusion lead to new vessel for-
mation and bleeding into the vitreous cavity. These
complications are responsible for severe visual loss in
most patients with PDR (Kohner, 1993). FFA guides
the choice and extent of laser treatment in diabetic
maculopathy and PDR.
An automatic identification of important events
in FFA is objective and very useful both for referral
and treatment. Automated analyses of FFA images
for the purpose of extracting important structures as
well as lesions have received some attention. Im-
age conditioning solutions that have been proposed
include illumination correction using a parametric
bi-cubic model for the illumination function (Cree
et al., 1999) and noise suppression for a sequence of
angiogram images based on bilateral filtering (Guo
et al., 2005b). In FFA segmentation, stochastic
models have been proposed to segment the fovea,
arteries and veins from the central (macular) view
of FFAs (Sim´o and de Ves, 2001) and among le-
sions, microaneurysms have received much attention.
Several techniques ranging from morphological to
model-based have been proposed for microaneurysm
segmentation (Fleming et al., 2006), (Hafez, 2002)
and (A. M. Mendonc¸a, 1999). An automated tech-
nique for measurement of blood flow in capillaries
has been attempted from angiograms, for determining
the effect of cardio-pulmonary bypass surgery (Jagoe
et al., 1992). The foveal region of the retinal image
170
Agarwal A., Sivaswamy J., Rani A. and Das T. (2008).
AUTOMATIC SEGMENTATION OF CAPILLARY NON-PERFUSION IN RETINAL ANGIOGRAMS.
In Proceedings of the First Inter national Conference on Bio-inspired Systems and Signal Processing, pages 170-177
DOI: 10.5220/0001058201700177
Copyright
c
SciTePress

is processed to enhance the vascular structure and ex-
tract linear segments. The processed results from im-
ages taken before and after the bypass surgeryare then
compared (via a logical AND operation) to identify
the differences. However, to our knowledge, there are
no reports in the literature of any technique to detect
the cause of PDR namely the presence of the CNP re-
gions anywhere in the retina. Detecting and segment-
ing CNPs is the focus of this paper.
The clinical procedure to detect CNPs is a visual
scan of an FFA image. In order to estimate the amount
of area damaged, the scan is generally done on the
composite image of the retina obtained after suitable
mosaicing of several retinal segments. Such a pro-
cedure suffers from several drawbacks: the variable
skills and subjectivity of the observer, which also de-
pend on the quality of the images; a lack of precise un-
derstanding of the area of retina affected which helps
in deciding the nature and extent of laser treatment.
Automated image analysis techniques can be used to
address these issues but there are several challenges in
devising solutions for CNP segmentation. FFAs suf-
fer from non-uniform illumination due to the eye ge-
ometry, imaging conditions and presence of other me-
dia opacity such as cataract. Inter-patient and intra-
patient variablility is also possible. The former is due
to different pupil dilations and the latter is due to the
time of image capture after injection of fluorescein
dye. Another compounding factor is that the mean
grey level of CNPs as well as their shape and size are
variable, with the size ranging from very small to very
large (from 100 to 55000 pixels). Often, the bound-
aries of CNPs are not well defined because of an in-
homogeneous textured background. Thus, the only
visually distinguishing characteristic of a CNP is that
it is relatively darker than its surround.
In this paper, we propose a novel method to ex-
tract and quantify regions of CNP based on modeling
CNPs as valleys in the image surface. The algorithm
for CNP segmentation is developed and its details are
presented in the next section. Section 3 provides im-
plementation details and illustrative test results of the
algorithm. Finally, some discussions and conclusions
are presented in the last section.
2 VALLEY BASED CNP
SEGMENTATION
2.1 Modelling CNP Regions
As discussed earlier, CNP occurs when the capillary
network in a region of the human retina stops func-
tioning and does not supply blood to the correspond-
ing areas. In FFAs, regions receiving normal blood
supply appear as bright white regions since they carry
a fluorescent dye and regions lacking in blood (due
to abnormal supply of blood) appear as dark regions.
Hence, regions of CNP appear as dull/dark lesions
bounded by healthy vasculature.
A sample FFA image and an enlarged view of a
CNP region and its surroundings is shown in Fig. 1.
Also, included in this figure is the surface plot of the
corresponding CNP region from which we can ob-
serve that the prominent vessels, the healthy capillary
network and the CNP have very different topographic
charactersitics: While the major vessel appears as a
ridge, the CNP appears as a valley with the healthy
capillary network appearing as a plateau in the image.
Hence, one can conclude that CNPs can be modelled
as valleys. Watershed-based solution to valley detec-
tion (for example, (Gauch, 1999)) is possible, how-
ever, these result in oversegmentation or in the case
of marker-based versions, require additional informa-
tion. In the case of CNP detection, since the size of a
CNP and the nature of its surround can be highly vari-
able, obtaining such markers can be quite challenging.
A better alternative is to identify the trough (lowest
point on a curve) and use it to segment a CNP. Hence,
we have taken a different approach to the problem
and propose a technique that detects trough points and
collates them across scales. We next present the de-
tails of our proposed algorithm for CNP segmentation
comprising several steps.
2.2 CNP Detection Algorithm
The proposed CNP detection algorithm consists of
these stages: Firstly, illumination correction (IC) is
done to minimise the background intensity variation
followed by denoising to eliminate noise that is fre-
quently found in FFAs. Next, valley detection is per-
formed to locate the seed points in the CNP regions
which are used to extract the candidate CNP regions
using a region growing algorithm. Finally, threshold-
ing is done to reject false positives among the detected
candidates. The processing in each of these stages are
described next.
2.2.1 Illumination Correction
Nonuniform illumination is a problem in retinal
colour images as well as angiograms. A camera-
model based solution for illumination correction in
angiograms, obtained with non-confocal imaging, is
given in (Cree et al., 1999) which assumes a macula-
centric view of the retina. Our images are not neces-
sarily macula-centric and are obtained from a laser-
AUTOMATIC SEGMENTATION OF CAPILLARY NON-PERFUSION IN RETINAL ANGIOGRAMS
171
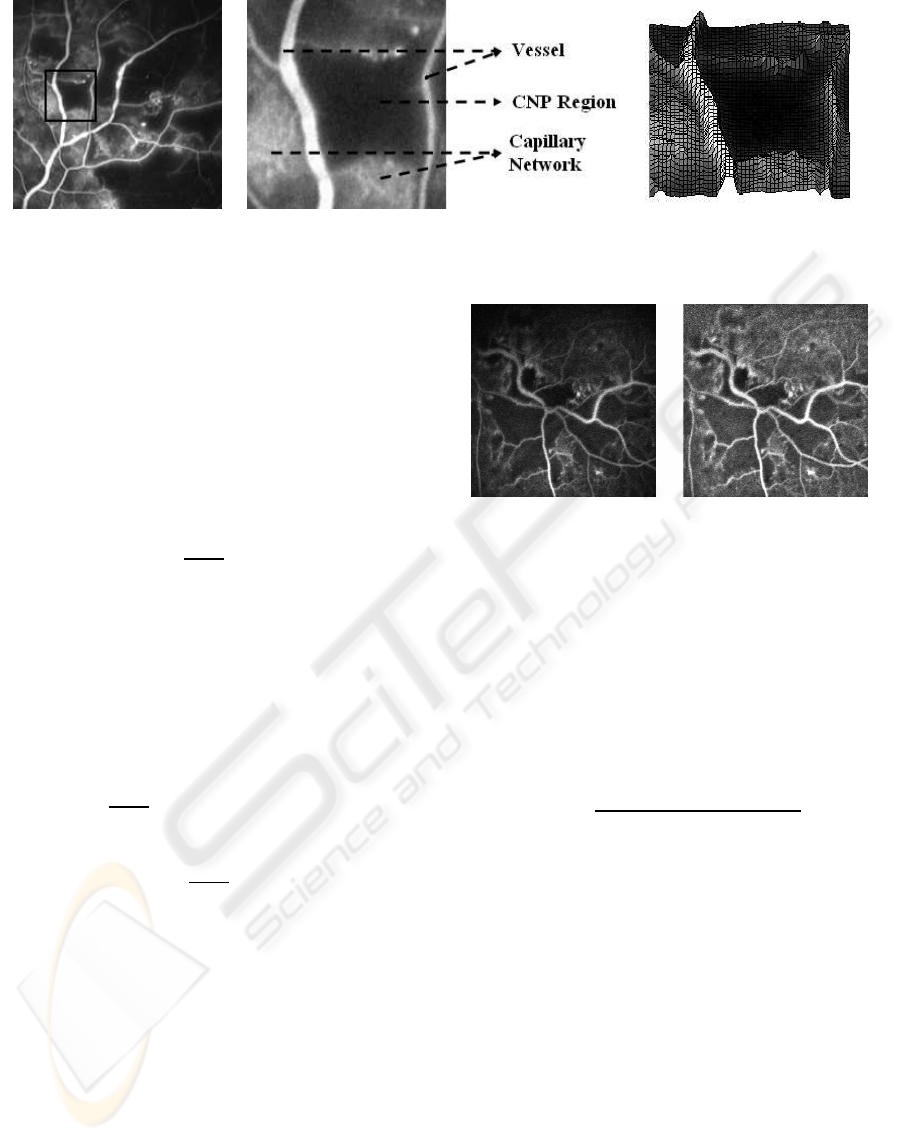
(a) (b) (c)
Figure 1: (a) A sample FFA image with CNP. (b) Enlarged view and (c) surface plot of the CNP region in (a).
based confocal imaging system. We modified a quo-
tient based approach proposed for face images (Wang
et al., 2004) and model the non-uniform illumination
as a multiplicative degradation function which is es-
timated by blurring the corrupted image. Let I(x, y),
I
s
(x, y) and I
0
(x, y) denote the given, smoothed and
corrected images, respectively and l
0
be the desired
level of illumination. The corrected intensity value at
location (x, y) is found as
I
0
(x, y) =
(
I(x, y) ×
l
0
I
s
(x,y)
if I
s
(x, y) < l
0
I(x, y) if I
s
(x, y) ≥ l
0
(1)
As can be observed from Eq. 1, a pixel where the
estimated illumination is greater than the ideal illumi-
nation value is not corrected. This is to ensure that
the regions which are inherently bright, like the optic-
disk, haemorrhages, etc., are not wrongly classified
as regions of excessive illumination and corrected ac-
cordingly. When the estimated illumination value is
less than the ideal illumination value, multiplication
by the fraction
l
0
I
s
(x,y)
ensures that regions with illumi-
nation less than the l
0
are elevated to the ideal illu-
mination value. Moreover, contrast at such a pixel is
improved by a factor of
l
0
I
s
(x,y)
thereby removing the
need for subsequent brightness and contrast opera-
tions, as required in the case of quotient-image based
technique. A sample FFA image and corresponding
illumination corrected image is shown in Fig. 2.
2.2.2 Noise Removal
The laser-based imaging produces fine-grain speckle
type of noise in the angiograms as can be seen in
Fig. 2. A bilateral filter-based approach proposed
for color and gray scale images in (Tomasi and Man-
duchi, 1998) has been successfully applied to denoise
images in an angiogram sequence (Guo et al., 2005a).
The strength of bilateral filter based denoising is its
ability to denoise without compromising edge qual-
ity. This is due to the filter’s nonlinear characteristic
Figure 2: A sample FFA image and Illumination corrected
image.
which permits one to take into account the spatial dis-
tance as well the photometric similarity of a pixel to
its neighbors. The spatial context is provided by a
domain filter while the photometric similarity is con-
trolled by a range filter. We use a version of the bilater
filter for our noise removal task which is described
next. Given an input pixel I(P), the output pixel I
0
(P)
is found as
I
0
(P) =
∑
w
I(Q)W
d
(P, Q)W
r
(P, Q)
∑
w
W
d
(P, Q)W
r
(P, Q)
(2)
where P and Q are position vectors, w is the current
neighbourhood and W
d
, W
r
are Gaussian kernels of
the domain and range filters respectively. The edge
preservation feature of the bilateral filter can be seen
in the results of preprocessing (illumination correc-
tion + denoising) in Fig.6 (b).
2.2.3 CNP Segmentation
Now we turn to the main task of detecting and seg-
menting CNP regions. Since we have modelled CNPs
as valleys, a valley detection algorithm is needed to
detect seed points in the CNP regions. As the CNPs
vary widely in size, the valleys can be extended.
Hence, a multiresolution approach is appropriate. The
strategy we have adopted is to reduce the valleys to
a single trough point via a pyramidal decomposition
and then detect them using a trough detector at each
BIOSIGNALS 2008 - International Conference on Bio-inspired Systems and Signal Processing
172
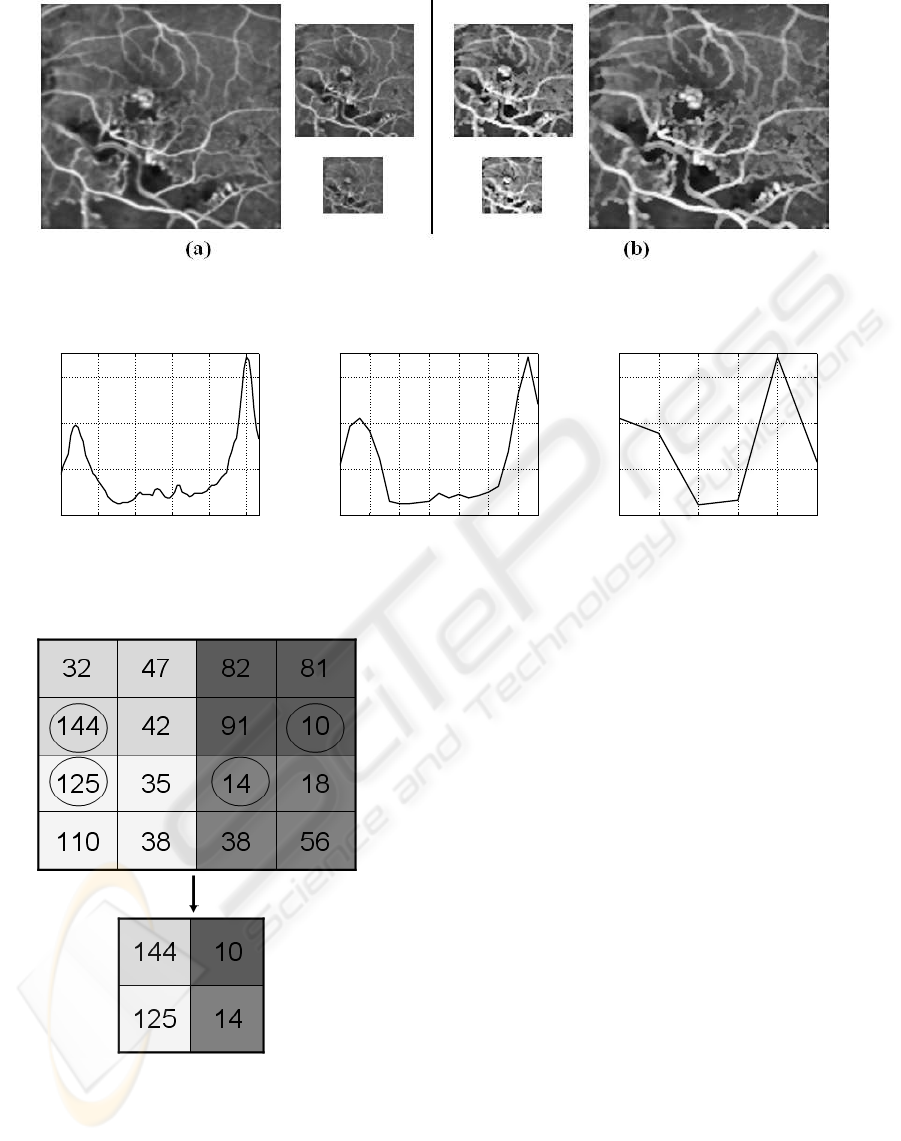
Figure 3: An FFA image at levels 3, 4, 5 in the (a) conventional and (b) proposed pyramidal decomposition.
0 15 30 45 60 75 80
60
100
140
180
200
Pixel Number
Intensity
0 3 6 9 12 15 18 20
60
100
140
180
200
Pixel Number
Intensity
0 1 2 3 4 5
60
100
140
180
200
Pixel Number
Intensity
(a) (b) (c)
Figure 4: Intensity profile of a CNP and its surround, at levels (a) 1, (b) 3 and (c) 5 of the image pyramid.
Figure 5: Example demonstrating Equation 3.
level and collating them. Each of these steps are de-
scribed next.
Extrema pyramid decomposition - A conventional
pyramidal decomposition based on averaging and
subsampling is inadequate for the problem at hand.
This can be illustrated with an example shown in Fig.
3. It can be seen that the averaging process dulls the
entire image and will therefore adversely affect CNP
detection based on troughs. Another drawback with
the averaging process is the difficulty in localising of
the trough points in the full resolution image when
performing the upsampling process after trough de-
tection. In the problem at hand, the CNP regions are
generally bigger and darker relative to the brighter re-
gions which are thin. Averaging and down-sampling
will result in the bright regions to disappear faster
than the CNP regions, whereas for locating troughs,
it would help to more or less retain the bright regions
across several levels while accepting some loss in the
CNP area. Hence, to preserve the relation between
a CNP and its surround, and maintain the depth of
the valley across levels, we need a method for pyra-
midal decomposition that will minimise the CNP re-
gions at a much faster rate compared to the brighter
surrounding regions. This calls for a controlled multi-
resolution technique. One option is to generate a
pyramid by retaining intensity maxima which will en-
sure the thinner bright regions are largely preserved
during downsampling. However, this is detrimental
to the relative contrast between a CNP and its sur-
round as it elevates the average intensity of the CNP
regions. The end result is a lowering of the depth of
AUTOMATIC SEGMENTATION OF CAPILLARY NON-PERFUSION IN RETINAL ANGIOGRAMS
173

the troughs, which is undesiarbale. A better alterna-
tive is to generate the pyramid through an adaptive
selection of pixels. The solution we propose is a tech-
nique for decomposition which is based on intensity
extrema. Specifically, given an image I
1
of size M× N
a L-level decomposition is found as follows:
I
l
(m, n) =
min{g
i, j
(m, n)} if g
i, j
(m, n) ≤ t
max{g
i, j
(m, n)} otherwise .
(3)
∀ i, j = 0, 1
where g
i, j
(m, n) = I
l−1
(2m+ i, 2n+ j), with l = 2, ...L
and t is a suitable threshold, taken to be the global
mean in our experiments. An illustration of the equa-
tion is given in Fig. 5 for t = 100.
In an extrema pyramidal decomposition of an an-
giogram, the CNP regions diminish in size at a much
faster rate than non-CNP regions across the levels.
This is illustrated in Fig. 3 (b) where the thickness of
vessels are more or less preserved but the CNPs are
reduced to near-dots in the lowest level image. This
effect is also seen from the intensity profiles shown
in Fig. 4, along a horizontal line passing through a
CNP region at different levels. The width of the val-
ley reduces from 50 pixels at the first level, to about
1 pixel in the fifth level whereas the image has been
downsampled by 16 between these levels. The rel-
ative brightness value (130) of the ridge and valley
regions is preserved as a result of not performing a
smoothing operation.
Trough detection - A trough is defined as the low-
est point on a curve. Alternatively, the brightness at a
trough is a local minimum. Since the context in which
CNPs, and hence troughs, occur is variable in an an-
giogram, two parameters can be used to characterise
a trough: µ, the mean brightness of the surround and
P, the peak factor which represents the depth of the
trough. These two parameters are used to develop the
following trough detection algorithm in which the im-
age is denoted by I(x, y).
For every pixel (x,y) do the following:
1. Initialize a Boolean variable isTrough = False.
2. Check if I(x,y) is a local minimum in a M × M
neighborhood.
3. If yes, then calculate the mean (µ) of a N × N
neighborhood, with N > M. Else, do nothing.
4. Let T = µ*P and check if I(x, y) < T.
5. If yes, then isTrough = True.
6. If isTrough = True, then mark I(x,y) as a trough
pixel. Else, do nothing.
The threshold T represents the depth of the val-
ley from the mean µ. Since the image pyramid re-
tains extrema, this threshold value has to be carefully
chosen to ensure that enough seed pixels are captured
in a valley while minimising the possibility of false
alarms. A region with low µ is likely to be a CNP
region and hence the required depth for that region
is less whereas the same may not be true if µ is high
and hence, a stricter condition is required in the latter
case. Thus, choosing T proportional to µ is appro-
priate. Furthermore, since trough detection is carried
out at multiple levels a peak factor has to be chosen
for each level. A guiding factor in this choice is that
due to retention of extremas, the likelihood of the lo-
cal minima being a CNP region will be higher at upper
levels. Hence, the peak factor should be progressively
increased with the levels in the pyramid.
After performing trough detection at all levels, the
results are combined with a simple logical OR oper-
ation. For locating the seed pixels in the original im-
age, the fact that the extrema of four pixels is selected
at every level is used iteratively.
CNP region extraction - The detected trough
points can serve as seed points for region based ap-
proach to segmenting the CNP regions. Although
geometric methods can potentially yield better re-
sults, as an initial experiment we chose to use a sim-
ple region growing technique for extracting the CNP
regions as it was computationally simpler. Given
the variability of the appearance of the CNP re-
gions within and across images, the traditionally
used intensity-based homogeneity criterion for region
growing is not suitable. Instead, by noting that CNP
regions are smooth, the better alternativeis to perform
the pixel aggregation in the variance space.
In our experiments, the range for the variance was
taken to be ±4. In order to reject false candidates, a
final thresholding operation was performed. A thresh-
old based on the global mean intensity was applied
since the global mean is always lowered with the pres-
ence of CNPs.
3 IMPLEMENTATION AND
RESULTS
The proposed algorithm was implemented as follows.
In the illumination correction stage, the ideal illumi-
nation l
0
in (1) was set to be roughly half the maxi-
mum grey value in the image or 120. The smoothed
image was obtained with a 30 × 30 Gaussian mask
on a subsampled (by 4) version of the original image
for faster processing. The resulting image was up-
sampled, one level at a time, while blurring the image
BIOSIGNALS 2008 - International Conference on Bio-inspired Systems and Signal Processing
174
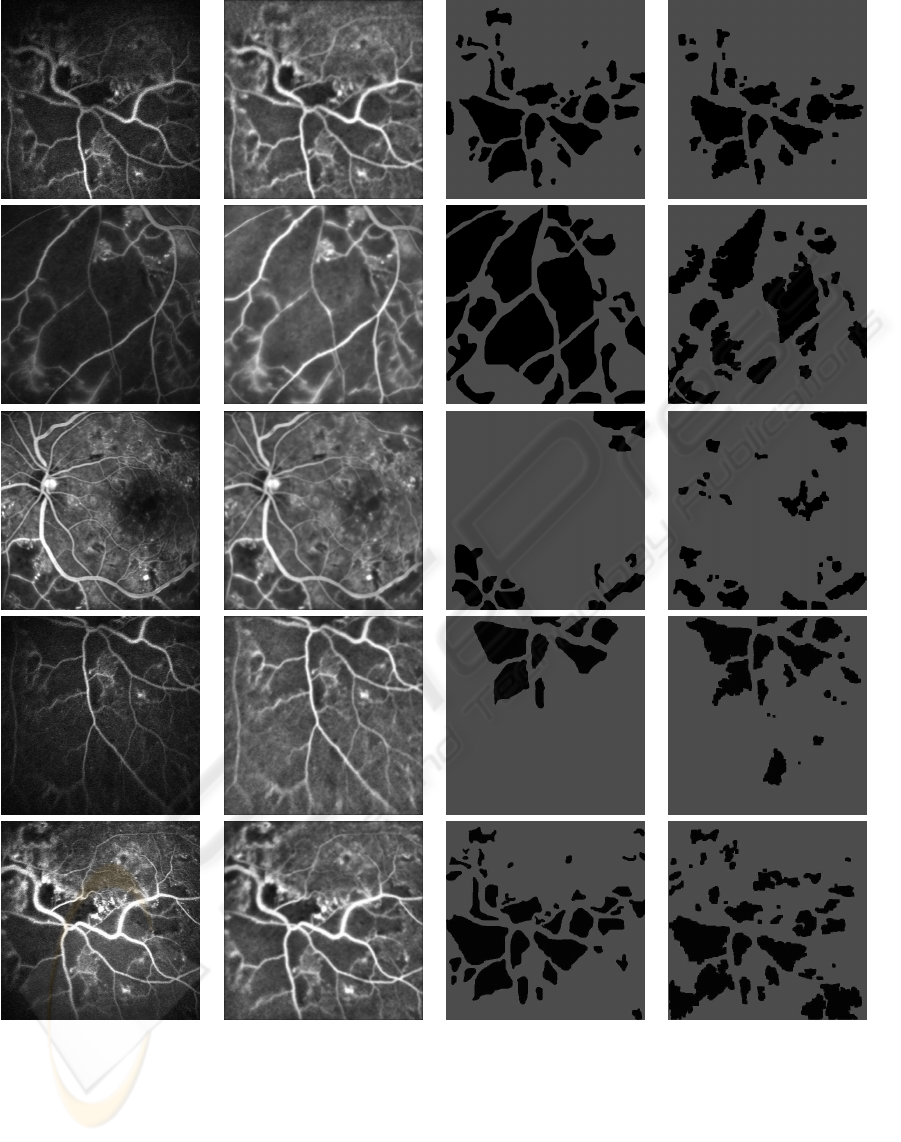
(a) (b) (c) (d)
Figure 6: Results: (a) Sample images, (b) preprocessed image, (c) corresponding ground truths and (c) segmented results with
CNP regions shown in black.
using a 5× 5 Gaussian mask at each upsampled level.
For denoising, a filter kernel size of 9 × 9 was used
and σ for the domain and range filters were fixed at
3 and 10 respectively. For valley detection, a 5-level
pyramid was generated; M, N were fixed at 5 and 7
respectively and the peak factor was incremented by
0.02 at each level in the pyramid. In region growing,
the variance was calculated over a 5 × 5 neighbour-
hood.
The proposed CNP segmentation algorithm was
AUTOMATIC SEGMENTATION OF CAPILLARY NON-PERFUSION IN RETINAL ANGIOGRAMS
175
tested on 40 images which contained many CNPs.
These were acquired from the digital confocal scan-
ning laser ophthalmoscope of Heidelberg Retina An-
giograph. The images were of retinal segments for
which the ground truth, in the form of boundaries of
CNPs, were prepared manually by a retina expert (a
co-author). Some sample test images along with cor-
responding ground truth and results of our CNP seg-
mentation algorithm, with a peak factor of 0.41, are
shown in Fig. 6 (a), (b) and (c) respectively. CNP
regions are shown in black in both ground truth and
segmented results. The five sample test images indi-
cate the variability in images in terms of quality, size
of CNPs and presence of other structures such as op-
tic disk, macula and microaneurysms. A quantitative
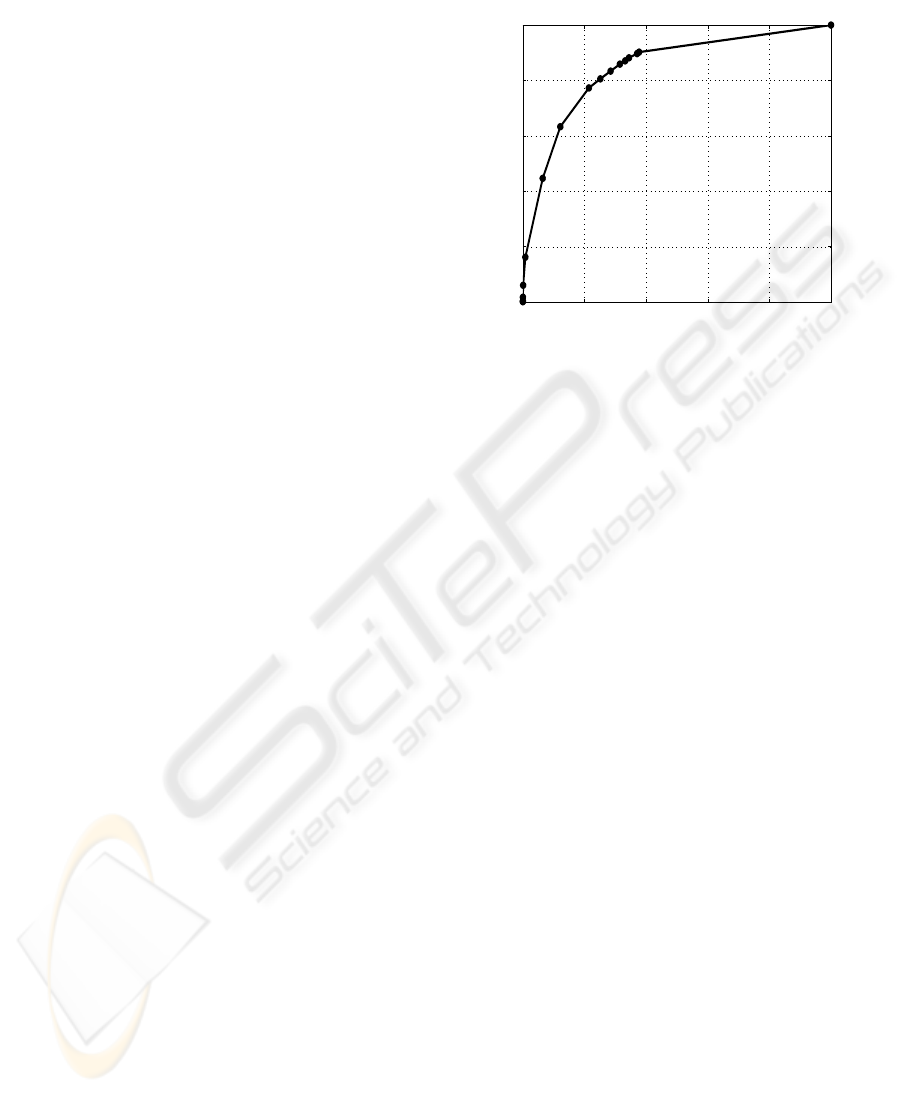
assessment of the algorithm was done using a ROC
curve and not a FROC curve since the area of CNP
is of clinical interest. A comparison between com-
puted and marked CNP segments was done on a pixel
by pixel basis. By using the peak factor as a control
parameter, the obtained ROC curve, shown in Fig. 7,
was found to have an area under the curve (AUC) of
0.842 and a distance (D
i
) to the ideal point (1,0) of
0.35. The ideal values for AUC and D
i
are 1 and 0
respectively.
4 CONCLUDING REMARKS
An unsupervised algorithm for automatically seg-
menting CNPs from FFA images has been presented.
Its overall performance is quite good as indicated by
the ROC curve and the AUC, D
i
metrics. Since there
is no reported work on this problem it is not possible
to do any benchmarking. A visual inspection of seg-
mented results indicates that the algorithm success-
fully detects CNPs of all sizes, however, it tends to
undersegment large CNPs because the IC stage inten-
sifies the variability within CNPs. A failure analysis
indicates that the macula region gets mislabled as a
CNP (as seen in the bottom row of Fig. 6) since the
two have similar characteristics, and CNPs in the im-
age peripherytend to be missed since the valley model
is weak in this region.
The main focus of the presented work was on de-
tection of CNPs. Hence, while the performance our
current implementation is quite good, there is scope
for improvement of the algorithm’s performance: ge-
ometric techniques such as fast marching method in
(Malladi and Sethian, 2006) can be used to more
accurately extract the CNP region boundaries while
a pixel-based classifier will help improve the rejec-
tion of the false alarms. Likewise, incorporation of a
macula detection stage will help the algorithm from
falsely classifying macula as a CNP region.
0 0.2 0.4 0.6 0.8 1
0
0.2
0.4
0.6
0.8
1
False Positive Fraction
True Poitive Fraction
Figure 7: ROC plot.
Finally, it should be noted that the ground truth
generation process for CNPs is a laborious one.
Retina experts found it challenging to draw precise
boundaries because they often appear to be intricate
or ill-defined. This points to the need for the use of
multiple expert-markings for a fuller evaluation of the
algorithm. Such an exercise might also shed light on
the degree of observer bias in CNP segmentation.
REFERENCES
A. M. Mendonc¸a, A. J. Campilho, J. M. N. (1999). Auto-
matic segmentation of microaneurysms in retinal an-
giograms of diabetic patients. In Proc. International
Conf. on Image Analysis and Processing, pages 728 –
733.
Cree, M. J., Olson, J. A., C.McHardy, K., Sharp, P. F., and
Forresters, J. V. (1999). The preprocessing of retinal
images for the detection of fluorescein leakage. Phys.
Med. Biol., 44:293 – 308.
Fleming, A. D., Philip, S., Goatman, K. A., Olson, J. A.,
and Sharp, P. F. (2006). Automated microaneurysm
detection using local contrast normalization and local
vessel detection. In IEEE Trans. on Medical Imaging,
volume 25, pages 1223 – 1232.
Gauch, J. M. (1999). Image segmentation and analysis via
multiscale gradient watershed hierarchies. In IEEE
Trans. on Image Processing, volume 8, pages 69 – 79.
Guo, X.-X., Lu, Y.-N., Xu, Z.-W., Liu, Z.-H., Wang, Y.-X.,
and Pang, Y.-J. (2005a). Noise suppression of fluo-
rescein angiogram sequences using bilateral filter. In
Proc. International Conf. on Machine Learning and
Cybernetics, volume 9, pages 5366 – 5371.
Guo, X.-X., Lu, Y.-N., Xu, Z.-W., and Pang, Y.-J. (2005b).
An eawa filter for denoising of filtering of fluorescein
angiogram sequences. In Proc. International Conf. on
BIOSIGNALS 2008 - International Conference on Bio-inspired Systems and Signal Processing
176

Computer and Information Technology, pages 614 –
618.
Hafez, M. (2002). Using adaptive edge technique for detect-
ing microaneurysms in fluorescein angiograms of the
ocular fundus. Proc. Mediterranean Electrotechnical
Conf., pages 479 – 483.
Jagoe, R., Arnold, J., Blauth, C., Smith, P., K.M.Taylor,
and Wootton, R. (1992). Measurement of capillary
dropout in retinal angiograms by computerised image
analysis. Pattern Recognition Letters, 13:143 – 151.
Kohner, E. M. (1993). Diabetic retinopathy. BMJ,
307(6913):1195 – 1199.
Malladi, R. and Sethian, J. A. (2006). Fast methods for
shape extraction in medical and biomedical imaging.
In R Malladi (ed) Geometric Methods in Bio-medical
Image Processing. Berlin, Springer, pages 49–61.
Sim´o, A. and de Ves, E. (2001). Segmentation of macular
fluorescein angiographies. a statistical approach. Pat-
tern Recognition, 34:795 – 809.
Tomasi, C. and Manduchi, R. (1998). Bilateral filtering for
gray and color images. In Proc. International Conf.
on Computer Vision, pages 839–846.
Wang, H., Li, S. Z., and Wang, Y. (2004). Generalized quo-
tient image. In Proc. Conf. on Computer Vision and
Pattern Recognition, volume 2, pages 498 – 505.
AUTOMATIC SEGMENTATION OF CAPILLARY NON-PERFUSION IN RETINAL ANGIOGRAMS
177
