
ADOPTION OF MOBILE SERVICES IN FINLAND
Conceptual Model and Application-based Case Study
Mari Ervasti and Heli Helaakoski
VTT Technical Research Centre of Finland, Kaitoväylä 1, P.O. Box 1100, FI-90571 Oulu, Finland
Keywords: Adoption, Mobile service, TAM (Technology Acceptance Model), TPB (Theory of Planned Behaviour),
J2ME, Finland.
Abstract: This paper offers both theoretical and empirical contributions relating to the consumers’ motives for and
barriers to adopting mobile services. A case study of a mobile service is introduced to validate the factors
that facilitate and trigger, and respectively hinder the acceptance of mobile services in Finland. The factors
affecting the service adoption were researched based on a conceptual model that was a modified version of
the Technology Acceptance Model (TAM) and of the Theory of Planned Behaviour (TPB). Based on the
findings from a survey conducted with a sample of 52 Finnish campus students, the factors that affect
consumers’ attitudes towards mobile services were discovered. Usefulness was revealed to have the
strongest impact on attitude towards a mobile service, with context information and attitude acting as
significant determinants of the intention to use the service. This study attempts to help mobile service
providers choose right development and marketing strategies for mobile services and enhance the adoption
and diffusion of mobile services.
1 INTRODUCTION
For a long time Finland has been a European pioneer
for testing new mobile services. But even in Finland,
the adoption of mobile services has been modest and
the most popular services are still based on SMS
messaging. Current mobile services do not fulfil the
requirements set by the users since the services have
been developed based on technological development
instead of users’ needs. According to Moore and
McKenna (1999) the mobile services are at the
chasm, the pioneering and early adopters are using
the services, but the masses have not yet followed
their lead. Many researches (Hyvönen and Repo,
2005; Bouwman et al., 2007) have studied the
factors that affect the adoption of mobile services in
the Finnish context but there is still a need to
evaluate the adoption factors in real-life case studies.
Kaasinen (2005) has studied the user acceptance of
mobile services by using the Technology
Acceptance Model (Davis, 1989) and built user
acceptance on four factors: perceived value of the
service, perceived ease of use, trust, and perceived
ease of adoption. Bouwman et al. (2007) have
researched mobile service adoption from the
perspectives of physical, cognitive, security and
economic barriers, and from the perspectives of the
perceived entertainment value and perceived
flexibility benefits of mobile services. Finnish
consumers’ usage of mobile services has been
studied in a report for National Consumer Research
Centre by Hyvönen and Repo (2005). The report
focuses on mobile services that Finnish people use,
the motives for and obstacles to using the services,
and the readiness to pay for mobile services.
The success of mobile services is not only
depending on technological maturity of mobile
technology and the penetration of mobile handsets;
in the end, eventually the users decide on the success
of the services. The predictions are hard to make, but
there are certain factors that need to be considered
when developing mobile services. Muller-Veerse
(2000) has identified ubiquity, reachability, security,
convenience and personalisation as the key drivers
for the mobile market today. Rogers (1995) has
developed ‘Rogers’ basic five’ factors, later
increased with two more factors (Moore and
Benbasat, 1991) that influence the adoption and
diffusion of new technologies throughout a social
system: relative advantage, compatibility,
complexity, trialability, observability, image and
131
Ervasti M. and Helaakoski H. (2008).
ADOPTION OF MOBILE SERVICES IN FINLAND - Conceptual Model and Application-based Case Study.
In Proceedings of the International Conference on e-Business, pages 131-139
DOI: 10.5220/0001910301310139
Copyright
c
SciTePress

trust. According to Rogers mobile services are likely
to be adopted if mobile solution has some clear
advantages over existing products or services.
Mobile services should also be compatible with
existing practices, values, and skills of potential
adopters, and easy to understand and use. If it is not
possible to experiment with the service before
making an adoption or rejection decision, and if the
benefits offered by the service are not visible, then
adopters are likely to perceive uncertainty and risk
in adopting the service. Today the mobile phone is
more like a reflection of one’s identity, so if the
adoption and use of mobile service is perceived to
communicate one’s personality and enhance the
image and status, it has more potential to be adopted.
It is also important that the mobile service adopter
perceives the service provider to be trustworthy.
There are several factors inhibiting the use of
services, although the technology maturity is no
longer an obstacle and even so the adoption and
diffusion of mobile services has not yet proceeded as
fast and wide as have been assumed. Development
of technology is commonly seen as an important
prerequisite, or even as a reason, for people to adopt
new mobile services. According to Gillick and
Vanderhoof (2000), the new mobility experience,
i.e. the anytime and anyplace access to desired
products and services, will be the greatest benefit for
the consumer. However, Figge (2004) claims that
the ubiquity alone is not enough to ensure a user
acceptance and the success of a mobile application:
as the user’s problems vary with the context in
which he or she accesses service, the service based
on information of the specific context is likely to
become the user’s favourite. Gilbert and Han (2005)
identified one key barrier of attracting a critical mass
of adopters as the lack of compelling content, and
another as the differences among adoption patterns
in individual market segments. Aarnio et al. (2002)
proposed two major reasons above all inhibiting the
use of mobile services; the high pricing and the
restricted quality of services.
Hyvönen and Repo (2005) have stated that
mobile services are not adopted linearly according to
the assumptions of diffusion theory. Their studies
state that the socio-demographic factors do not
essentially affect the adoption of mobile services;
instead, the best way to explain the use of mobile
services is to research the general attitudes towards
new technology, mobile services and devices. In a
survey by Cheong and Park (2005) conducted in
Korea, perceived playfulness was found to be
influential in predicting the behavioural intention to
use mobile Internet. Whereas findings from a
consumer survey conducted in Finland (Anckar,
2002) indicated that m-commerce adoption mainly
appears to be driven by a need for solutions that add
convenience and flexibility to daily routines rather
than excitement and entertainment. Anckar (2002)
also found out that consumers perceive the ability to
satisfy spontaneous and timecritical needs as the
most important driver of m-commerce adoption.
This paper researches and validates factors that
facilitate and trigger, and respectively hinder, the
adoption of mobile services in Finland. Finland has
been selected as a case country since it is considered
as a pioneer of mobile technologies. In August 2007,
97% of Finns had at least one mobile phone
(Statistics Finland, 2007). The findings from the
survey conducted in autumn 2007 (Invest in Finland,
2008), based on information on four million mobile
phones from three telecom operators, showed that
Finns change their mobile phones every 2.7 years.
More than 70% of the phones in use had a colour
screen and half included a camera. The 3G phones
gained an 18% share of the market, which was more
than double the figure in 2006. In the study in which
participated over 1500 Finns aged 15-64 in year
2006, one quarter of those surveyed reported having
browsed web pages with their mobile phones (It-
viikko, 2007).
Furthermore the paper studies what kinds of
services are likely to be adopted; and how
businesses can enhance the adoption and diffusion of
mobile services. In order to validate the adoption
factors in practice this paper presents a real life case
study of launching the mobile service. The case
mobile service was based on downloadable Java
application, not yet eagerly adopted at least in
Finland. It was tested in a delimited user group of
students and personnel in Finnish campus area in the
field trial. Mobile service offered information about
internal news, events, announcements and schedules
of the study community, as well as a mobile flea
market for buying and selling own things through
mobile channel. The aim of provided services was to
enable easy access for essential information despite
the time and place. Especially students require
multi-channel services due to their mobile lifestyle.
This paper is organized as follows: chapter 2
represents the conceptual model of mobile service
adoption and chapter 3 describes the empirical
evaluation of case mobile service. In chapter 4 the
feedback questionnaire of the case study is presented
and the results of the survey are analysed. The paper
concludes with the limitations of the survey and the
suggestions for future work.
ICE-B 2008 - International Conference on e-Business
132
2 CONCEPTUAL MODEL OF
MOBILE SERVICE ADOPTION
In our study, we developed a modified version of the
Technology Acceptance Model (TAM) (Davis,
1989) and the Theory of Planned Behaviour (TPB)
(Ajzen, 1991) for researching the adoption of mobile
services. According to TAM, a consumer’s
behavioural intention to use a “system” is
determined primarily by its usefulness and ease of
use. In TPB, the intention to use a “system” is
explained by attitudes toward a certain behaviour,
subjective norm and perceived behavioural control.
TAM and TPB have both been widely used among
researchers and found to be very useful in explaining
consumers’ attitudes and intentions toward a given
behaviour. TPB is a general theory of human
behaviour while TAM is specific to information
systems.
Studies on acceptance of new technology
indicate that traditional adoption models need to be
extended and modified to better explain the adoption
of the innovations. This study modifies TAM by
proposing additional acceptance factors associated
with mobile services, Rogers (1995) and Figge
(2004) having especially influence on the creation of
construct items stated in Figure 1. Attitudinal
construct was adopted from TPB (e.g. Karjaluoto
and Alatalo, 2007). Mobile service adoption model
was decided to be based on utilitarian-oriented
aspects. Thus, the pure entertainment factors, such
as perceived enjoyment and playfulness were not
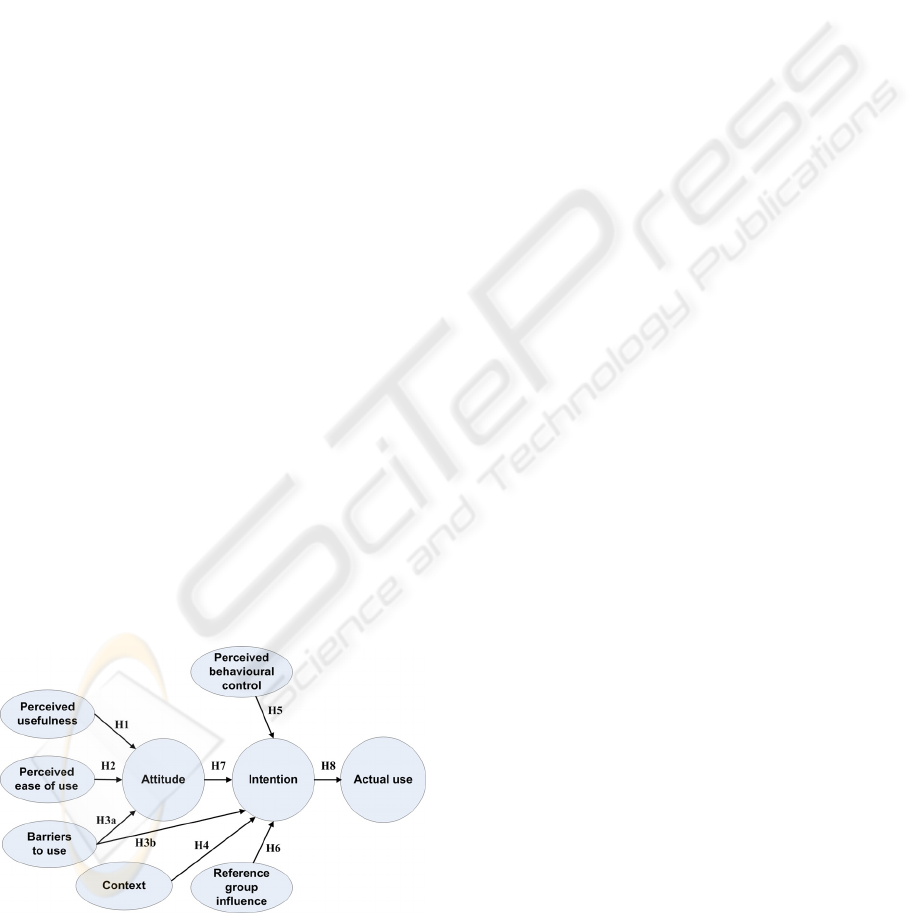
included as construct items. Figure 1 shows the
created conceptual model for case mobile service
with causal links between the construct items
(Ervasti, 2007).
Figure 1: Conceptual model for mobile services.
Perceived usefulness (PU), perceived ease of use
(PEOU) and barriers to use (BU) are posited as
antecedents of attitude (ATT) toward mobile
services. Barriers to use are also conceptualised with
context (CON) as an antecedent of intention (INT)
to use mobile services. Perceived behavioural
control (PBC), reference group influence (REF) and
attitude are antecedents of intention, which, in turn,
affects actual use (USE). (Fishbein and Ajzen, 1975;
Davis, 1989; Ajzen, 1991; Moore and Benbasat,
1991; Thompson et al. 1991; Davis et al., 1992;
Taylor and Todd, 1995; Venkatesh and Davis,
2000).
Based on the conceptual model in Figure 1, the
following hypotheses for mobile services were
created:
H1: Perceived usefulness of mobile services
positively affects attitude toward mobile services.
H2: Perceived ease of use of mobile services
positively affects attitude.
H3a: Perceived barriers to use mobile services
negatively affect attitude.
H3b: Perceived barriers to use mobile services
negatively affect intention to use mobile services.
H4: Utilisation of context-specific information
on mobile services positively affects intention.
H5: Perceived behavioural control of mobile
services positively affects intention.
H6: Reference group influence positively affects
intention.
H7: Positive attitude toward mobile services
positively affects intention to use mobile services.
H8: Intention to use mobile services is positively
associated with actual use of mobile services.
In order to further evaluate and develop the
conceptual model with related hypotheses, the use
and adoption were tested in a real-life case study of
mobile service.
3 THE EVALUATION OF CASE
MOBILE SERVICE
The practical evaluation of the mobile service
adoption was made in the case study, named Mora.
The case mobile service focused on additional value
of mobility, which means the possibility to access,
produce and send information, products and services
at anytime and from anywhere, regardless of the
user’s location or the time of day. The major aim of
the mobile service was to provide essential
information for the end-users as the administration
of the campus area defined. Mora service was
ADOPTION OF MOBILE SERVICES IN FINLAND - Conceptual Model and Application-based Case Study
133
evaluated in a delimited user group of students and
personnel in Finnish campus area. Mora was
launched at the campus, focused on technology and
economics education, in Finland in September 2007,
in order to research the adoption of mobile services
among campus’ students and personnel.
The technical implementation of the case mobile
service is based on a client-server approach to
providing a mobile access to intranet of campus
area. The contents of Mora were internal news,
events, announcements and schedules of the study
community, as well as a mobile flea market. Mobile
flea market enabled users to sell and buy things such
as studying material easily and quickly. In later
development the mobile service could also provide
pleasure, fun, and enjoyment. The mobile client
Mora works as an interaction channel between
customer and service provider by providing
personalised information to the user (Ervasti, 2007).
The server side application carries most of the
functionality. The client side of Mora is Java mobile
application (J2ME) that works in most common
mobile phones.
The main technical building blocks of a
personalised mobile service concept are the service
provider’s existing information systems, mobile
service, customer database and mobile application.
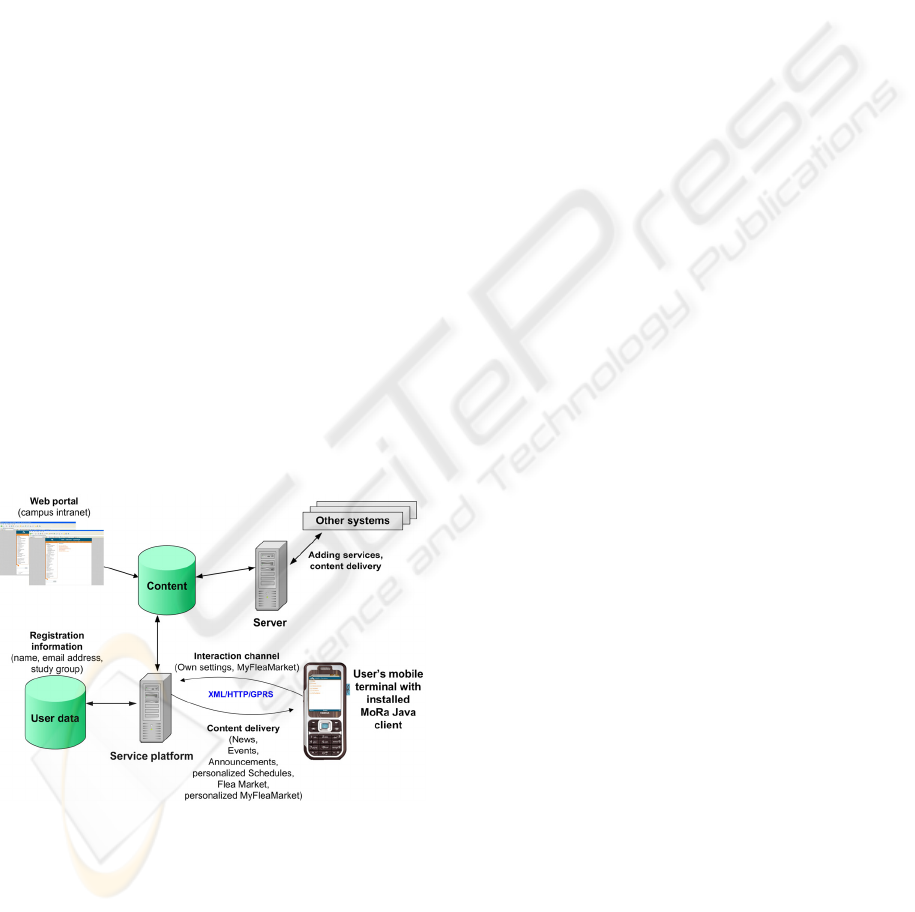
The main building blocks (adapted from Alahuhta et
al., 2005) of the Mora service concept are introduced
in Figure 2:
Figure 2: Overview of the Mora mobile service.
The major source of information for most of the
data and communication processed in the Mora
service is the existing information system, the
campus’ web intranet. This required adaptation of
the content from web-based content to mobile
content. The user database is utilised for providing
personalised services for customers. The existing
database is used as the basic information source for
user-related information (name, email address, study
group), besides the basic personal data the database
could be contain more detailed information on
customer’s special preferences. The mobile end of
the concept utilised mobile Java technologies. The
concept approach of using mobile application has
several benefits both for the end user and the service
provider. Java application provides versatile content
delivery and interaction channel, a service provider
can create a fully branded mobile service concept
and the application is unobtrusive and convenient to
use, avoiding the spam effect. When compared to
browsing, the application-based approach offers
better possibilities for improving usability in mobile
services. In addition, the optimisation of data traffic
between the terminal and servers is easier to
implement in mobile applications. The small size of
the displays also favours application-type services.
The case mobile service started with an
information and marketing campaign advertising
Mora web pages and giving presentations about the
field trial to various student groups and personnel in
the campus area. The purpose was to make the test-
users feel they were privileged to have the mobile
service like Mora exclusively on their campus, and
have the opportunity to participate in the service
testing and development. These initial Mora users
were encouraged to compete for the best
development ideas. In the adoption of application-
based mobile services, the key barrier to overcome is
to get the users to do the first download (Nokia,
2003). Therefore, Mora instructions presented
simple steps for starting the use of Mora as follows:
1) Registration via web page; 2) Downloading the
Mora mobile application via SMS or web page; 3)
Setting up the required connection settings; 4)
Setting up the mobile client preferences.
The test-users were able to post questions for us
during the whole field trial and separate events for
getting help in downloading and installing the
application were arranged to further ease the
adoption process. Users had also an opportunity to
test the Mora service with separate test phones in
case a user’s own mobile phone didn’t support the
application. The nature of the marketing campaign
was selected due to the time and costs limitations. In
future research the diffusion of mobile services by
viral marketing should also be considered and
researched.
ICE-B 2008 - International Conference on e-Business
134
4 FEEDBACK QUESTIONNAIRE
AND ANALYSIS OF THE MORA
MOBILE SERVICE
The feedback from the Mora mobile service was
collected after two months’ field trial through online
and paper questionnaires. The feedback
questionnaire was created based on the hypotheses
in conceptual model (Figure 1). All of the
questionnaire’s construct items consist of multiple
variables, and a five-point Likert scale ranging from
1 (strongly disagree) to 5 (strongly agree), with 3
(cannot determine) as a neutral anchor point was
used to measure the variables. In Table 1 is
presented the feedback questionnaire for the case
study (adapted from Venkatesh et al., 2003).
During the field trial, the Mora mobile service
gathered 67 registered users and the survey resulted
in 52 completed feedback forms. The results were
treated and analysed anonymously (Ervasti, 2007).
The analysis of the research data was done by using
SPSS 14.0 software. A small number of
questionnaire forms were incompletely filled in and
the answers were ambiguous in some places. The
ambiguity was resolved by interpreting the answer in
the least favourable way for the question presented.
The rather small amount of sample data restricted
the number of feasible analysis methods. The
analysis was conducted using the basic frequency
and descriptive calculations. The regression analysis
was utilised by first examining the effect of the
independent variables on the dependent variables
according to the set hypotheses, and then testing the
combined effect of the explanatory variables as
stated in the conceptual model.
Of the respondents, 11.5% were female and
88.5% male and the majority were less than 25 years
old. By nationality, 69.2% of the sample were
Finnish and 30.8% foreign; the foreign respondents’
nationalities mostly representing Nigeria, Russia and
Hungary. Most of the survey respondents had a
monthly income of less than 1,000 euros and a
relatively new mobile phone in use, the handset’s
age being under two years for the majority. The
sample’s monthly mobile phone expenditure was
mainly under 30 euros, and most used their phone
more for private than business purposes.
The survey respondents’ attitudinal valuations of
the Mora mobile service are presented in Table 1
with mean values and standard deviations. In
perceived usefulness, the respondents mostly agreed
with the statement “Using Mora gives me topical
information”. In perceived ease of use, most agreed
with the statement “I quickly learned to use Mora”,
and they were also aware of the kind of mobile
services they can use with their mobile phones. Most
users agreed with the statement that Mora
downloading and installation was easy. Users
disagreed with the statements concerning perceived
barriers to use. Fear of technical features, required
effort in downloading and installing the application,
or even the data transmission billing weren’t seen as
obstacles in adopting mobile services. The utilisation
of time and date-related contextual information in
Mora services was seen as more useful than the
utilisation of location-specific information. The
respondents weren’t especially eager to spend time
providing their personal details to make the content
in Mora more relevant to their needs.
When examining the perceived behavioural
control, the respondents found it important that they
could control the use of Mora by deciding when and
where to use the service. The reference group
influence was perceived as rather irrelevant in this
survey. The attitudinal construct showed that the
respondents had a more preferable attitude toward
downloadable applications than toward SMS-based
mobile services. Most agreed with the statement
“Using the mobile phone as a channel to access the
content of school intra is a good idea”. The
respondents reported that they were willing to use
Table 1: Feedback questionnaire items and attitudinal dimensions of test-user responses to Mora mobile service.
Construct item Variable Mean s.d.
Perceived usefulness
PU1 Using Mora gives me topical information. 4.29 0.610
PU2 Using Mora saves me time / helps me accomplish things more
quickly.
3.77 1.022
PU3 Using Mora gives me personal information. 3.39 1.150
PU4 Using Mora gives me information that is of interest to me. 3.81 0.817
PU5 I find Mora useful in my daily life 3.90 1.053
Perceived ease of use
PEOU1 I know what kind of mobile services I can use with my phone. 4.14 1.167
ADOPTION OF MOBILE SERVICES IN FINLAND - Conceptual Model and Application-based Case Study
135

Table 1: Feedback questionnaire items and attitudinal dimensions of test-user responses to Mora mobile service (cont.).
PEOU2 It was easy for me to download and install Mora in my mobile
phone.
3.88 1.211
PEOU3 I quickly learned to use Mora. 4.62 0.718
PEOU4 I find Mora easy to use. 4.33 0.964
PEOU5 My interaction with Mora is clear and understandable. 4.00 1.085
PEOU6 I find it easy to get Mora to do what I want to do. 3.92 1.100
Barriers to use
BU1 Fear of technical features is an obstacle to me adopting mobile
services.
1.63 1.085
BU2 Difficulty and effort caused by the downloading and installation of
the application in a mobile phone is an obstacle to me adopting
mobile services.
1.76 1.205
BU3 Knowledge of data transmission billing is an obstacle to me
adopting mobile services.
2.51 1.528
Context
CON1 I would view the content of Mora related to a specific time or date
(e.g. exam day, weekend) as useful.
4,39 0.750
CON2 I would view the content of Mora related to me being in a specific
location (e.g. campus restaurant, library) as useful.
4.10 0.953
CON3 I would be prepared to spend time providing my personal details (a
user profile) to make the content of Mora more relevant to my
needs.
3.78 1.112
Perceived behavioural control
PBC1 I find it important that I can choose between different styles in
Mora.
3.17 1.354
PBC2 I find it important that I can easily control the use of Mora (that I
can decide when and where I use Mora).
4.50 0.828
PBC3 I find it important that I can easily stop using Mora. 4.44 0.978
PBC4 It would be important for me to be in control in terms of the ability
to filter the content of Mora related to my interests/needs.
4.19 0.793
Reference group influence
REF1 I started to use Mora because it was recommended to me by
someone I know.
2.71 1.576
REF2 I started to use Mora because my friends are using it. 2.12 1.199
REF3 I would have been more likely to start to use Mora if the message
containing a link for downloading the application was forwarded to
me by someone I know.
2.83 1.424
REF4 I recommended Mora to people I know. 3.49 1.271
Attitude
ATT1 Using mobile services (downloadable applications) is pleasant. 3.90 1.159
ATT2 Using Mora is pleasant. 4.08 0.710
ATT3 Using mobile services (SMS-based) is pleasant. 3.38 1.223
ATT4 Using mobile technology to access a variety of services is
interesting.
4.31 0.707
ATT5 Using the mobile phone as a channel to access the content of the
university intranet is a good idea.
4.73 0.528
Intention
INT1 I feel positively about Mora. 4.54 0.503
INT2 I am willing to use Mora in the future, if possible. 4.48 0.641
INT3 I would use Mora regularly in the future. 4.02 1.038
Actual use
USE1 I am using Mora every day. 2.58 1.226
USE2 I am using Mora every week. 3.71 1.226
USE3 I regularly check what’s new with Mora. 3.40 1.302
ICE-B 2008 - International Conference on e-Business
136
Mora in the future. However, the actual use of Mora
wasn’t that regular since it happened more on a
weekly than daily basis.
71.2% of respondents reported having used other
mobile services in addition to Mora and 67.3% of
them had used downloadable applications, whereas
only 38.5% SMS-based services. 57.7% of
respondents reported having used entertainment
services, and 55.8% had used both the information
and news services and email; 38.5% had used instant
messaging, and 23% banking and financial services.
17.3% of respondents had experience of VoIP,
11.5% of ticket reservation, 7.7% of shopping, and
5.8% of travel booking.
Table 2 shows the standardised coefficients and
t-values of the tested hypotheses regarding mobile
services (t-statistics indicating the significance of
individual variables when the t-value is > 2
(Schwager, 1995).
Table 2: Hypotheses examination.
Hypothesis Standardized
Coefficient β
t-
value
Sig.
H1: PU to ATT .419 3.164 .003
H2: PEOU to ATT .303 2.182 .034
H3a: BU to ATT -.173 -1.205 .234
H3b: BU to INT -.050 -0.345 .731
H4: CON to INT .539 4.430 .000
H5: PBC to INT .250 1.828 .073
H6: REF to INT .237 1.707 .094
H7: ATT to INT .572 4.882 .000
H8: INT to USE .381 2.913 .005
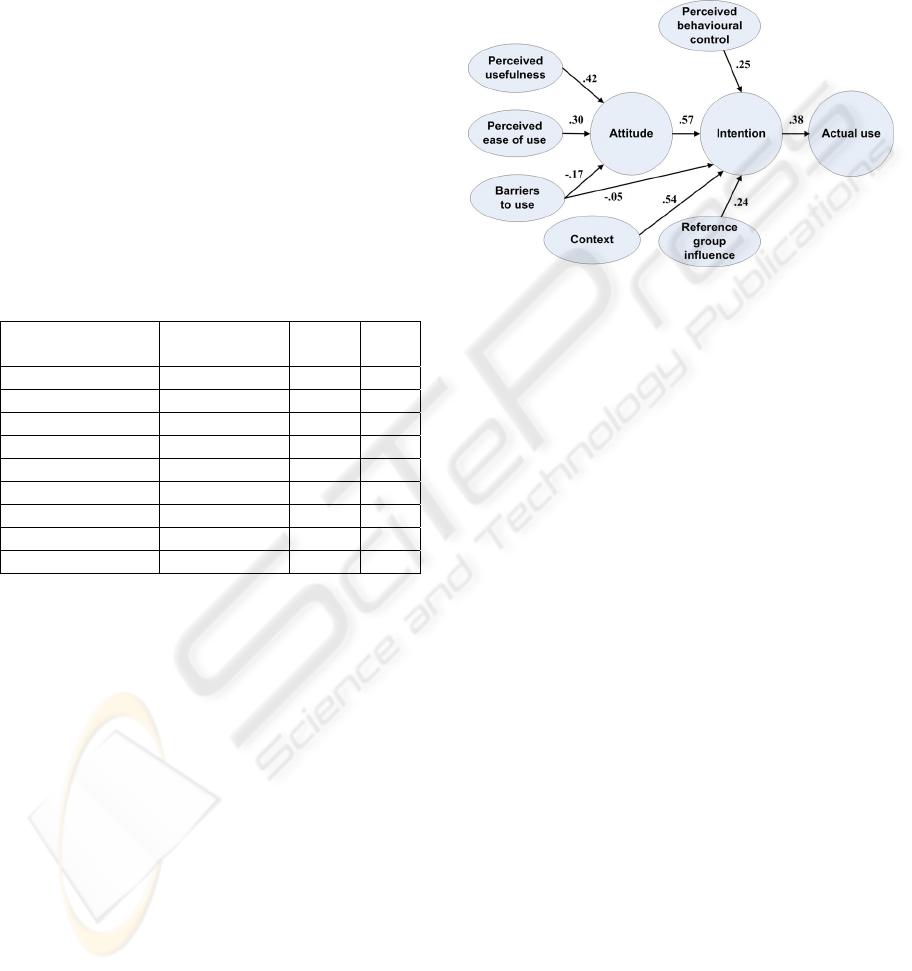
The strong coefficient of H1 shows that there is a
positive and direct relationship between PU and
ATT. Thus, the perceived usefulness of mobile
services is a strong predictor of attitude and H1 was
supported. It can also be seen that the PEOU of
mobile services was directly and positively
associated with ATT, providing support for H2. H3a
and H3b address the role of BU, the coefficients
were negative, but very low, which indicates that
barriers to use have no significant influence on
either attitude or intention, thus H3a and H3b were
not supported. Next, the strong coefficient of H4
indicates that context-related information acts as a
strong and positive predictor of intention to use
mobile services, so H4 was supported. H5 and H6
hypothesise that PBC and REF have a positive and
direct relationship with INT. Both coefficients are
similar with low magnitudes, therefore neither H5
nor H6 were supported by the data. H7 states that the
more favourable attitude a person forms toward
mobile services, the higher his or her intention to use
those services. The relationship was found to be
positive and statistically significant. The final
hypothesis, H8, argues that INT is directly
associated with USE, and the coefficient is strong
and positive. Thus both H7 and H8 were supported.
Figure 3 illustrates the standardised coefficients
for the conceptual model.
Figure 3: Conceptual model results.
During the field trial it was noticed that mobility
does not provide enough added value for the users
when the Mora service is in its current form.
Consumers were not attracted to the service because
they already had an easy and familiar way to access
almost the same content via the web, so they felt that
the Mora is just a mobile substitute for the campus’
web intranet. Even though the challenges with
marketing the Mora service and establishing test-
users’ interest were recognised and actions were
taken to overcome them, one reason for the
somewhat modest use of the Mora service was that
the benefits of the service weren’t enough visible to
potential adopters. For Mora service users, the
easiness and flexibility of the service should have
been stressed even more, i.e. that service can be used
at any time and in any place, freeing the users from
the traditional time and place constraints even more
efficiently than Internet services. Another significant
obstacle was the effort required in downloading and
installing the application. To diminish this problem
several separate events were arranged where
guidance and support in service adoption was
offered to users.
5 CONCLUSIONS
This paper introduces a conceptual model for mobile
service adoption that is a modified version of
established adoption models. The developed
conceptual model was evaluated and validated in the
ADOPTION OF MOBILE SERVICES IN FINLAND - Conceptual Model and Application-based Case Study
137

real-life case study of mobile service, through which
we have gained practical insights into application-
based mobile service development and promotion, as
well as having identified the factors affecting the
adoption of mobile services in Finland.
The findings from the survey suggest that
perceived usefulness of mobile services is the
strongest predictor of attitude toward mobile
services. That is also supported by previous studies
(e.g. Rogers, 1995) on consumer acceptance of new
technologies. People will adopt a technology when
the added value offered by technology fulfils their
needs. Hence, compatibility with users’ needs (ibid)
is a critical variable for predicting technology
adoption. Ease of use wasn’t perceived as having a
strong relationship with acceptance of mobile
services, contrary to (ibid), so it can be reasoned that
usefulness is a stronger determinant of attitude
toward mobile services than perceived ease of use.
Utilisation of contextual information was found to
have a strong impact on intention to use mobile
services and proves that consumers desire relevant
and personalised services.
The respondents did not perceive the technical
features of mobile services, the downloading and
installation process or data transmission billing as
significant barriers to adopting mobile services as
prior researches suggest (Aarnio et al., 2002; Nokia,
2003). When examining the impact of control and
social norms, the results of the survey were not
congruent with the theoretical background (Ajzen,
1991; Rogers, 1995) either, since perceived
behavioural control and reference group influence
weren’t stated as important determinants of service
adoption. A preferable attitude toward mobile
services was however proved to have a strong
impact on intention to adopt services, whereas the
intention in the end didn’t act as a good predictor of
actual use.
Based on the case study findings, it is suggested
that the extended and modified conceptual model
can be used to guide industry players’ evaluation of
the adoption potential of new mobile services. Case
study results can be used to help mobile service
providers choose right development and marketing
strategies for mobile services and accelerate the
diffusion of services. However, further and more
extensive studies should be conducted in order to
attain a more profound understanding of the issues
concerning consumers’ drivers for adopting (or
rejecting) mobile services. Similar research need to
be done in other countries as well in order to obtain
benchmarks for comparing the differences in
adoption characteristics in different countries, and to
further validate the conceptual model. In an
international comparison, Finland is an advanced
information society especially when it comes to
mobile communication. Thus, the study findings
might vary in other countries with far lower mobile
phone penetration rates and different mobile
communication culture. However, when compared
to Japan, Finland is far behind in the versatility of
mobile communication: in Japan, a nation of 127
million the number of mobile internet subscribers
recently passed 100 million (The Guardian, 2007).
The conceptual model should also be extended
further to include more factors that reflect the unique
characteristics of the usage intentions of mobile
services. Further attention should be devoted to the
comparison of rival models in explaining consumer
attitudes and intentions.
REFERENCES
Aarnio, A., Enkenberg, A., Heikkilä, J., Hirvola, S., 2002.
Adoption and Use of Mobile Services: Empirical
Evidence from a Finnish Survey. In Proceedings of the
35th Hawaii International Conference on System
Sciences, 3(35), pp. 1454-1463. IEEE Computer
Society.
Ajzen, I., 1991. The theory of planned behaviour.
Organisational Behavior and Human Decision
Processes, 50(2), pp. 179-211. Elsevier.
Alahuhta, P., Helaakoski, H., Smirnov, A., 2005.
Adoption of Mobile Services in mCommerce –
Technologies and Success Factors. In IEEE ICEBE
2005, pp. 531-534.
Anckar, B., 2002. Motivators for Adoption of Mobile
Commerce: Findings from a National Consumer
Survey. In Proceedings of the International
Conference on Decision Making and Decision Support
in the Internet Age (DSIage 2002), pp. 749-762.
Bouwman, H., Carlsson, C., Molina-Castillo, F.J.,
Walden, P., 2007. Barriers and drivers in the adoption
of current and future mobile services in Finland.
Telematics and Informatics, 24(2), pp. 145–160.
Elsevier.
Cheong, J.H., Park, M., 2005. Mobile internet acceptance
in Korea. Internet Research, 15(2), pp. 125-140.
Emerald Group Publishing Limited.
Davis, F.D., 1989. Perceived Usefulness, Perceived Ease
of Use, and User Acceptance of Information
Technology. MIS Quarterly, 13(3), pp. 319-340.
Management Information Systems Research Center,
University of Minnesota.
Davis, F.D., Bagozzi, R.P., Warshaw, P.R., 1992.
Extrinsic and Intrinsic Motivation to Use Computers
in the Workplace. Journal of Applied Social
Psychology, 22(14), pp. 1111-1132. Blackwell
Publishing.
ICE-B 2008 - International Conference on e-Business
138

Ervasti, M.A., 2007. The Development of Mobile Service
Concepts – Technologies, Adoption and Use,
University of Oulu, Department of Electrical and
Information Engineering. Master’s Thesis, Finland.
Figge, S., 2004. Situation-dependent services – a
challenge for mobile network operators. Journal of
Business Research, 57(12), pp. 1416-1422. Elsevier.
Fishbein, M., Ajzen, I., 1975. Belief, Attitude, Intention
and Behavior: An Introduction to Theory and
Research, Addison-Wesley. Reading, MA.
Gilbert, A.L., Han, H., 2005. Understanding mobile data
services adoption: Demography, attitudes or needs?
Technological Forecasting & Social Change, 72(3),
pp. 327-337. Elsevier.
Gillick, K., Vanderhoof, R., 2000. Mobile E-commerce:
Marketplace Enablers and Inhibitors. In Smart Card
Forum Annual Meeting, 23 p.
The Guardian, 2007. Why mobile Japan leads the world.
Accessed 03.06.2008. URL:
http://www.guardian.co.uk/technology/2007/sep/27/gu
ardianweeklytechnologysection.mobilephones
Hyvönen, K., Repo, P., 2005. Mobiilipalvelut
suomalaisten arjessa (Mobile services in the every day
life of Finns). In Vox consumptoris – Kuluttajan ääni,
pp. 41-59. National Consumer Research Centre,
Helsinki. (In Finnish)
Invest in Finland, 2008. Top 56 mobile phones in Finland
were all made by Nokia. Accessed 03.06.2008. URL:
http://www.investinfinland.fi/news/2008/en_GB/nokia
/
It-viikko, 2007. Every fourth Finn surfs on their mobile
phone (In Finnish). Accessed 03.06.2008. URL:
http://www.itviikko.fi/talous/2007/01/23/neljannes-
suomalaisista-surffaa-kannykalla/20071827/7
Kaasinen, E., 2005. User acceptance of mobile services –
value, ease of use, trust and ease of adoption, VTT
Publications 2005. Espoo.
Karjaluoto, H., Alatalo, T., 2007. Consumers’ attitudes
towards and intention to participate in mobile
marketing. International Journal of Services
Technology and Management, 8(2/3), pp. 155-173.
Inderscience.
Moore, G.A., McKenna, R., 1999. Crossing the Chasm:
Marketing and Selling High-Tech Products to
Mainstream Customers, Harper Business. New York.
Moore, G.C., Benbasat, I., 1991. Development of an
Instrument to Measure the Perceptions of Adopting an
Information Technology Innovation. Information
Systems Research, 2(3), pp. 192-222. INFORMS.
Muller-Veerse, F., 2000. Mobile Commerce Report,
Durlacher Research Ltd. London.
Nokia, 2003. Java™ technology enables exciting
downloading services for mobile users. In White
paper. Nokia Corporation, Finland.
Rogers, E.M., 1995. Diffusion of innovations, Free Press.
New York, 4th edition.
Schwager, J.D., 1995. Fundamental Analysis, John Wiley
and Sons. United States.
Statistics Finland, 2007. From hand-cranked connections
to hands-free mobile calls – history of
telecommunications in Finland seen through statistics.
Accessed 03.06.2008. URL:
http://www.stat.fi/tup/suomi90/syyskuu_en.html
Taylor, S., Todd, P.A., 1995. Assessing IT Usage: The
Role of Prior Experience. MIS Quarterly, 19(2), pp.
561-570. Management Information Systems Research
Center, University of Minnesota.
Thompson, R.L., Higgins, C.A., Howell, J.M., 1991.
Personal Computing: Toward a Conceptual Model of
Utilization. MIS Quarterly, 15(1), pp. 124-143.
Management Information Systems Research Center,
University of Minnesota.
Venkatesh, V., Davis, F.D., 2000. A Theoretical Extension
of the Technology Acceptance Model: Four
Longitudinal Field Studies. Management Science,
46(2), pp. 186-204. INFORMS.
Venkatesh, V., Morris, M.G., Davis, G.B., Davis, F.D.,
2003. User Acceptance of Information Technology:
Toward a Unified View. MIS Quarterly, 27(3), pp.
425-478. Management Information Systems Research
Center, University of Minnesota
ADOPTION OF MOBILE SERVICES IN FINLAND - Conceptual Model and Application-based Case Study
139
