
DETECTION OF THE CRITICAL POINT INTERVAL OF
POSTURAL CONTROL STRATEGY USING WAVELET
TRANSFORM ANALYSIS
Neeraj Kumar Singh, Hichem Snoussi, David J. Hewson and Jacques Duchêne
Institut Charles Delaunay, FRE CNRS 2848, Université de Technologie de Troyes
12 rue Marie Curie, BP2060, 10010 Troyes, France
Keywords: Stabilogram, Centre of Pressure, Postural Control, Wavelet Transform Analysis.
Abstract: Postural balance is often studied in order to understand the effect of sensory degradation with age. The aim
of this study was to develop a new method of detecting the critical point interval (CPI) at which sensory
feedback is used as part of a closed-loop postural control strategy. Postural balance was evaluated using
centre of pressure (COP) displacements measured using a force plate for 17 control subjects and 10 elderly
subjects under control (eyes open) and experimental (eyes closed, vibration) conditions. A modified local-
maximum-modulus wavelet transform analysis using the power spectrum of COP signals was used to
calculate the critical point when closed-loop control occurs. Lower values of CPI are associated with
increased closed-loop postural control, indicating a quicker response to sensory input. This strategy of
postural control will require greater energy expenditure due to the repeated muscular interventions in order
to remain stable. The CPI for elderly subjects occurred significantly quicker than for control subjects,
indicating that posture was more closely controlled. Similar results were observed for eyes closed and
vibration conditions. The CPI parameter offers a new method of detecting differences in postural control
between different experimental conditions or changes due to ageing.
1 INTRODUCTION
Balance is regularly studied in order to better
understand postural control mechanisms. One reason
for the interest in balance is its relationship with
falls, which are a major problem in the elderly.
Indeed, a problem with balance is one of the most
commonly-cited risk factors for falls (Rubenstein
and Josephson, 2002). Balance is maintained using
the visual, vestibular, and proprioceptive systems.
Postural degradations occur with age, and can
also be artificially created by impairing one of the
sensory systems, for instance by closing a subject’s
eyes. The proprioceptive system can also be
impaired by applying vibration to the tibialis anterior
tendon when subjects are in a static upright position,
which creates an illusion of body inclination, thus
decreasing postural stability and increasing postural
sway (Roll and Vedel, 1982).
Balance can be measured either clinically, or
biomechanically, for which force-plate analysis is
often used. A range of different parameters can be
extracted from the centre of pressure (COP) obtained
from the force plate, including temporal and spectral
parameters, as well as those related to the
organisation of the trajectory of the COP. Pioneering
work in this area was performed by Collins and De
Luca (Collins and De Luca, 1994), who
hypothesised that upright stance was controlled by
open-loop and closed-loop strategies, which
correspond to posture control strategies without and
with sensory input, respectively. In the case of an
open-loop control, sensory feedback is not used,
whereas closed-loop control uses feedback from the
proprioceptive, vestibular, or visual systems to
maintain an upright stance. Collins and De Luca
identified the critical point at which open-loop and
closed-loop control strategies diverged, and
proposed a method by which this time could be
calculated (Collins and De Luca, 1994). Although
the proposed method is based on posture control
strategies, the method used to calculate the critical
time interval makes assumptions that the two points
used to fit the regression lines to the data occur
101
Singh N., Snoussi H., Hewson D. and Duchêne J. (2009).
DETECTION OF THE CRITICAL POINT INTERVAL OF POSTURAL CONTROL STRATEGY USING WAVELET TRANSFORM ANALYSIS.
In Proceedings of the International Conference on Bio-inspired Systems and Signal Processing, pages 101-106
DOI: 10.5220/0001541701010106
Copyright
c
SciTePress

between one second and 2.5 seconds (Collins and De
Luca, 1994).
The present paper describes a new method that
can be used to calculate the time at which a change
is made between open and closed loop control
strategies. The proposed method, based on wavelet
analysis will be used to calculate the critical point
interval of the COP signal for elderly and control
subjects, as well as for eyes closed and vibration
conditions.
2 METHODS
2.1 Subjects
Seventeen healthy control subjects and ten healthy
elderly subjects (4 males and 6 females) participated
in the study. Control subjects’ mean age, height and
weight were 33.3 ± 7.4y, 168.0 ± 6.5cm, and 65.7 ±
17.6kg, respectively. Elderly subjects’ mean age,
height and weight were 80.5 ± 4.7y, 165.6 ± 7.0cm,
and 71.9 ± 9.9kg, respectively. All subjects who
participated gave their written informed consent. No
subjects reported any previous musculoskeletal
dysfunction.
2.2 Centre of Pressure Data
Centre of pressure data were recorded using a Bertec
4060-08 force plate (Bertec Corporation, Columbus,
OH, USA), which amplifies, filters, and digitises the
raw signals from the strain gauge amplifiers inside
the force plate. The resulting output is a six-channel
16-bit digital signal containing the forces and
moments in the x, y, and z axes. The digital signals
were subsequently converted via an external
analogue amplifier (AM6501, Bertec Corporation).
The coordinates of the COP signals can be
calculated as follows:
z
y
F
M
APX ==
;
z
x
F
M
MLY ==
(1)
The initial COP signals were calculated with
respect to the centre of the force-plate before
normalisation by subtraction of the mean.
2.3 Data Acquisition and Processing
Data were recorded using the ProTags™ software
package (Jean-Yves Hogrel, Institut de Myologie,
Paris, France) developed in Labview® (National
Instruments Corporation, Austin TX, USA). Data
were sampled at 100 Hz, with an 8th-order low-pass
Butterworth filter with a cut-off frequency of 10 Hz.
All calculations of COP data were performed with
Matlab® (Mathworks Inc, Natick, MA, USA).
2.4 Experimental Protocol
Subjects were tested using two experimental
protocols with a Bertec 4060-80 force plate (Bertec
Corporation, Colombus, OH, USA). Elderly subjects
were tested with their eyes open, while control
subjects were tested with their eyes open, their eyes
closed, as well as with vibration (eyes closed).
For the vibration condition, vibration was
applied bilaterally using the VB115 vibrator
(Techno Concept, Cereste, France) to the tibialis
anterior tendon for 10 s at 50, 70, and 90 Hz.
Immediately after vibration, subjects were instructed
to step onto the force plate, in order to ensure
subjects were subjected to the post-vibratory
response.
After 12 s standing on the force plate, a second
verbal command was given for subjects to step down
backwards. Subjects remained as still as possible
with their arms placed at their sides throughout the
protocol, while no constraint was given over foot
position, with subjects tested barefoot.
Measurements were repeated five times for each
experimental condition, with 30 s between each test.
2.5 Identifying the Critical Point using
Wavelet Transform Analysis
2.5.1 Locating the Critical Point
The critical point is defined as the point at which
sway is controlled by the closed-loop (feedback)
system. When postural control changes from open-
loop to closed-loop, a local maximum should be
observable in the COP. When upright stance is under
open-loop control, sway moves toward a certain
direction reaching a local maximum, at which point
commands from the closed-loop system pull sway
away from the local maximum back to the
equilibrium position (Figure 1).
It has been shown that local maximum modulus
wavelet transform analysis is well-suited to the
detection of local maxima (Mallat and Hwang,
1992). The method used in the present study differs
only in that the power spectrum is used rather than
the modulus, as the power spectrum represents the
energy in sway.
BIOSIGNALS 2009 - International Conference on Bio-inspired Systems and Signal Processing
102
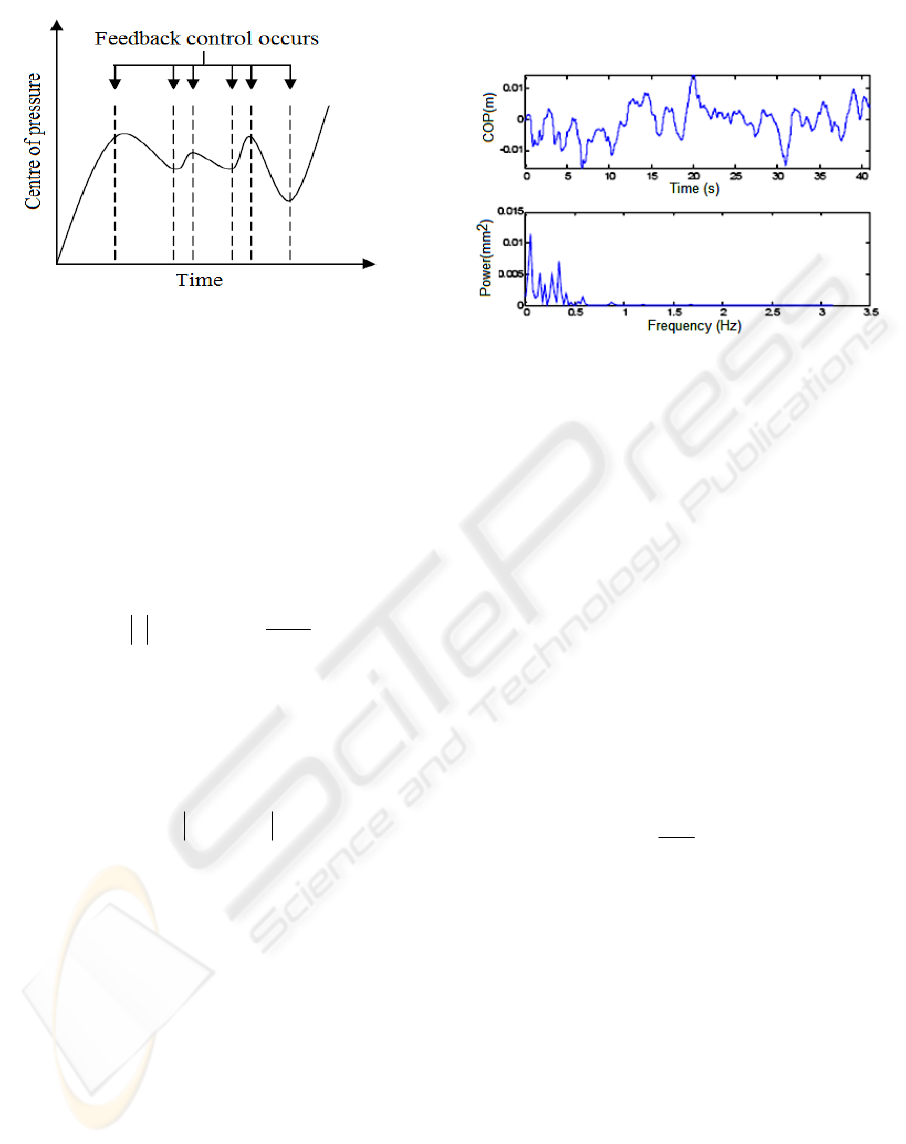
Figure 1: Feedback control and the local maxima of the
centre of pressure signal over time. Data are in arbitrary
units.
2.5.2 Wavelet Function and Frequency
Bands
The wavelet transform method is particularly
suitable for analyzing non-stationary signals in a
multi-scale manner by varying the scale coefficient
that represents frequency.
The wavelet transform formula is:
dt
a
bt
tfabaWT
∫
⎟
⎠
⎞
⎜
⎝
⎛
−
=
−
ϕ
)(),(
2/1
(2)
where b is the translation parameter and a is the
scale (frequency), and WT(a,b) is the wavelet
coefficient.
The power spectrum PS(a,b) is defined as
2
),(),( baWTbaPS =
(3)
The wavelet function
ϕ
(x) should satisfy a
number of constraints, including zero mean and
orthogonality (Muzzy et al., 1991). Some wavelet
functions are known to distort low frequency
components. In order to avoid this problem, Coiflets
wavelet functions were used.
The sway energy of COP signals has been shown
to be concentrated below 2 Hz (Ferdjallah et al.,
1999), with the principal COP energy being
distributed in the range of 0.1-0.5 Hz (Schmuckler,
1997, Loughlin et al., 1996). Preliminary findings
from the present study showed that most of sway
energy was less than 0.5 Hz, as shown in Figure 2.
For the wavelet function
ϕ
(x), scale a determines
the frequency and b determines the translation. In
the present study, a was chosen to force the
frequency of wavelet transformation to the range of
0.1-2.0 Hz.
Figure 2: Sample power spectrum of COP data (AP
direction).
The 0.1-2.0 Hz frequency band can be divided
into sub sections for which different control systems
are thought to be involved. For instance, Diener and
Gagey suggested that the visual system dominates
frequency bands below 0.5 Hz (Diener et al., 1984,
Gagey et al., 1985). In contrast, Thurner and
colleagues reported that the visual system operates
in the range of 0-0.1 Hz, the vestibular system from
0.1-0.5 Hz, somatosensory activity from 0.5-1.0 Hz,
while sway over 1.0 Hz is directly controlled by the
central nervous system (Thurner et al., 2000). Based
on these findings, the frequencies of 0.5-1.0 Hz were
chosen for the present study as the zone in which
proprioceptive input predominates.
The relation between scale and frequency can be
shown as:
Pa
F
F
C
a
.
=
(4)
Where F
c
is the centre frequency, F
a
the
frequency for scale a, and P is the sampling period
(0.01 s).
It is evident that the scale a should be in the
range 0.5-1.0 Hz for the present study, given the use
of proprioceptive perturbations. To this end, a is
transformed using a base-2 logarithm, and thereafter
denoted as the new scale s. The lower and upper
bounds of scale s were chosen as 6.5 and 8,
respectively. This scale range corresponds to the
frequency bands in the range of [0.44, 0.88] Hz.
After determining scale s, translation b, and the
wavelet function, the power spectrum can be
calculated, an example of which is shown in Figure
3.
DETECTION OF THE CRITICAL POINT INTERVAL OF POSTURAL CONTROL STRATEGY USING WAVELET
TRANSFORM ANALYSIS
103
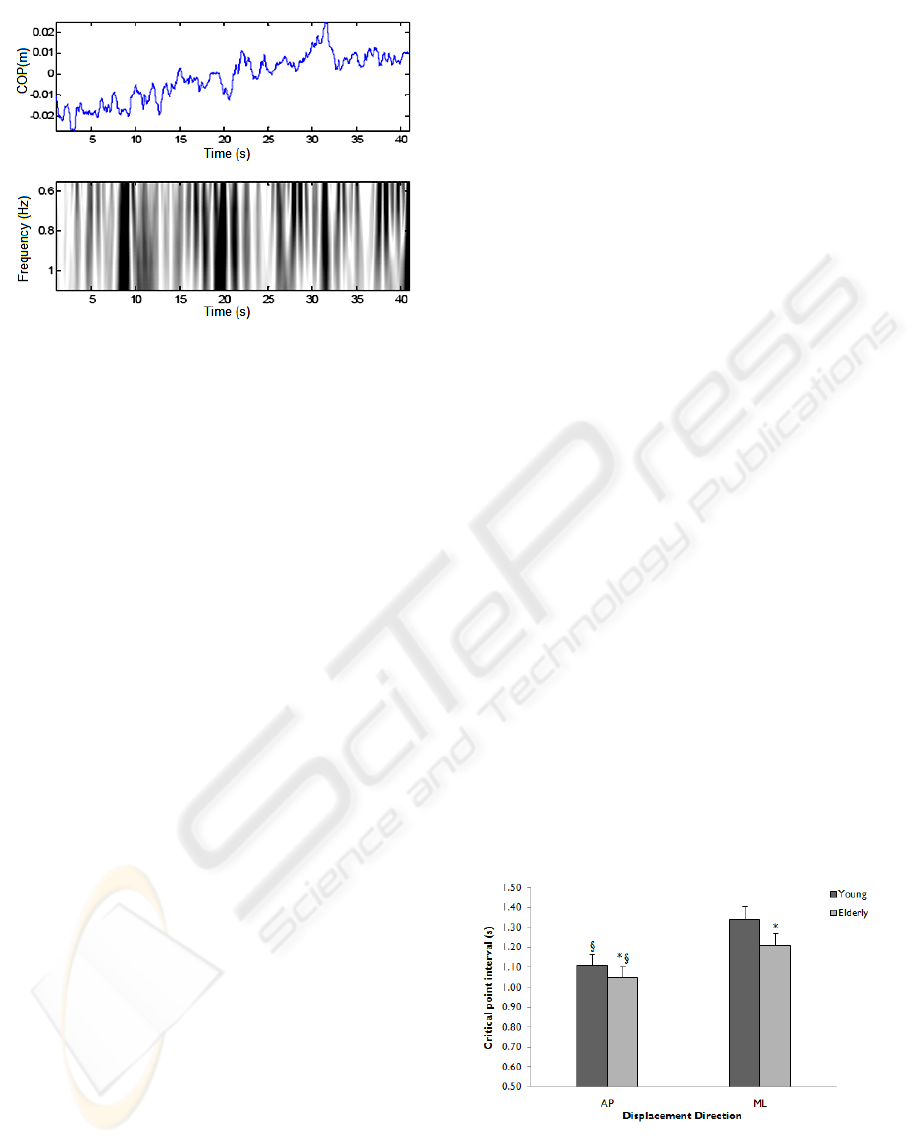
Figure 3: Sample wavelet power spectrum of COP data
(ML direction). Darker and lighter areas represent larger
positive and negative power spectrum values, respectively.
2.5.3 Identifying the Critical Point Time
Interval
Postural control strategies can be changed from
open-loop control to closed-loop in which visual,
vestibular and somatosensory feedbacks can be used.
When feedback control is used, sway moves away
from the local maximum and back to the equilibrium
position. The critical point occurs at scale s and time
t, where the power spectrum is at the local
maximum. It is simply the local maximum of the
power spectrum wavelet transform method (LMPS),
which can be mathematically defined as:
),(),(
0
xsPSxsPS <
(5)
Where x is either the left or right neighbourhood
of x
0
, x
∈
R, and s is scale.
There are numerous local maxima within specific
frequency bands, which indicates that feedback
control has been started at time t and scale s.
Postural control corresponds to the frequency bands
rather than a single frequency, meaning that the
identification of maxima across the frequency range
was required. A local maximum line L
t
can be
defined as the line consisting of the local maxima at
time t across frequency bands from a to b:
}...),,({ bastsPSL
d
t
==
(6)
In the present study, local maxima lines were
identified in the frequency bands [a=0.44, b=0.88]
Hz. It is necessary to search for the local maximum
around time t within a 2Δt interval denoted by [t-Δt,
t+Δt]. If the local maximum line L
t
can be identified
within the time interval [t-Δt, t+Δt], it is concluded
that feedback control has been used at time t. The
time interval Δt used to search for the local
maximum line depends on the specific data. If Δt is
too small then too many local maxima will be
identified. In the present study Δt was chosen as
0.62 s. There are numerous such local maximum
lines for each scale. The mean of the length of these
local maxima lines was calculated and taken to be
the critical point interval (CPI). The average CPI for
all five trials for each subject for each experimental
condition was used for subsequent statistical
analysis.
2.6 Statistical Analysis
All statistical analyses were performed with the
Statistical Package for Social Sciences (SPSS Inc.,
Chicago, IL, USA). Analysis of variance was used to
compare results between conditions, with CPI as the
dependent variable and the experimental condition
as the independent variable. Data were expressed as
means and 95% confidence intervals. Alpha level
was set at p<0.05.
3 RESULTS
The CPI for elderly and control subjects under the
eyes open condition are presented in Figure 4.
Significantly higher values for CPI can be seen for
control subjects than for elderly subjects (p<0.05).
The CPI for AP displacement was significantly
lower than the corresponding value for ML
displacement for both control and elderly subjects
alike (Figure 4; p<0.05).
Figure 4: Critical point interval for elderly subjects and
control subjects in the eyes open condition. Data are
means and 95% confidence intervals. *Significantly
different from control subjects (p<0.05);
§
Significantly
different from ML displacement (p<0.05).
BIOSIGNALS 2009 - International Conference on Bio-inspired Systems and Signal Processing
104
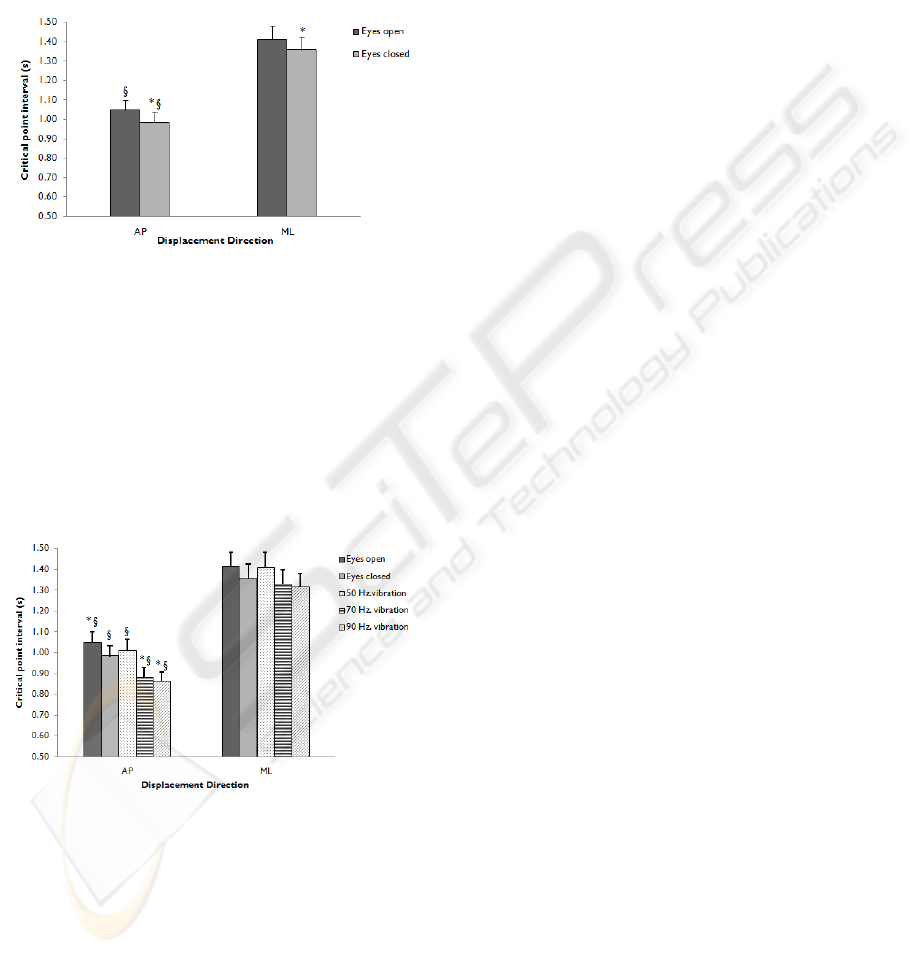
The results for the eyes open and eyes closed
conditions are presented in Figure 5. Significantly
higher values for CPI were observed for the eyes
open condition than for eyes closed (p<0.05).
Significantly lower values of CPI were observed for
AP displacement when compared to ML
displacement for both eyes open and eyes closed
conditions (Figure 5; p<0.05).
Figure 5: Critical point interval for control subjects in the
eyes open and eyes closed conditions. Data are means and
95% confidence intervals. *Significantly different from
eyes open (p<0.05);
§
Significantly different from ML
displacement (p<0.05).
In respect to vibration, there was no significant
difference between conditions for ML displacement
(Figure 6). In contrast, both 70 Hz and 90 Hz
vibrations significantly decreased CPI values in
comparison to the 0 Hz and 50 Hz vibration
condition (Figure 6; p<0.05).
Figure 6: Critical point interval for control subjects in the
eyes open, eye close and vibration condition. Data are
means and 95% confidence intervals. *Significantly
different from eyes closed (p<0.05);
§
Significantly
different from ML displacement (p<0.05).
4 DISCUSSION
Lower values of CPI are associated with increased
closed-loop postural control. In essence, the lower
the CPI value, the quicker the response to sensory
input, and thus the greater reliance on closed-loop
control. Lower values of CPI can therefore be
interpreted as a less efficient open-loop control, thus
requiring an earlier intervention of the closed-loop
system. This strategy of postural control will require
greater energy expenditure due to the repeated
muscular interventions in order to remain stable.
The CPI parameter proposed in the present paper
was able to distinguish between all of the different
experimental conditions tested. In respect to
differences between AP and ML displacements, CPI
values were lower for AP than for ML displacement
for all experimental conditions indicating less
postural stability. This result was expected given
that ML displacement is more stable than AP
displacement due to the anatomy of the ankle and
knee joints, which limit movement in the ML
direction. In addition, subjects’ feet are placed in a
series position for the ML direction, as opposed to
the parallel positioning for AP.
In respect to differences with ageing, elderly
subjects had lower CPI values than control subjects
for both AP and ML displacement. Such results are
indicative of an earlier feedback control for elderly
subject, which is due to a tightly controlled posture
in elderly subjects, as reported previously for other
parameters such as Detrended Fluctuation Analysis
(DFA). In studies of DFA, elderly subjects had less
complex patterns of AP displacement, which is
indicative of a tight postural control used to reduce
displacement as much as possible in order to
maintain a stable posture (Amoud et al., 2007a,
Norris et al., 2005).
The differences observed between eyes open
(EO) and eyes closed (EC) conditions were in
agreement with those between elderly and control
subjects. The CPI values were greater for EO than
for EC for both AP and ML displacements. The lack
of visual information required subjects to tightly
control displacement in both AP and ML directions
using the closed-loop system in order to maintain
equilibrium.
The effect of the vibration applied to the tibialis
anterior tendon is to decrease the stability of the
postural control system by invoking an illusion of
tilt. The vibration required to invoke this effect must
be at least 70 Hz. This effect is only seen in the AP
direction in which the tendinous vibration was
applied.
The results for all experimental comparisons
demonstrate that a decreased ability to maintain
postural stability can be identified by an increased
use of the closed-loop postural control system. Such
DETECTION OF THE CRITICAL POINT INTERVAL OF POSTURAL CONTROL STRATEGY USING WAVELET
TRANSFORM ANALYSIS
105

results might seem contradictory at first, in that both
elderly subjects and subjects with no visual feedback
can tightly control their postural equilibrium.
However, similar results have been reported for
COP signals for a range of parameters such as
entropy and DFA (Amoud et al., 2007b, Norris et
al., 2005, Amoud et al., 2007a), as well as for other
physiological signals such as force production
(Challis, 2006). It has also been suggested that
physiological control processes become less
complex with age as well as when disease is present
(Goldberger et al., 2002).
5 CONCLUSIONS
In conclusion, the CPI parameter offers a new
method of detecting differences in postural control
between different experimental conditions or
changes due to ageing. Lower values of CPI reflect
greater reliance on closed-loop postural control,
which requires greater energy expenditure due to the
repeated muscular interventions in order to remain
stable.
ACKNOWLEDGEMENTS
This study was undertaken as part of the
PARAChute research programme (ANR-05-RNTS-
01801; RNTS-03-B-254; ESF 3/1/3/4/07/3/3/011;
ERDF 2003-2-50-0014 and 2006-2-20-0011; CACR
E200308251).
REFERENCES
Amoud, H., Abadi, M., Hewson, D. J., Michel, V.,
Doussot, M. & Duchêne, J. (2007a) Fractal time series
analysis of postural stability in elderly and control
subjects. Journal of NeuroEngineering and
Rehabilitation, 4, 12.
Amoud, H., Snoussi, H., Hewson, D. J., Doussot, M. &
Duchêne, J. (2007b) Intrinsic mode entropy for
nonlinear discriminant analysis. IEEE Signal
Processing Letters, 14, 297-300.
Challis, J. H. (2006) Aging, regularity and variability in
maximum isometric moments. Journal of
Biomechanics, 39, 1543-1546.
Collins, J. J. & De Luca, C. J. (1994) Random walking
during quiet standing. Physical Review Letters, 73,
764-767.
Diener, H. C., Dichgans, J., Bootz, F. & Bacher, M.
(1984) Early stabilization of human posture after a
sudden disturbance: influence of rate and amplitude of
displacement. Experimental Brain Research, 56, 126-
134.
Ferdjallah, M., Harris, G. F. & Wertsch, J. J. (1999)
Instantaneous postural stability characterization using
time-frequency analysis. Gait & Posture, 10, 129-134.
Gagey, P. M., Bizzo, G., Debruille, O. & Lacroix, D.
(1985) The one Hertz phenomenon. IN M., I. & F.O.,
B. (Eds.) Vestibular and visual control on posture and
locomotor equilibrium. Basel, Karger.
Goldberger, A. L., Amaral, L. A., Hausdorff, J. M.,
Ivanov, P., Peng, C. K. & Stanley, H. E. (2002) Fractal
dynamics in physiology: alterations with disease and
aging. Proceedings of the National Academy of
Sciences of the United States of America, 99 Suppl 1,
2466-72.
Loughlin, P. J., Redfern, M. S. & Furman, J. M. (1996)
Time-varying characteristics of visually induced
postural sway. IEEE Trans Rehabil Eng, 4, 416-24.
Mallat, S. & Hwang, W. L. (1992) Singularity detection
and processing with wavelets. Information Theory,
IEEE Transactions on, 38, 617-643.
Muzzy, J., Barcy, E. & Areno, A. (1991) Wavelets and
multifractals for singular signal: application to
turbulence data. Physical Review Letters, 67, 3515–
3519.
Norris, J. A., Marsh, A. P., Smith, I. J., Kohut, R. I. &
Miller, M. E. (2005) Ability of static and statistical
mechanics posturographic measures to distinguish
between age and fall risk. J Biomech, 38, 1263-72.
Roll, J. P. & Vedel, J. P. (1982) Kinaesthetic role of
muscle afferents in man, studied by tendon vibration
and microneurography. Exp Brain Res, 47, 177-90.
Rubenstein, L. Z. & Josephson, K. R. (2002) The
epidemiology of falls and syncope. Clin Geriatr Med,
18, 141-58.
Schmuckler, M. (1997) Children's postural sway in
response to low- and high-frequency visual
information for oscillation. Jouranl of Experimental
Psychology: Human Perception and Performance, 23,
528-545.
Thurner, S., Mittermaier, C., Hanel, R. & Ehrenberger, K.
(2000) Scaling-violation phenomena and fractality in
the human posture control systems. Physical Review
E, 62, 4018.
BIOSIGNALS 2009 - International Conference on Bio-inspired Systems and Signal Processing
106
