
NOISE POWER ESTIMATION USING RAPID ADAPTATION AND
RECURSIVE SMOOTHING PRINCIPLES
Franc¸ois Xavier Nsabimana, Udo Z
¨
olzer
Department of Signal Processing and Communications, Helmut Schmidt University
Holstenhofweg 85, 22043 Hamburg, Germany
Vignesh Subbaraman
Information and Communication Systems, Technische Universit
¨
at Hamburg-Harburg
Schwarzenbergstr. 95, 21073 Hamburg, Germany
Keywords:
Noise estimation, Recursive averaging, Speech presence probability, Smoothing, Bias correction and normal-
ized mean square error.
Abstract:
In this paper we present an algorithm for the robust estimation of the noise power from the speech signals
contaminated by high non stationary noise sources for speech enhancement. The noise power is first estimated
by minimum statistics principles with a very short window. From the resulting noise power excess, the over-
estimation is accounted for using recursive averaging techniques. The performance of the proposed technique
is finally compared with the different existing approaches using various grading tests.
1 INTRODUCTION
Speech Enhancement is a technique to improve the
quality as well as the intelligibility of the corrupted
speech. The improvement of quality and intelligibil-
ity is very important because it provides accurate in-
formation exchange and contributes to reduce listener
fatigue in highly disturbed environments. In order to
enhance a corrupted speech, two activities need to be
done first. These are noise estimation and noise re-
duction techniques. In this paper an algorithm for
the noise estimation technique is proposed. Basically
the noise estimators can be classified into two types
(Loizou, 2007). These are minima tracking and re-
cursive averaging algorithms.
In minima tracking algorithms, the spectral mini-
mum is continuously updated or tracks within a finite
window. Optimal Smoothing and Minimum statistics
algorithm is an example for the minima tracking type
(Martin, 2001). In recursive averaging algorithms the
noise power in the individual bands is updated recur-
sively, whenever the probability of speech presence is
very low. Minima controlled and recursive averaging
for robust speech enhancement (Cohen and Berdugo,
2002) and Rapid adaptation for highly non stationary
environments (Rangachari and Loizou, 2006) are ex-
amples for the recursive averaging type.
There are also several noise estimation techniques
proposed in literature (Martin, 1994; Cohen, 2003;
Rangachari et al., 2004; Erkelens and Heusdens,
2008a; Erkelens and Heusdens, 2008b). Continuous
Spectral Minima Tracking in Subbands (SMTS) pro-
posed by Doblinger (Doblinger, 1995) is one of the
classical noise estimation technique. It is very sim-
ple but its performance suffers from pronounced over-
estimation. Optimal Smoothing and Minimum Stati-
stics (OSMS) proposed by Martin (Martin, 2001) is
one of the most commonly used algorithms for noise
estimation in speech enhancement techniques. The
noise power estimated by this approach is very good
but the algorithm fails to track quickly the rapid in-
crease of the noise power in the corrupted speech.
Rapid Adaptation for Highly Non-Stationary Envi-
ronments (RAHNSE) as proposed by Loizou (Ran-
gachari and Loizou, 2006) tracks quickly the sudden
changes in the noise power. But this algorithm still
suffers from some overestimation, as it partially relies
on the SMTS approach.
The motivation for this new algorithm is to have
a noise estimator which provides a minimum overes-
timation and a small adaptation time for increasing
noise power. In this work a method to update the
noise power recursively with minimum speech leak-
age is proposed. The adaptation time of this approach
is comparable to the one of RAHNSE (0.5 sec). The
objective grading tests and the subjective spectrogram
13
Xavier Nsabimana F., Zölzer U. and Subbaraman V. (2009).
NOISE POWER ESTIMATION USING RAPID ADAPTATION AND RECURSIVE SMOOTHING PRINCIPLES.
In Proceedings of the International Conference on Signal Processing and Multimedia Applications, pages 13-18
DOI: 10.5220/0002197100130018
Copyright
c
SciTePress
comparison reveal that the proposed algorithm per-
forms better than the simulated OSMS and RAHNSE
approaches.
The rest of paper is organised as follows. Sec-
tion 2 presents some preliminary definitions. Section
3 discusses the proposed noise estimation algorithm.
Section 4 compares the proposed technique with the
two existing approaches and Section 5 concludes.
2 PRELIMINARY DEFINITIONS
Let consider the spectrum of a corrupted speech sig-
nal to be defined as
X(k, m) = S(k, m)+N(k, m), (1)
where S(k, m) and N(k, m) are the short-time DFT
coefficients at frequency bin k and frame number m
from the clean speech and additive noise respectively.
S(k, m) and N(k, m) are assumed to be statistically in-
dependent and zero mean. The adjacent frames of the
corrupted speech x(n) overlap by 75 % in time do-
main.
The power level of the clean speech R
s
(k, m), of
the additive true noise R
n
(k, m) and of the corrupted
speech R
x
(k, m) are obtained by squaring their respec-
tive magnitude spectrum. In this paper an algorithm
to estimate R
n
(k, m) from R
x
(k, m) is proposed. The
estimated noise power is represented by R
˜n
(k, m).
3 PROPOSED RARS APPROACH
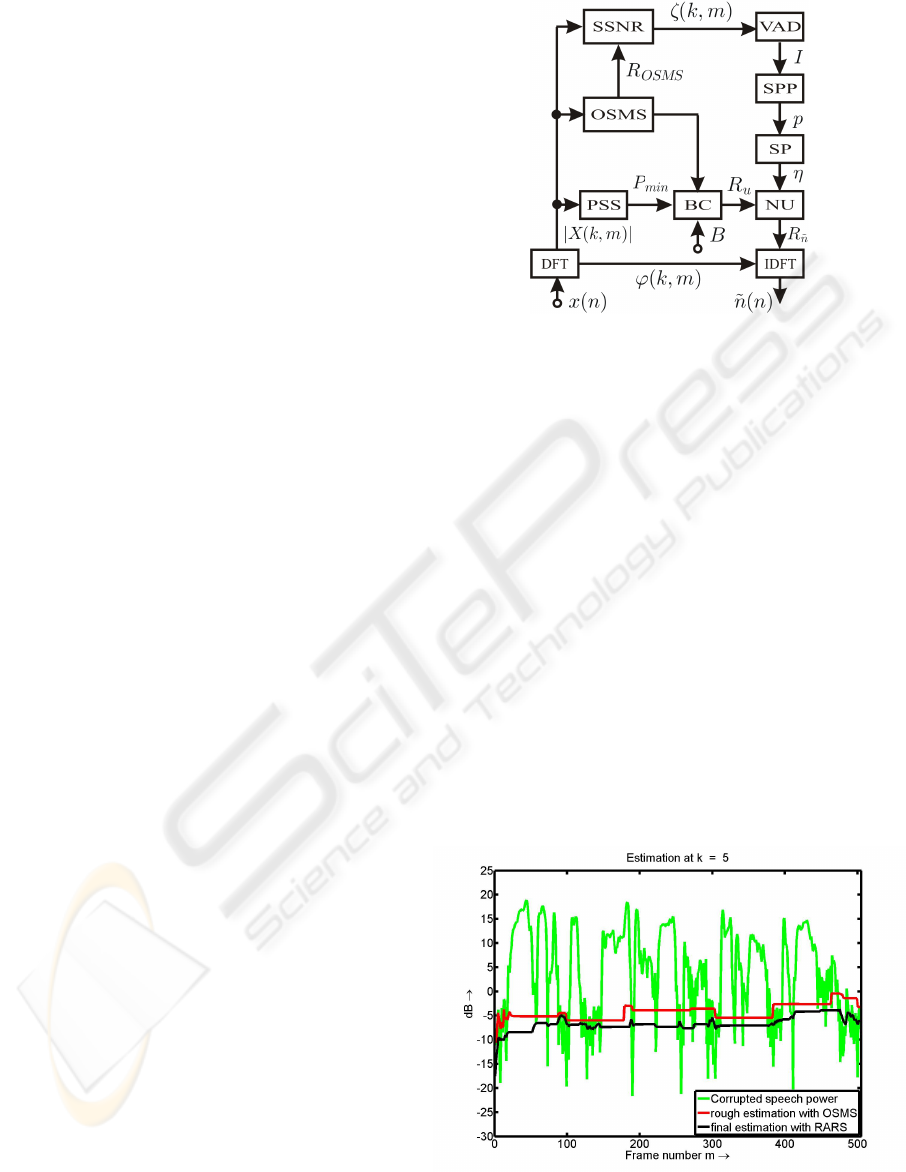
Figure 1 presents the flow diagram of the Rapid Adap-
tation and Recursive Smoothing (RARS) which is the
proposed noise estimation technique in this paper.
In the RARS approach (s. Figure 1), first the
noise power is estimated using Optimal Smoothing
and Minimum Statistics (OSMS) approach (Martin,
2001) with a very short window. This yields an over-
estimation of the estimated noise power. Based on
the smoothed posteriori SNR from the OSMS noise
power a VAD index I is derived to compute the speech
presence probability P and a smoothing parameter η.
This smoothing parameter is finally applied to the
unbiased estimated noise power R
u
from OSMS ap-
proach to account for the overestimation. In order to
improve the adaptation time for the estimated noise
power, a condition BC is used to track quickly the
fast changes in the noise power. The proposed al-
gorithm is not an optimal solution, yet practically it
gives very good results. Optimization of the proposed
approach is possible. In the followings the main steps
Figure 1: RARS approach. Power Spectrum Smoothing
(PSS), Bias Correction (BC), Noise Update (NU), Smooth-
ing Parameter (SP), Speech Presence Probability (SPP),
Voice Activity Detector (VAD), Smoothed SNR (SSNR).
of the RARS approach (s. Figure 1) are individual
described.
3.1 Rough Estimate with OSMS
In the first step of the RARS approach, the noise
power is estimated using OSMS approach with very
short window length ( 0.5 - 0.6 sec). This causes
an overestimate of the noise power since the window
length is very small. The estimated noise power with
OSMS using small window and the final estimate with
RARS can be seen in Figure 2-3, where green curve
depicts the power spectrum of the corrupted speech,
while red and black curve represent respectively the
estimated noise power with OSMS and RARS ap-
proach. From Figure 2 to Figure 3 the aforementioned
overestimation is clearly observed.
Figure 2: Rough estimate with OSMS vs. final estimate
with RARS. Results for frequency bin k=5.
SIGMAP 2009 - International Conference on Signal Processing and Multimedia Applications
14
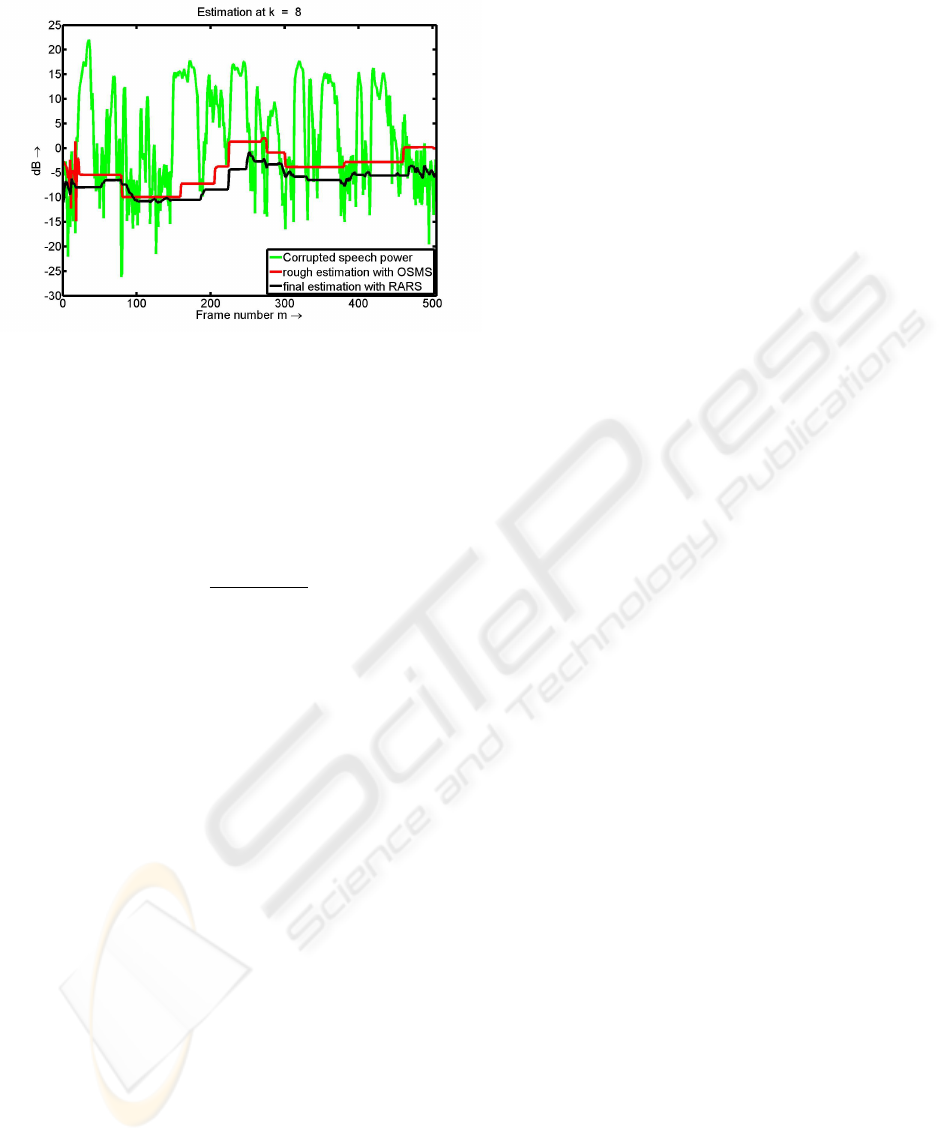
Figure 3: Rough estimate with OSMS vs. final estimate
with RARS. Results for frequency bin k=8.
3.2 Speech Presence Probability
In order to calculate the speech presence probabil-
ity the idea proposed by Cohen (Cohen and Berdugo,
2002) is used. Firstly the a posteriori SNR is calcu-
lated using the OSMS estimated noise power as
ζ(k, m) =
R
x
(k, m)
R
OSMS
(k, m)
. (2)
Since ζ(k, m) is computed using overestimated noise
power, it cannot be used directly. To overcome this ef-
fect the a posteriori SNR is smoothed over the neigh-
boring frequency bins to take into account the strong
correlation of speech presence across the frequency
bins in the same frame (Cohen and Berdugo, 2002).
Smoothed SNR is given by
˜
ζ(k, m) =
i= j
∑
i=− j
w(i) · ζ(k − i, m) (3)
where,
i= j
∑
i=− j
w(i) = 1 (4)
and 2 j + 1 is a window length for the frequency
smoothing.
˜
ζ(k, m) is then compared with a thresh-
old ∆ to derive a VAD index I(k, m) as follows,
I(k, m) =
1 , if
˜
ζ(k, m) > ∆
0 , otherwise,
(5)
where ∆ is an empirically determined threshold and
I(k, m) = 1 represents speech present bin. ∆ = 4.7
was proposed by Cohen (Cohen and Berdugo, 2002).
Based on the VAD index the speech presence proba-
bility is then given by
p(k, m) = γ · p(k, m − 1)+ (1 − γ) · I(k, m), (6)
where γ is a constant determined empirically. Values
of γ ≤ 0.2 are suggested for a better estimate (Cohen
and Berdugo, 2002). p(k, m) is the probability for the
bin to be speech. If I(k, m) = 1, then value of p(k, m)
increases, else if I(k, m) = 0, the value of p(k, m) de-
creases. It should be pointed out that Eq. (3) implic-
itly takes correlation of speech presence in adjacent
bins into consideration. Note also that the threshold
∆ in Eq. (5) plays an important role in speech detec-
tion. If the threshold ∆ is low, speech presence can be
detected with higher confidence thus avoiding overes-
timation (Cohen and Berdugo, 2002).
3.3 Smoothing Parameter
With the help of the above derived speech presence
probability a time frequency dependent smoothing
parameter
η(k, m) = β + (1 − β) · p(k, m) (7)
is updated, where β is a constant. Values of β ≥ 0.85
yield a better estimate of η as proposed in (Cohen
and Berdugo, 2002). If p(k, m) is high, then value
of η(k, m) will be high. Else if p(k, m) is low, then
value of η(k, m) will be low. η(k, m) takes value in
the range β ≤ η(k, m) ≤ 1 . It is expected that the
smoothing parameter will be close to 1 during speech
presence regions.
3.4 Tracking Fast Changes
An algorithm to track the fast changes in noise power
is proposed here. The adaptation time for the pro-
posed algorithm is around 0.5 sec, thus close to that of
Rapid Adaption for Highly Non-Stationary Environ-
ments (RAHNSE approach) (Rangachari and Loizou,
2006). A simple and effective idea as proposed
in (Erkelens and Heusdens, 2008a) is applied here,
which ensures that the proposed approach can track
quickly changes in the noise power. First a refer-
ence noise power estimate using OSMS with a short
window (0.5 sec) is computed. The corrupted speech
power is smoothed with a low value smoothing con-
stant. The idea here is to push the noise estimate
into the right direction when there is an increase in
noise power. The smoothed corrupted speech power
is given by
P(k, m) = α · P(k − 1, m)+(1 − α) · R
x
(k, m), (8)
where values of α ≤ 0.2 are suggested for better
smoothing. From the smoothed power spectrum,
P
min
is found for a window length of at least 0.5
sec. Because of small smoothing constant, smoothed
spectrum power almost follows the corrupted speech
NOISE POWER ESTIMATION USING RAPID ADAPTATION AND RECURSIVE SMOOTHING PRINCIPLES
15
power. To account for biased estimate the following
condition
if BP
min
(k, m) > R
OSMS
(k, m), then
R
u
(k, m) = BP
min
(k, m) (9)
is tested, where B > 1 is a bias correction factor. For
the RARS approach B = 1.5 yields good bias cor-
rection. If the above condition fails then R
u
(k, m) =
R
OSMS
(k, m). In case of increase in noise power
BP
min
(k, m) will be greater than R
OSMS
(k, m). The
value for R
OSMS
(k, m) is thus replaced by BP
min
(k, m).
For this case the probability is updated to p(k, m) = 0
and the smoothing parameter for noise update is then
recomputed (s. Eq. (7)). Observations (Erkelens and
Heusdens, 2008a) reveal that the value of B and win-
dow length is not critical, but a window length of at
least 0.5 sec is necessary for good performances.
3.5 Noise Power Update
Finally with the frequency dependent smoothing fac-
tor η(k, m) from Eq. (7), the spectral noise power
from RARS approach is updated using
R
˜n
(k, m) = η· R
˜n
(k, m− 1)+ (1− η)· R
u
(k, m). (10)
The key idea of this algorithm is that instead of
using the corrupted speech power R
x
(k, m) to updated
the noise estimate (Rangachari and Loizou, 2006),
the unbiased estimate R
u
of noise power from OSMS
algorithm is used. Since R
u
(k, m) has minimum
speech power as compared to corrupted speech power
R
x
(k, m), the speech power leakage into noise power
in this approach is minimized. Whenever the speech
presence probability is low, the estimated noise power
will follow R
u
(k, m). But when the speech presence
probability is high, estimated noise power will follow
the noise power in the previous frame. Thus, as shown
in Figure 3, the proposed algorithm avoids the over-
estimated values observed in the rough OSMS esti-
mation from Figure 2.
4 SIMULATION RESULTS
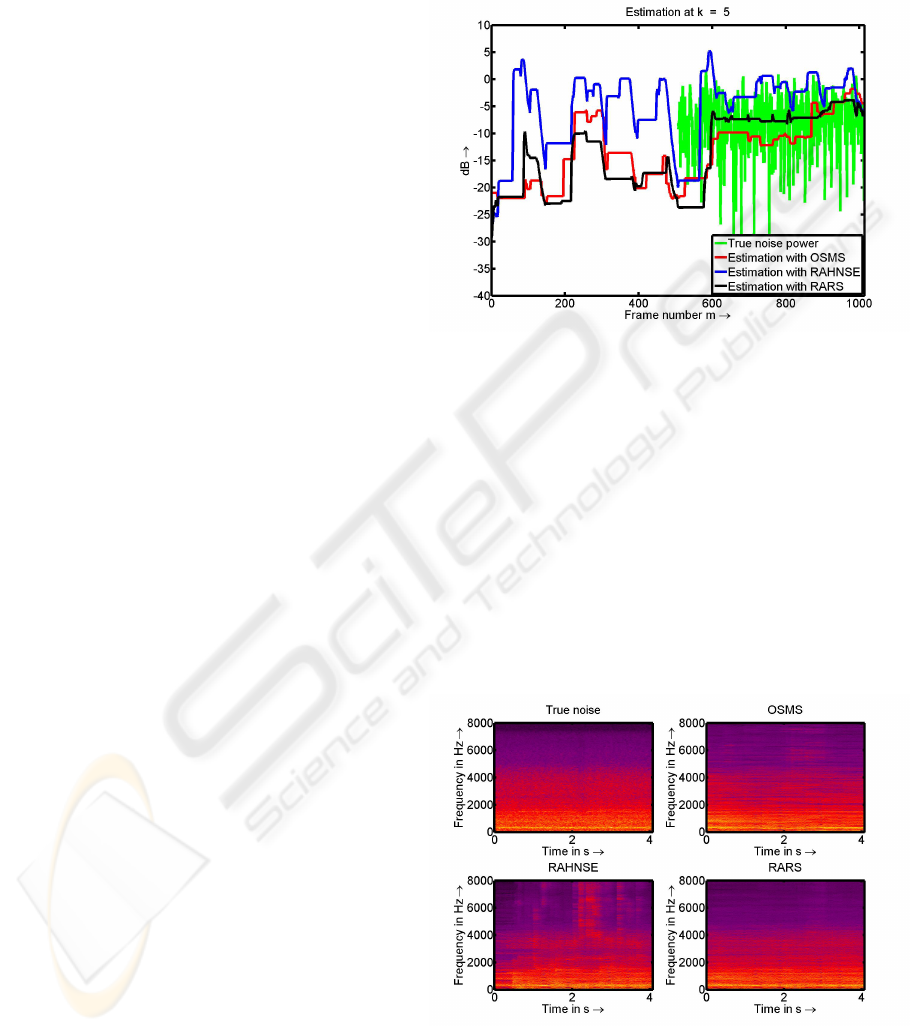
Figure 4 presents the comparison between OSMS,
RAHNSE and RARS approach in terms of rapid
adaption and true minimum estimate. This simula-
tion was run for a mixed signal where the first 500
frames consist of only clean speech and the last 500
frames consist of the same clean speech but corrupted
with car noise at 5 dB SNR. The estimation for both
parts of the mixed signal reveals the best minimum
estimate for the RARS approach followed by OSMS.
Best rapid adaptation is observed by RAHNSE fol-
lowed by RARS approach. The adaptation time for
the proposed approach is also around 0.5 to 0.6 sec
as in RAHNSE approach. A comparison at only
Figure 4: Comparison in terms of true noise estimate and
rapid adaptation time. True car noise (green), RAHNSE
(blue), OSMS (red) and RARS (black).
one specified frequency bin may not be sufficient to
state about the performances of the three approaches.
Figure 5 thus presents a subjective study of the esti-
mated noise in terms of spectrograms. Obviously the
result with the RARS approach (s. Figure 5 lower plot
right) is close to the true noise (s. Figure 5 upper plot
left). Some pronounced overestimations are observed
in the RAHNSE approach (s. Figure 5 lower plot left)
especially for high frequency bands. The OSMS re-
sult in Figure 5 upper plot right can be found close to
the RARS result than to the RAHNSE one.
Figure 5: Subjective study of spectrograms for the esti-
mated noise. True car noise (upper plot left), OSMS (upper
plot right), RAHNSE (lower plot left) and RARS (lower
plot right).
SIGMAP 2009 - International Conference on Signal Processing and Multimedia Applications
16
4.1 Normalized Mean Square Error
The results obtained for the estimated noise with three
compared approaches have been graded also in terms
of Normalized Mean Square Error (NMSE) given by
NMSE =
1
M
M−1
∑
m=0
L−1
∑
k=0
[R
n
(k, m)− R
˜n
(k, m)]
2
L−1
∑
k=0
[R
n
(k, m)]
2
, (11)
where R
n
(k, m) is the true noise power and R
˜n
(k, m)
represents the estimated noise power. Ideally the
value for NMSE lies in the interval [0 1], where 0
represents true estimation and 1 represents very poor
estimation. But practically the NMSE value can be
greater than 1 due to overestimation. Whenever there
is an overestimation in the algorithm, the value for
R
˜n
(k, m) can be twice greater than R
n
(k, m) therefore
the ratio in Eq. (11) can be greater than 1. All the sig-
nals used for the simulation in this paper are from the
Noisex-92 database taken from Sharon Gannot and
Peter Vary web pages. Table 1 to 3 show NMSE re-
sults for three kinds of corrupting noise. These results
reveal that the RARS approach is graded best.
Table 1: NMSE for the estimated noise power from a speech
signal corrupted by car noise at 5 dB SNR.
Algorithm NMSE
OSMS 0.740
RAHNSE 0.692
RARS 0.601
Table 2: NMSE for the estimated noise power from a speech
signal corrupted by room noise at 9 dB SNR.
Algorithm NMSE
OSMS 0.211
RAHNSE 0.391
RARS 0.061
Table 3: NMSE for the estimated noise power from a speech
signal corrupted by white noise at 9 dB SNR.
Algorithm NMSE
OSMS 0.023
RAHNSE 0.011
RARS 0.007
While Table 1 and 3 reveal that the RAHNSE ap-
proach is graded second for these two kinds of cor-
rupting noise, Table 1 clearly shows that OSMS ap-
proach remains close to RARS approach for that cor-
rupting noise. In general the NMSE values remain
close for these three approaches.
4.2 Subjective Comparison using Plots
The results of the three approaches have been also
compared subjectively in terms of plots. The follow-
ing figures presents the results of the comparison be-
tween true noise and estimated noise for speech sig-
nal corrupted by car noise at 5dB, room noise at 9
dB and white noise at 9 dB. In the following figures,
the green, red, blue and black curve represent respec-
tively the true noise power, the estimated noise power
from the OSMS, RAHNSE and RARS approaches.
For the sake of completeness, the comparison is pre-
sented for the simulation of the estimated noise power
at frequency index k = 5.
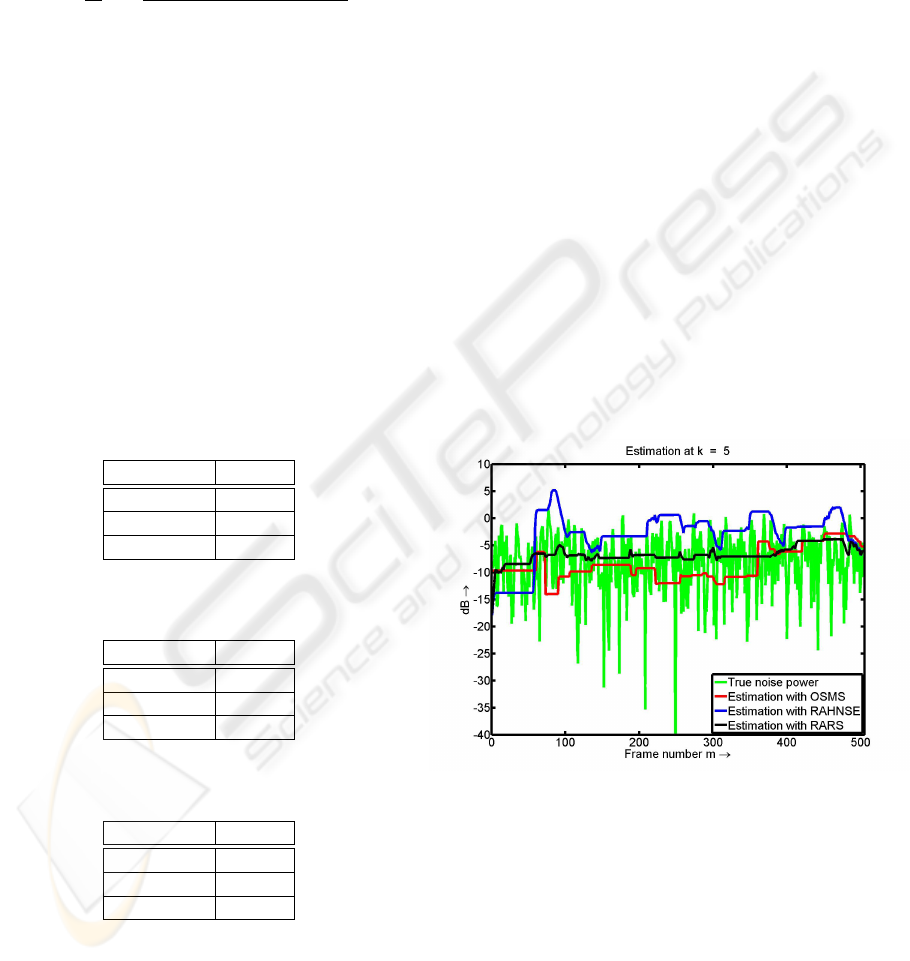
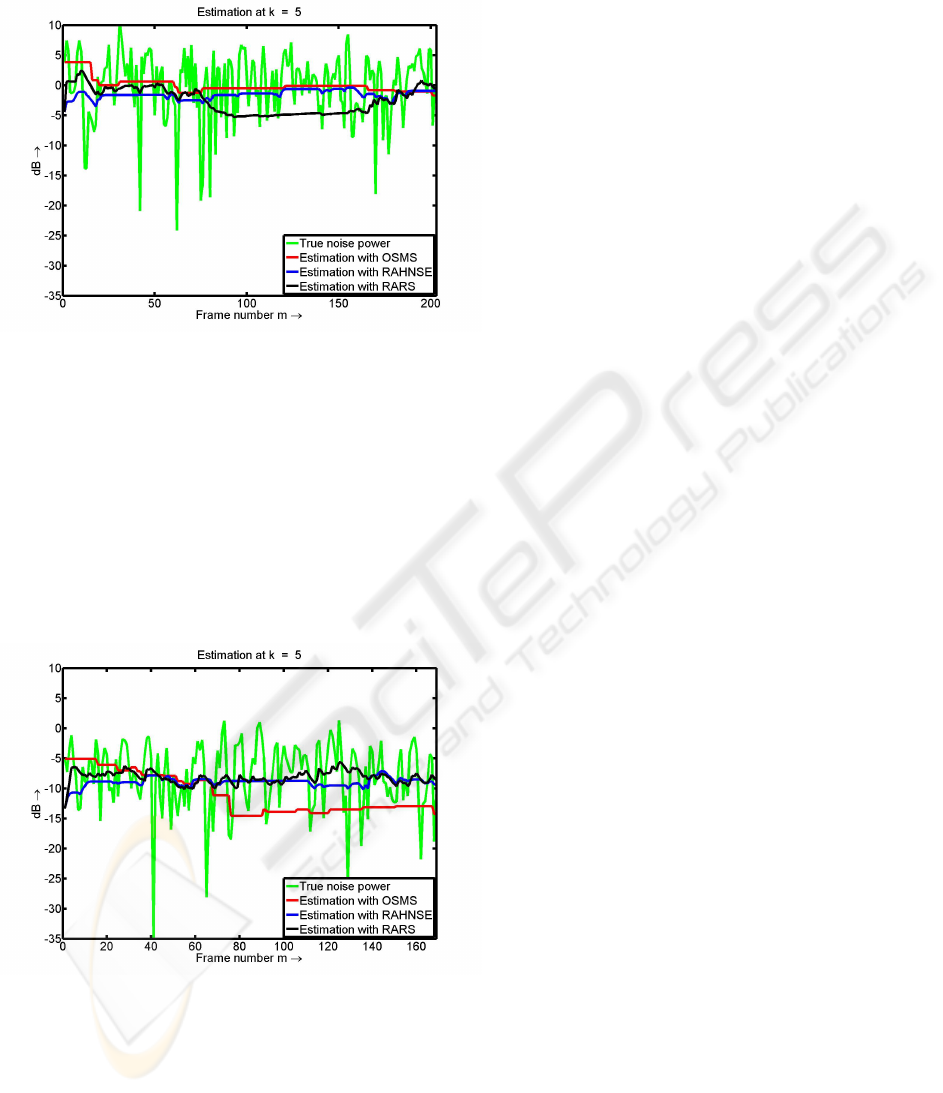
Figure 6 presents the plot of true noise power and
the estimated noise power from a speech signal cor-
rupted by car noise at 5dB. The purpose of the estima-
tor is to find the mean value of the green curve from
the corrupted speech power. It can be noticed that the
red curve is below the mean value of the green curve.
The blue curve (noise power estimated by RAHNSE)
is instead pretty high. It clearly reveals some over-
estimation. It is obvious that the black curve (esti-
mated noise power by the RARS approach) clearly
follows here the mean of the true noise power (see
green curve).
Figure 6: Estimated noise power for speech signal corrupted
by car noise at 5dB. Results for frequency index k=5.
Figure 7 depicts the plot of true noise power
against the estimated noise power from a speech sig-
nal corrupted by room noise at 9dB at 5dB. The green
curve still represents here the true noise power. The
black curve (noise power from RARS) reveals some
underestimation of the noise power in the region of
frame number 75 to 150. Outside this region it fol-
lows the mean of the true noise power. Blue (noise
power from RAHNSE) and red curves (noise power
from OSMS) are pretty close and they follow the
NOISE POWER ESTIMATION USING RAPID ADAPTATION AND RECURSIVE SMOOTHING PRINCIPLES
17
mean value pretty well in this case.
Figure 7: Estimated noise power for speech signal corrupted
by room noise at 9dB. Results for frequency index k=5.
Figure 8 shows the plot of true noise power and the
estimated noise power from a speech signal corrupted
by white noise at 9dB. The green curve still depicts
here the true noise power. The red curve (noise power
from OSMS) represents the underestimated power.
Blue (noise power from RAHNSE) and Black curves
(noise power from RARS) are pretty close. But an in-
dept view states that the black curve really follows the
mean of green curve.
Figure 8: Estimated noise power for speech signal corrupted
by white noise at 9dB. Results for frequency index k=5.
5 CONCLUSIONS
A robust noise estimation technique based on mini-
mum statistics and recursive averaging is presented
here. The proposed approach (RARS) relies on the
OSMS approach with very short window. But the
RARS approach addresses the subsequent overesti-
mation and adapts fast to rapid changes in noise power
than the OSMS approach. The results of the RARS
approach has been compared to the results of OSMS
and RAHNSE approach subjectively in terms of plots
(spectrograms) and objectively in terms of NMSE. A
Comparison in terms of true noise estimate and rapid
adaptation time reveals that the RARS approach is
performing best. A subjective study of spectrograms
for the estimated noise also reveals that the RARS es-
timated noise is close to the true noise.
REFERENCES
Cohen, I. (2003). Noise spectrum estimation in adverse
environments: improved minima controlled recursive
averaging. In IEEE Trans Speech Audio Processing,
volume 411.
Cohen, I. and Berdugo, B. (2002). Noise estimation by min-
ima controlled recursive averaging for robust speech
enhancement. In IEEE Signal Proc. Letters.
Doblinger, G. (1995). Computationally efficient speech en-
hancement by spectral minima tracking in subbands.
In Proc. of Eurospeech, volume 2.
Erkelens, J. and Heusdens, R. (2008a). Fast noise tracking
based on recursive smoothing of mmse noise power
estimates. In Proc. of ICASSP.
Erkelens, J. and Heusdens, R. (2008b). Tracking of non-
stationary noise based on data-driven recursive noise
power estimation. In IEEE Trans. on Audio, Speech,
and Language Processing, volume 16, pages 1112–
1123.
Loizou, P. (2007). Speech Enhancement Theory and Prac-
tice. Taylor and Francis Group, New York, 1rst edi-
tion.
Martin, R. (1994). Spectral subtraction based on minimum
statistics. In Proc. of EUSIPCO.
Martin, R. (2001). Noise power spectral density estima-
tion based on optimal smoothing and minimum statis-
tics. In IEEE Trans. on Speech, Audio Processing,
volume 9.
Rangachari, S. and Loizou, P. (2006). A noise estimation
algorithm for highly non stationary environments. In
Proc. of Speech Communications, volume 48.
Rangachari, S., Loizou, P., and Hu, Y. (2004). A noise
estimation algorithm with rapid adaptation for highly
nonstationary environments. In Proc. of ICASSP, vol-
ume 1.
SIGMAP 2009 - International Conference on Signal Processing and Multimedia Applications
18
