
TEMPORAL MINING IN IMPRECISE ARCHÆOLOGICAL
KNOWLEDGE
Cyril De Runz and Eric Desjardin
CReSTIC-SIC, University of Reims Champagne-Ardenne
Rue des Cray
´
eres BP 1035, Reims cedex 2, France
Keywords:
Fuzzy logic, Data mining, Imprecise temporal data, Fuzzy temporal relation, Archæology, GIS.
Abstract:
In this paper, we propose a new temporal data mining method considering a set of archæological objects which
are temporally represented with fuzzy numbers. Our method uses an index which quantifies the anteriority
between two fuzzy numbers for the construction of a weighted oriented graph. The vertices of the graph
correspond to the temporal objects. Using this anteriority graph, we estimate the potential of anteriority, of
posteriority and the relative temporal position of each object. We focus on excavation data from the ancient
Reims stored in a Geographical Information System (GIS). We visualize the discovered temporal positions of
objects and weighted relations between them in a layer of the GIS.
1 INTRODUCTION
Time is crucial for the study and the analysis of
archæological knowledge. Using a Geographical In-
formation Systems (Conolly and Lake, 2006), tem-
poral information should be taken into consideration
by analysts as the spatial configuration is. Thus, pro-
cesses should consider temporal information in its
complexity and quality. For instance, dates or activ-
ity periods usually results form interpretation and thus
are imprecise. Furthermore, dates of some particu-
lar objects or elements are hard to estimate. Fuzzy
set theory, introduced in (Zadeh, 1965), proposes a
formalism to represent imprecise knowledge. In this
paper, dates and activity periods are represented by
fuzzy numbers (FNs).
In the analysis of archæological information, it
may be natural to estimate the temporal positions of
objects (i.e. the object ranks in a chronological view).
Those positions give us new knowledge over the ob-
ject information. This new knowledge helps experts
and us to comprehend archæological information. As
objects are temporally represented by fuzzy numbers,
the method exposed in this article aims to compute
the temporal position of each object related to the
database objects.
In order to define those positions, a temporal re-
lation must be used. This relation should be an or-
der relation, but no total order relation could be de-
fined over fuzzy numbers. The approach used when
comparing two dates, which generates a binary deci-
sion (“after” or “before”), is not suitable. Trustwor-
thiness is an important aspect. Moreover, set rank-
ing approaches consider reference sets defined on the
studied set of fuzzy numbers (Chen, 1985; Jain, 1977;
Kerre, 1982). Those approaches do not consider in-
formation given by the pairwise comparison which is
essential in a temporal context.
We introduced in (de Runz et al., 2009) an anteri-
ority index which quantifies the result of the following
question “is this element anterior to this other one?”.
As dates are represented with fuzzy numbers, the in-
dex value is calculated from the FNs using Kerre’s
approach (Kerre, 1982) and takes value in [0, 1].
Using this index, this article presents a new data
mining process which allows us to define the tem-
poral positions according to the pairwise anteriority.
This archæological analysis process is based on a
weighted oriented graph called “anteriority graph”. In
this graph, a vertex is associated to each object and
each pair of vertices is linked by two arcs weighted
by the values of the anteriority index.
This graph allows us to compute the potential of
anteriority and posteriority
1
of each object through its
associated vertex. The difference between those po-
tentials determines the temporal index of the object.
1
The potential of anteriority (or posteriority) of an object
quantifies the way that it could be anterior (or posterior) to
others in the set of objects.
47
de Runz C. and Desjardin E. (2009).
TEMPORAL MINING IN IMPRECISE ARCHÆOLOGICAL KNOWLEDGE.
In Proceedings of the International Joint Conference on Computational Intelligence, pages 47-52
DOI: 10.5220/0002280700470052
Copyright
c
SciTePress

A ranking of temporal index values over all objects
from database assigns to each object a rank which is
its temporal position in the database. The anteriority
graph will allow a synthetic and formal representation
of temporal structures in the set of archæological ob-
jects stored in a spatiotemporal database.
The application context of this work is the SI-
GRem project (de Runz et al., 2007b; de Runz et al.,
2007a). We propose in this article to use our data min-
ing approach on the set of BDFRues objects. In this
spatiotemporal database, objects represent the Roman
streets found in Reims and are stored with a fuzzy rep-
resentation of their activity periods. To obtain a visu-
alization of the temporal relations and positions, the
locations of objects are used to build a layer in a GIS
and thus to produce some maps.
This paper is organized as follows. Firstly, the an-
teriority index is presented. Secondly, the definition
of the anteriority graph and our data mining approach
are exposed. Thirdly, our approach is illustrated on
an application in an archæological GIS. Finally, the
conclusion of this work is given.
2 ANTERIORITY INDEX
In the following, a fuzzy number is a convex and nor-
malized fuzzy subset on the set of real numbers R.
According to (Wang and Kerre, 2001a; Wang and
Kerre, 2001b), when, for the comparison, some of
methods use valuations of involved FNs (Fortemps
and Roubens, 1996), some others combine indices
(Saade and Schwarzlander, 1992). Those kinds of
methods are often not transitive (Wang et al., 1995).
Another kind of methods exploits a reference set
defined on FNs (Chen, 1985; Jain, 1977; Kerre,
1982). In this case, according to the set Ω of FNs
{A
1
, A
2
, . . . ,A
n
}, the first step consists in computing
the fuzzy reference set and then to value each FN A
i
by the calculation of the value of an index considering
the reference set and A
i
. The comparison of the index
values allows us to define the ranking.
For example, considering a set of n fuzzy numbers
{A
1
, A
2
, . . . ,A
n
}, Kerre proposes in (Kerre, 1982) to
compare two fuzzy numbers (A
i
and A
j
where i, j ∈
[1, n]) by comparing the Hamming distances between
those fuzzy numbers and the maximum, defined by
the Zadeh’s extension principle (Zadeh, 1965), of
{A
1
, A
2
, . . . ,A
n
}. The Hamming distance between
A
i
(resp. A
j
) and the maximum widetildemax of
(A
1
, A
2
, . . . ,A
n
) is called Kerre’s index K(A
i
) (resp.
K(A
j
)).
Thus, Kerre’s index of A
i
in {A
1
, A
2
, . . . ,A
n
} is ob-
tained as follows:
K(A
i
) = D
H
(A
i
,
g
max(A
1
, A
2
, . . . ,A
n
)) (1)
Thus
K(A
i
) =
Z
|A
i
(x) −
g
max(A
1
, A
2
, . . . ,A
n
)(x)|dx. (2)
For Kerre, A
i
= A
j
according to {A
1
, A
2
, . . . ,A
n
},
with (i, j) ∈ [1, n], iff K(A
i
) = K(A
j
).
In this kind of approach, the meaning of pairwise
comparison is not taken into consideration. Thus, we
would first use the Kerre’s approach for pairwise com-
parison, but the use of the Kerre’s index in pairwise
comparison can produce some non-transitive decision
in the goal to rank three or more fuzzy numbers.
In order to reduce the impact of those kinds of
inconsistencies during data exploitation, we build an
index which quantifies the anteriority between two
dates represented by fuzzy numbers.
When comparing fuzzy numbers, the key idea of
Kerre’s approach is, considering a set of fuzzy num-
bers, the higher the Kerre’s index of a fuzzy number
is, the lower the fuzzy number will be. We propose
to use Kerre’s index for a set of two FNs to define a
relative index, because the goal is not only to compare
a pair of dates but also to evaluate the comparison by
an anteriority index
Indeed, let F and G be two fuzzy numbers, if F is
equal to the maximum according the extension prin-
ciple, then the proposition “F is lower than G” is true,
thus the value of the anteriority index of F regarding
G must be equal to 1. When G is equal to the max-
imum and F is not, then the proposition “F is lower
than G” is false, thus the value of the anteriority in-
dex of F regarding G must be equal to 0. In other
cases, the sum of the values of our index for the cou-
ple (F, G) and the couple (G, F) must be equal to 1.
So we define our index on the restriction to the subset
of those two fuzzy numbers as follows:
Ant(F, G) =
(
K(F)
K(F)+K(G)
if K(F)+ K(G) = 1
1 if K(F)+ K(G) = 0
(3)
As the Kerre’s index could not take a negative
value, the case K(F) + K(G) < 0 could not exist.
Ant(F, G) is a quantification of the logical rela-
tion F = G. Ant(F, G) is both an index of closeness
between G and
g
max(F, G) using Hamming distance
and an index of closeness between F and
g
min(F, G),
where
g
min is defined by the extension principle. So,
the anteriority index allows us to qualify the anterior-
ity and the posteriority between two dates dF and dG
represented by two FNs, F and G, as follows:
• Ant(F, G) = 0 ⇒“dF is not anterior to dG” and
“dG is not posterior to dF”,
IJCCI 2009 - International Joint Conference on Computational Intelligence
48
• 0 < Ant(F, G) ≤ 0.5 ⇒ “dF is rather not anterior
to dG” and “dG is rather not posterior to dF”,
• 0.5 ≤ Ant(F, G) < 1 ⇒ “dF is rather anterior to
dG” and “dG is rather posterior to dF”,
• Ant(F, G) = 1 ⇒ “dF is anterior to dG” and “dG
is posterior to dF”.
We can also note that iff Ant(F, G) is equal to 0.5
then Ant(G, F) = 0.5. In this case, each fuzzy num-
ber is as close to the minimum as to the maximum.
Thus, the decision “dF is rather anterior to dG” is as
possible as the decision “dG is rather anterior to dF”.
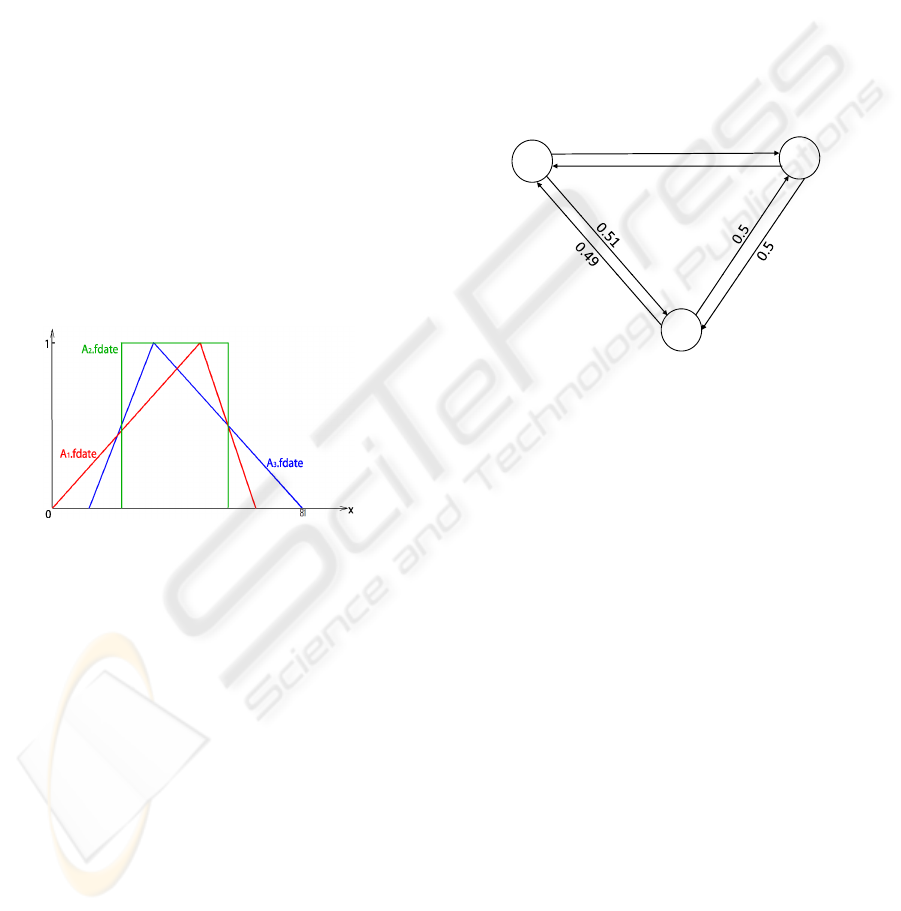
3 ANTERIORITY GRAPH
In this section, the construction of the anteriority
graph is studied. This study is illustrated using the
following example: let Ω a set of archæological ob-
jects {A
1
, A
2
, A
3
} which are temporally represented
by respectively A
1
. f Date, A
2
. f Date and A
3
. f Date
presented in Figure 1.
Figure 1: Membership functions of A
1
. f Date, A
2
. f Date
and A
3
. f Date.
3.1 Graph Construction
Let Ω be a set of elements, ℜ a binary relation over Ω
and App an application from ℜ to R.
A weighted directed graph G
ℜ
(L
S
, L
A
, L
C
) can
be used to provide a schematic representation of ℜ
where L
S
is the set of vertices (A ∈ Ω ⇔ S
A
∈ L
S
), L
A
is the set of edges (AℜB ⇔ (S
A
, S
B
) ∈ L
A
) and L
C
is
the set of costs (C(S
A
, S
B
) = App(A, B) ∈ L
C
).
The exploratory analysis of our work is based on
such a graph. Ω is a set of archæological data with
a temporal feature fDate expressed as a fuzzy num-
ber. The application is the anteriority index defined
previously (App ≡ Ant).
As all the elements of Ω are pairwise connected,
the obtained graph is complete. To each element A
i
,
with activity period A
i
. f Date, a vertex S
A
i
is associ-
ated. The weight of arc (A
i
, A
j
) is the value of the
anteriority index Ant(A
i
. f Date, A
j
. f Date) and it rep-
resents the anteriority of A
i
with regard to A
j
. As ex-
ample, let us consider the set Ω = {A
1
, A
2
, A
3
}. On
this set, the values of the anteriority index are:
• Ant(A
1
. f Date, A
2
. f Date) = 0.44,
• Ant(A
2
. f Date, A
1
. f Date) = 0.56,
• Ant(A
1
. f Date, A
3
. f Date) = 0.51,
• Ant(A
3
. f Date, A
1
. f Date) = 0.49,
• Ant(A
2
. f Date, A
3
. f Date) = 0.50,
• Ant(A
3
. f Date, A
2
. f Date) = 0.50.
On this set, we build the anteriority graph
G
Ant
(Ω, Ω × Ω, [0;1]) illustrated in Figure 2.
S
S
0.44
S
A1
S
A2
0.56
S
A3
S
A3
Figure 2: Anteriority graph with Ω = {A1, A2, A3}.
3.2 Potential of Anteriority, Posteriority
and Temporal Position
Let S
A
i
and S
A
j
two vertices of the anteriority graph
which corresponds respectively to the A
i
and A
j
ob-
jects, the cost C(S
A
i
, S
A
j
) is the quantification of the
anteriority of A
i
to A
j
.
The sum of the costs of the arcs with A
i
as initial
node is called the potential of anteriority:
PotAnt
Ω
(A
i
) =
∑
C(S
A
i
, S
A
j
), ∀S
A
j
6= S
A
i
. (4)
In the example of Ω = {A
1
, A
2
, A
3
}, using the
anteriority graph presented in Figure 2, we ob-
tain: PotAnt
Ω
(A
1
) = 0.94, PotAnt
Ω
(A
2
) = 1.06,
PotAnt
Ω
(A
3
) = 0.99.
The sum of the costs of the arcs with A
i
as terminal
node is called the potential of posteriority:
PotPost
Ω
(A
i
) =
∑
C(S
A
j
, S
A
i
), ∀S
A
j
6= S
A
i
. (5)
In the example of Ω = {A
1
, A
2
, A
3
}, using the
anteriority graph presented in Figure 2, we ob-
tain: PotPost
Ω
(A
1
) = 1.05, PotPost
Ω
(A
2
) = 0.94,
PotPost
Ω
(A
3
) = 1.01.
The goal of this work is to propose a data mining
process to obtain the temporal positions and relations
TEMPORAL MINING IN IMPRECISE ARCHÆOLOGICAL KNOWLEDGE
49

of archæological objects stored in a spatiotemporal
database. In order to obtain the position, the tem-
poral index (TempInd
Ω
) is defined as the difference
between the posteriority and anteriority potential:
TempInd
Ω
(A
i
) = PotPost
Ω
(A
i
) − PotAnt
Ω
(A
i
). (6)
In the example Ω = {A
1
, A
2
, A
3
}, the temporal index
values are: TempInd
Ω
(A
1
) = 0.10, TempInd
Ω
(A
2
) =
−0.12, TempInd
Ω
(A
3
) = 0.02.
Using the temporal index, we propose to tempo-
rally rank the archæological objects. Those ranks are
called temporal position (TempPos
Ω
) and are obtain
using the following principle:
If TempInd
Ω
(A
i
) > TempInd
Ω
(A
j
)
then TempPos
Ω
(A
i
) > TempPos
Ω
(A
j
).
(7)
In the example Ω = {A
1
, A
2
, A
3
}, the temporal posi-
tions are: TempPos
Ω
(A
1
) = 2, TempPos
Ω
(A
2
) = 0,
TempPos
Ω
(A
3
) = 1.
3.3 Object Analysis through Anteriority
Graph
Using the anteriority graph, we can extract three par-
ticular temporal objects: the most anterior object, the
most posterior object and the temporally median ob-
ject.
The oldest object in the application, i.e. the most
anterior object (MA), is the one with the lowest tem-
poral index value in Ω. The temporal position of MA
is then the minimal temporal position of objects in Ω.
In the example Ω = {A
1
, A
2
, A
3
}, MA = A
2
.
The most recent object - the most posterior (MP)
- is the one with the highest temporal index value
in Ω. The temporal position of MP is the maximal
temporal position of objects in Ω. In the example
Ω = {A
1
, A
2
, A
3
}, MP = A
1
.
From the ranking process used to define the tem-
poral positions of archæological objects, it is trivial to
extract the median temporal object (MT ). This object
has the median value of temporal index in the set of
temporal index values obtained on Ω. In the example
Ω = {A
1
, A
2
, A
3
}, MT = A
3
.
Moreover, an object of Ω with a negative temporal
index value may be considered as a “rather anterior”
object in Ω. A positive temporal index value could
be interpreted as a “rather posterior” object. Thus, we
propose to split the set of elements into two subsets:
“rather anterior”, “rather posterior”. In the example
Ω = {A
1
, A
2
, A
3
}, A
2
is “rather anterior” but A
1
and
A
2
are “rather posterior”.
The anteriority graph construction is an original
approach to rank fuzzy numbers and also archæologi-
cal objects according to the fuzzy numbers represent-
ing their activity periods. This graph offers a global
vision of temporal relations between archæological
objects. It gives information for the classification ob-
jective and for the analysis at a local scale (the exca-
vation site) or a global (the city) scale.
4 APPLICATION
During an archæological analysis process, the study
of object temporal positions according to their loca-
tions is essential. In order to exploit the spatial aspect
of data, Conolly and Lake propose to record the in-
formation from archæological excavations using GIS
(Conolly and Lake, 2006).
In this section, we will use a GIS for the spatial
visualization of the object temporal positions and la-
bels.
4.1 Context
In the perspective of the promotion and the man-
agement of Reims archæological patrimony, the SI-
GRem project, carried out by the University of Reims
Champagne-Ardenne, the INRAP (National Institute
in Preventive Archæological Research) and the Cul-
ture Ministry, integrates the geo-informatics tools and
takes in consideration the archæological information
in the urban and regional analysis.
To achieve this objective, the first goal of the
SIGRem project is to develop a geographical infor-
mation system to manage archæological knowledge.
This system should propose and present some ad-hoc
spatiotemporal analysis tools. The temporal mining
process presented in this paper is now applied in this
context and specifically to the BDFRues database.
This database stores data about the Reims roman
streets and is based on excavation. The activity peri-
ods of stored objects are represented with fuzzy num-
bers. A visualization of those fuzzy numbers is pro-
posed in Figure 3.
0
100 300
200
400
t
0
1
Figure 3: Fuzzy numbers representing BDFRues object ac-
tivity periods.
IJCCI 2009 - International Joint Conference on Computational Intelligence
50
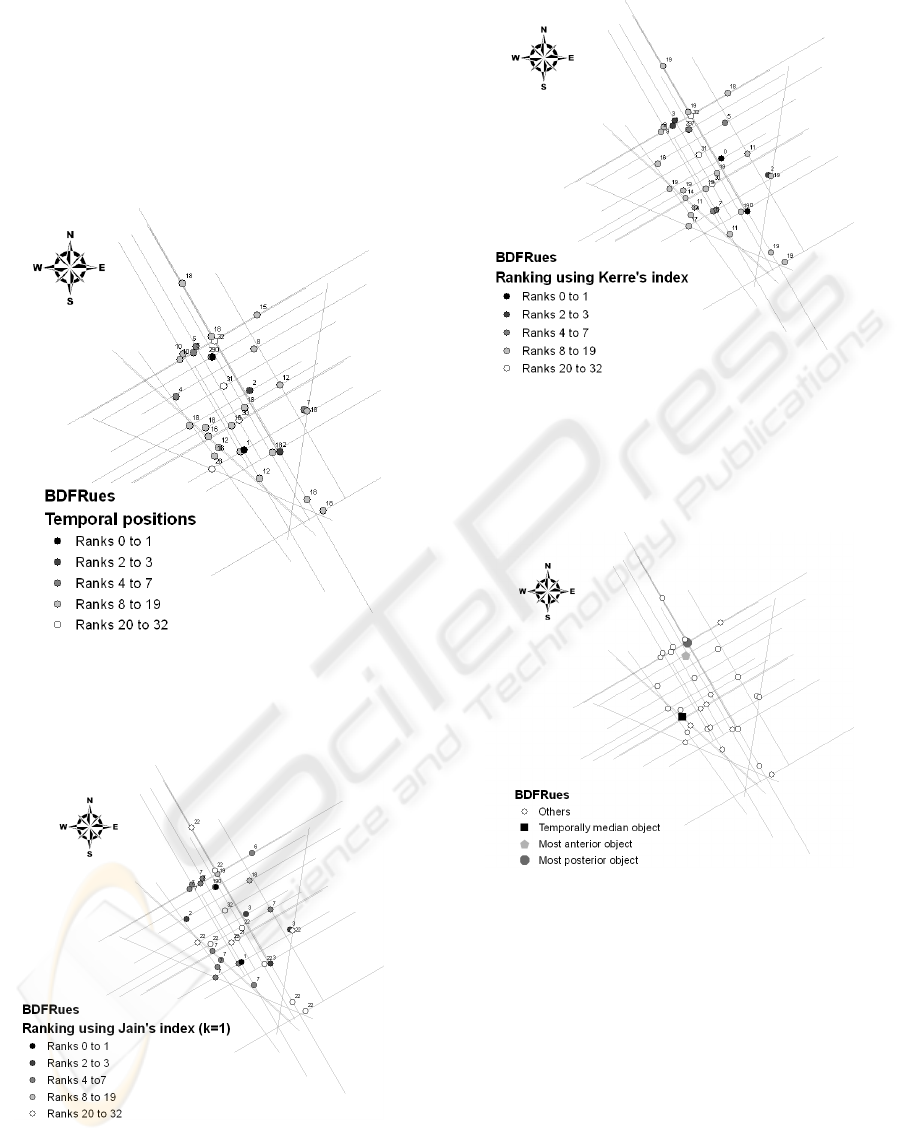
4.2 Temporal Positions and Labels
According to the anteriority graph construction and
the object locations, we obtain for the BDFRues ele-
ments the temporal positions visualized by a layer of
the GIS (Figure 4). In this figure, the higher the tem-
poral position, the higher the value of temporal index,
according to all others.
Figure 4: Temporal positions of BDFRues objects.
We can remark that the ranking from temporal po-
sitions are in some cases different to the Jain’s and
Kerre’s ranking (Figure 5 and Figure 6).
Figure 5: Jain’s ranking, with k = 1, of BDFRues objects
according to their activity periods.
However, the temporal position has a more tempo-
ral interpretability than Jain’s or Kerre’s rank, which
allows us to assign temporal labels to objects such as,
Figure 6: Kerre’s ranking of BDFRues objects according to
their activity periods.
for instance, the most anterior, the most posterior and
the temporally median objects localized in Figure 7.
Figure 7: Particular temporal positions of BDFRues objects.
The Figure 8 presents the map of BDFRues elements
grouped in two groups: “rather anterior” and “rather
posterior”.
In this application, there are two times more ob-
jects in the group “rather posterior” than in the group
“rather anterior”. Indeed, the study of the temporal
index values gives the following information:
• the value of temporal index of the most anterior
object is -29.8,
• the highest value of temporal index of “rather an-
terior” objects is -5.4,
• more than 72% of “rather posterior” objects have
a temporal index value higher than 6.
TEMPORAL MINING IN IMPRECISE ARCHÆOLOGICAL KNOWLEDGE
51
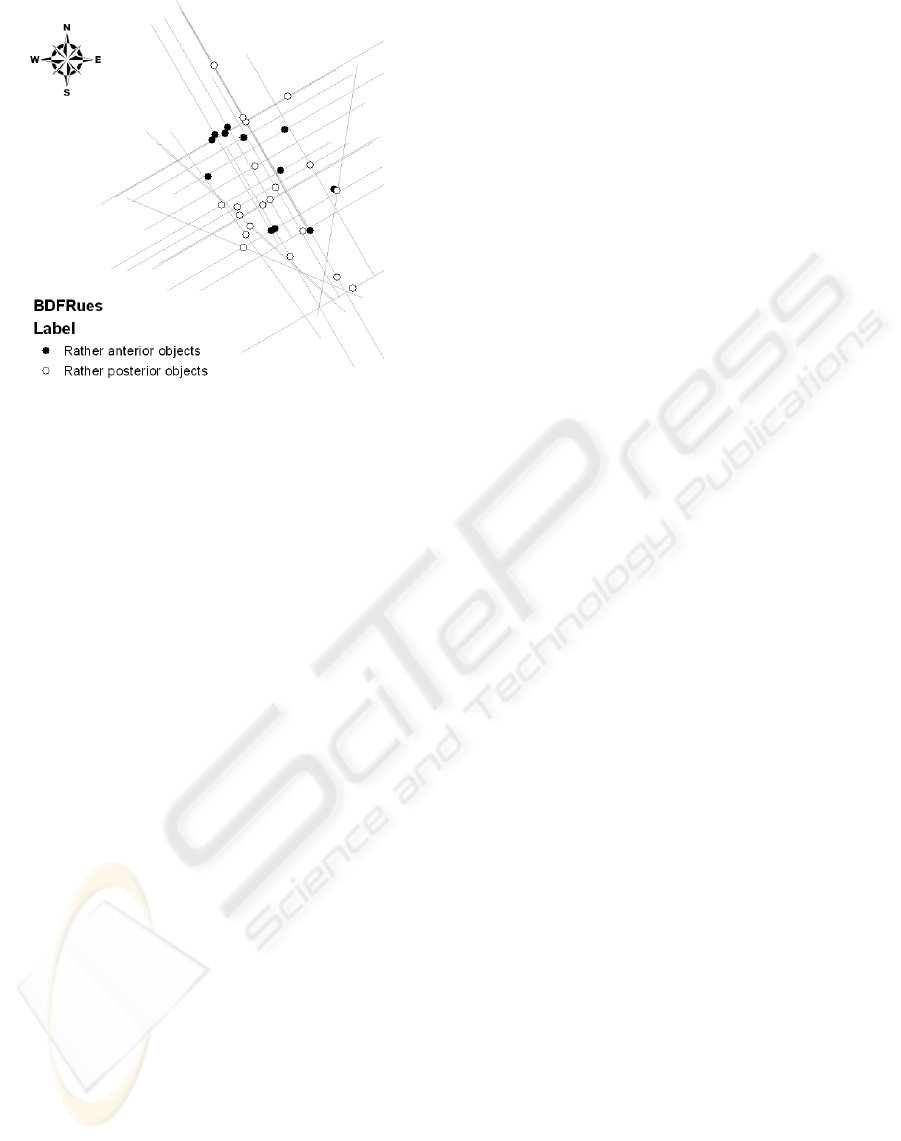
Figure 8: BDFRues objects grouped in “rather anterior” and
“rather posterior”.
According to the comparison between Figure 7
and Figure 8, we remark that the temporally median
object is a member of the “rather posterior” objects.
Moreover, considering that the anteriority index val-
ues between “rather anterior” objects and “rather pos-
terior” objects are very often close to 1, the bipolar-
ization of objects seems pertinent.
5 CONCLUSIONS
In this article, in order to analyze the temporal rela-
tions between archæological objects, we proposed a
new data mining process. It is based on the construc-
tion of a weighted oriented graph over the database
objects using the anteriority index values pairwise
linking all the objects. According to the graph, the
process computes the temporal index value for each
object and, using them, the temporal position of ob-
jects. By the visualization of results in a layer of a
GIS, the combination of spatial distribution and tem-
poral ranking facilitates the spatiotemporal analysis
of objects.
During the expertise, the archæologists estimate
the functions, the activity periods of objects which
are found in an excavation site. They need to study
the temporal relation between objects in databases in
order to (i) look if the temporal logic is respected and
(ii) analyze the city temporal evolution. Thus, in this
objective, the data mining process proposed in this ar-
ticle may be used.
REFERENCES
Chen, S.-H. (1985). Ranking fuzzy numbers with maximiz-
ing set and minimizing set. Fuzzy Sets and Systems,
17:113–129.
Conolly, J. and Lake, M. (2006). Geographic Information
System in Archaeology. Cambridge University Press.
de Runz, C., Desjardin, E., Piantoni, F., and Herbin, M.
(2007a). Management of multi-modal data using
the Fuzzy Hough Transform: Application to archae-
ological simulation. In Rolland, C., Pastor, O., and
Cavarero, J.-L., editors, First International Confer-
ence on Research Challenges in Information Science,
pages 351–356.
de Runz, C., Desjardin, E., Piantoni, F., and Herbin, M.
(2007b). Using fuzzy logic to manage uncertain multi-
modal data in an archaeological GIS. In International
Symposium on Spatial Data Quality - ISSDQ’07.
de Runz, C., Desjardin, E., Piantoni, F., and Herbin, M.
(2009). Anteriority index for managing fuzzy dates in
archaeological GIS. Soft Computing. Online.
Fortemps, P. and Roubens, M. (1996). Ranking fuzzy sets:
a decision theoretic approach. Fuzzy Sets and Systems,
82:319–330.
Jain, R. (1977). A procedure for multiple-aspect decision
making using fuzzy set. Internat. J. Systems Sci., 8:1–
7.
Kerre, E. E. (1982). The use of fuzzy set theory in electro-
cardiological diagnostics. In Gupta, M. and Sanchez,
E., editors, Approximate Reasoning in Decision-
Analysis, pages 277–282. North-Holland Publishing
Company.
Saade, J. J. and Schwarzlander, H. (1992). Ordering fuzzy
sets over real line: an approach based on decision
making under uncertainty. Fuzzy Sets and Systems,
50:237–246.
Wang, X. and Kerre, E. E. (2001a). Reasonable properties
for the ordering of fuzzy quantities (I). Fuzzy Sets anf
Systems, 118:375–385.
Wang, X. and Kerre, E. E. (2001b). Reasonable properties
for the ordering of fuzzy quantities (II). Fuzzy Sets anf
Systems, 118:387–405.
Wang, X., Kerre, E. E., Cappelle, B., and Ruan, D.
(1995). Transitivity of Fuzzy Orderings Based on
Pairwise Comparis. The Journal of Fuzzy Mathemat-
ics, 3(2):455–463.
Zadeh, L. A. (1965). Fuzzy Sets. Information Control,
8:338–353.
IJCCI 2009 - International Joint Conference on Computational Intelligence
52
