
EXPLORATIVE DATA MINING FOR THE SIZING OF
POPULATION GROUPS
Isis Peña and Herna Lydia Viktor
School of IT and Engineering, University of Ottawa, Ontario, Canada
Eric Paquet
Institute for Information Technology, National Research Council of Canada, Ottawa, Ontario, Canada
Keywords: Cluster analysis, Classification, Anthropometry, Interestingness measures-based data mining.
Abstract: In the apparel industry, an important challenge is to produce garments that fit various populations well.
However, repeated studies of customers’ levels of satisfaction indicate that this is often not the case. The
following questions come to mind. What, then, are the typical body profiles of a population? Are there
significant differences between populations, and if so, which body measurements need special care when
e.g. designing garments for Italian females? Within a population, would it be possible to identify the
measurements that are of importance for different sizes and genders? Furthermore, assume that we have
access to an accurate anthropometric database. Would there be a way to guide the data mining process to
discover only those body measurements that are of the most interest for apparel designers? This paper
describes our results when addressing these questions. To this end, we explore a database, containing
anthropometric measurements and 3-D body scans, of samples of the North American, Italian and Dutch
populations. Our results show that we accurately discover the relevant subsets of body measurements,
through the use of objective interestingness measures-based feature selection and feature extraction, for the
various body sizes within each population and gender.
1 INTRODUCTION
Apparel manufacturers develop sizing systems with
the goal of satisfying consumers’ needs for apparel
that fits. Sizing is the process used to establish a size
chart of key body measurements for a range of
apparel sizes. To produce garments that fit the
population, it follows that the sizes must correspond
to real grouping. However, this is often not the case,
as indicated by the results obtained by Shofield and
LaBat (Schofield and LaBat, 2005). Their study of
forty size charts for women’s clothing showed that
the different sizes are defined using arbitrary
constant intervals between sizes, all vertical
measurements increase as the size increases and that
the differences between the principal girths are
constant for all sizes. Considering this situation, it is
easily understandable that repeated studies of the
degree of satisfaction with apparel show that
consumers’ needs are not being met. For example, a
North American study found that about 50% of
women and 62% of men cannot find satisfactorily
fitting clothes (DesMarteau, 2000). According to
Ashdown et al. (Ashdown et al., 2007) two main
issues have limited the ability of the apparel
companies to produce garments with quality fit.
First, there has been a lack of up-to-date
anthropometric data to describe the civilian
population. Second, there is a lack of information
about the principal aspects to consider when
designing garments for a variety of body sizes and
shapes.
Recent work has, to some extent, addressed these
concerns. Anthropometric surveys such as the
CAESAR
TM
project (Rob et al. 02), SizeUSA
(SizeUSA, 2009) and SizeChina (SizeChina, 2009)
have been carried out on civilian populations. The
CAESAR
TM
project (Robinette et al. 2002) includes
several body measurements such as waist
circumference, hip circumference, height, weight,
etc. together with 3-D body scans of each
participant. In SizeUSA (SizeUSA, 2009) subjects
were scanned in 3-D, and the body measurements
152
Peña I., Viktor H. and Paquet E. (2009).
EXPLORATIVE DATA MINING FOR THE SIZING OF POPULATION GROUPS.
In Proceedings of the International Conference on Knowledge Discovery and Information Retrieval, pages 152-159
DOI: 10.5220/0002292601520159
Copyright
c
SciTePress

were then extracted from the 3-D scans. Similarly,
for SizeChina (SizeChina, 2009), the heads of a
large number of individuals were scanned in 3-D.
Some recent studies attempt to find the most
important aspects to be taken into account when
designing garments. Viktor et al. (Viktor et al.,
2006) finds body size groupings in a sample of the
North American male population. Veitch et al.
(Veitch et al., 2007) aim to produce a well fitting
bodice for Australian women. After selecting twelve
out of fifty-four measures and applying Principal
Component Analysis (PCA), they define thirty-six
categories: twelve sizes and three body shapes
within each size. Hsu et al. (Hsu et al., 2007)
identify three body types and thirty-eight sizes for
the female adult Taiwanese population by applying
PCA on eleven anthropometric measures.
Although the abovementioned work attempt to
address the problem of identifying the main aspects
that should be consider for the design of garments,
they only focus either on a specific body part, or on
a gender. Moreover, they do not account for the
economic factors of the data mining process.
Importantly, they do not attempt to find the subset of
body measurements with the highest utility within
this domain. That is, they fall to focus on obtaining
those measurements that would be of the most
interest when designing apparel for different sizes
within each population and gender. This paper
addresses this need for finding the optimal set of
body measurements using an interestingness
measure-based methodology.
Our goals are as follows. We aim to understand
the typical consumers’ body profile by identifying
the natural body size groups and their distinctive
characteristics. Also, we attempt to find the most
important body measurements that define each size,
and study how these measurements interrelate.
Importantly, we aim to reduce the cost of the mining
process, and the subsequent cost of apparel design,
by reducing the number of body measurements to be
used. To this end, we employ interestingness
measures to identify the minimal sets of body
measurements that are relevant for the different
sizes, within each population and gender. In this
way, we obtain reduced body measurements of high
utility, to be used to optimize apparel design.
The remaining of this paper is organized as
follows. Section 2 introduces the CAESAR
TM
anthropometric database, which contains subjects
from North America, Italy and the Netherlands.
Section 3 explains our methodology and results
when characterizing the populations. In this section,
we describe the cluster analysis of the
anthropometric measurements. In Section 4, we
present the approach followed when reducing the
number of body measurements, through the use of
interestingness measure-based feature selection
together with feature extraction. This section also
discusses the results obtained for the various body
sizes, within each gender and population.
Furthermore, we show how we evaluate our results
against current practice. Section 5 concludes the
paper.
2 THE CAESAR
TM
DATABASE
CAESAR
TM
is an anthropometric database
containing up-to-date information about European
and North American civilian populations (Robinette
et al. 2002). Anthropometric data refer to a
collection of physical dimensions of a human body.
This database includes traditional anthropometric
measurements of a large number of individuals from
North America, Italy and the Netherlands. The
numbers of anthropometric measurements are forty-
four (44) for the males, and forty-five (45) for the
females, since recording the under bust
circumference is not appropriate for the male
subjects. These measurements include height,
weight, acromial height, waist circumference, thigh
circumference and foot length, amongst others,
which were recorded by domain experts.
Additionally, the shape of each person was
scanned in three dimensions using a full body
scanner. That is, a laser scanning device measured
and recorded detailed geometry of the subjects’ body
surface. The 3-D body scans were described using a
global shape-based descriptor, which is an abstract
and compact representation of the three-dimensional
shape of the corresponding body. In essence, each
scan is represented by a set of three histograms,
which constitutes a 3-D shape index or descriptor for
the human body (Paquet et al., 2000). This index
characterizes the radial and angular distribution of
the surface elements associated with a given body,
and is designed to be orientation invariant and robust
against pose variation. In our experiments, we use
these 3-D scans to visually validate our
anthropometric data mining results. To this end, we
employ the Cleopatra system, which is able to
navigate through, and retrieve similar, 3-D scans
based on their 3-D shape (Paquet et al., 2000).
Since the goal of the CAESAR
TM
project was to
characterize the NATO countries, a stratified
sampling strategy was followed to ensure all the
groups of the population were equality represented.
Thus the population was sampled considering the
age, gender and race. However, in the sample of
EXPLORATIVE DATA MINING FOR THE SIZING OF POPULATION GROUPS
153
North America and Italy the number of subjects in
the minority groups is very small and therefore the
sample cannot be considered as representative of the
whole population belonging to these groups.
Moreover, for the Italian population there is a
substantial percentage of missing 3-D body scans.
The best sampling was obtained in the Netherlands,
where the number of subjects per strata is balanced
and the number of subjects in the minority groups is
well represented.
3 CHARACTERIZING THE
POPULATIONS
As stated earlier, one of the most important
challenges for the clothing industry is to produce
garments with quality fit. Poor fitting garments may
never be sold or customers may return them. In
order to produce better fitting garments, accurate
and up-to-date measurements need to be further
analyzed in order to be able to better characterize the
population (Ashdown et al., 2007). To address the
aforementioned issue, we aim to find the natural
body size groupings using the anthropometric
measurements and the 3-D shapes as contained in
the CAESAR
TM
anthropometric database. From
these groups we identify size archetypes and their
most important characteristics.
All our experiments are implemented in WEKA,
a collection of machine learning algorithms for data
mining tasks (Witten and Frank, 2005). In this study
we consider the American female population as well
as the Italian and Dutch, male and female
populations. (Interested readers are referred to
(Viktor et al., 2006) for a discussion of the results
obtained when analyzing the American male
population.)
The data was first separated based on the gender
of the subjects. The resulting sets consist of 256
American females, 413 Italian males, 388 Italian
females, 567 Dutch males and 700 Dutch females.
3.1 Cluster Analysis
In order to identify the natural body size groupings,
we first apply cluster analysis techniques to the
anthropometric data. Cluster analysis is an
unsupervised learning data mining technique used to
partition a set of physical or abstract objects into
subsets or clusters based on data similarity (Han and
Kamber, 2006, Witten and Frank, 2005).
In the context of tailoring, the ideal scenario is to
cover the greatest number of people with the fewest
number of sizes (Hsu et al., 2007). Therefore, we
aim to find the minimum number of clusters that
fully characterize the population. Since three clusters
is the minimum number that makes sense from a
tailoring point of view, i.e. small, medium and large,
we start partitioning the data into three clusters.
Then, by inspecting the cluster distribution we
decide whether is worthwhile to split the clusters, as
described in (Witten and Frank, 2005). This process
is repeated until the clusters appear well-defined.
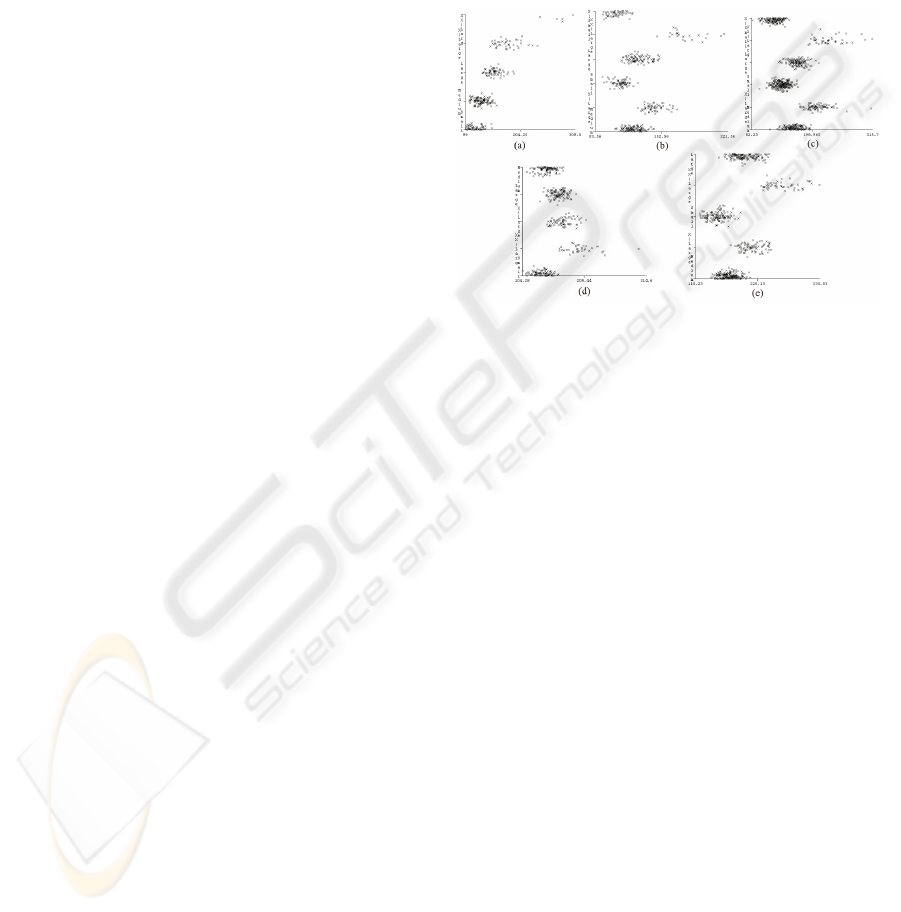
Figure 1: Cluster visualization for (a) American female
population, (b) Italian female population, (c) Dutch female
population, (d) Italian male population and (e) Dutch male
population. The y axis represent the clusters, the x axis is
the weight range.
For our cluster analysis experimentation, a
number of clustering algorithms were considered.
These included partitioning, hierarchical, density-
based, model-based and grid-based approaches. By
inspection of the cluster distribution and through the
analysis of the results using Cleopatra system, we
found that the American female population is best
characterized with five clusters. This is also the case
for the Italian and Dutch male populations, while the
Italian and Dutch female populations are better
characterized with six clusters. We also observed
that the best partition for the American female
population is achieved by the k-means algorithm,
while the best partition for the Italian and Dutch
both males and females is achieved using a density-
based algorithm with k-means components. The
clusters obtained with these algorithms are shown in
Fig. 1, where it may be observed that the clusters are
compact and well-defined.
We also visually validate the clusters produced
by using the Cleopatra system (Paquet et al., 2000),
as follows. The Cleopatra system enables us to
retrieve the 3-D body scans associated with each
subject in the CAESAR
TM
database. Each cluster
Centroid is used as a “seed”, and we proceed to find
the n most similar bodies, in terms of 3-D shape,
KDIR 2009 - International Conference on Knowledge Discovery and Information Retrieval
154
from the database. Here, n is user defined. The
similarity is measured using the Euclidian distance.
We determine whether the n nearest bodies fall
within the same anthropometric cluster. This extra
step allows us to double-check that the
anthropometric results also “make sense” for a 3-D
shape point of view.
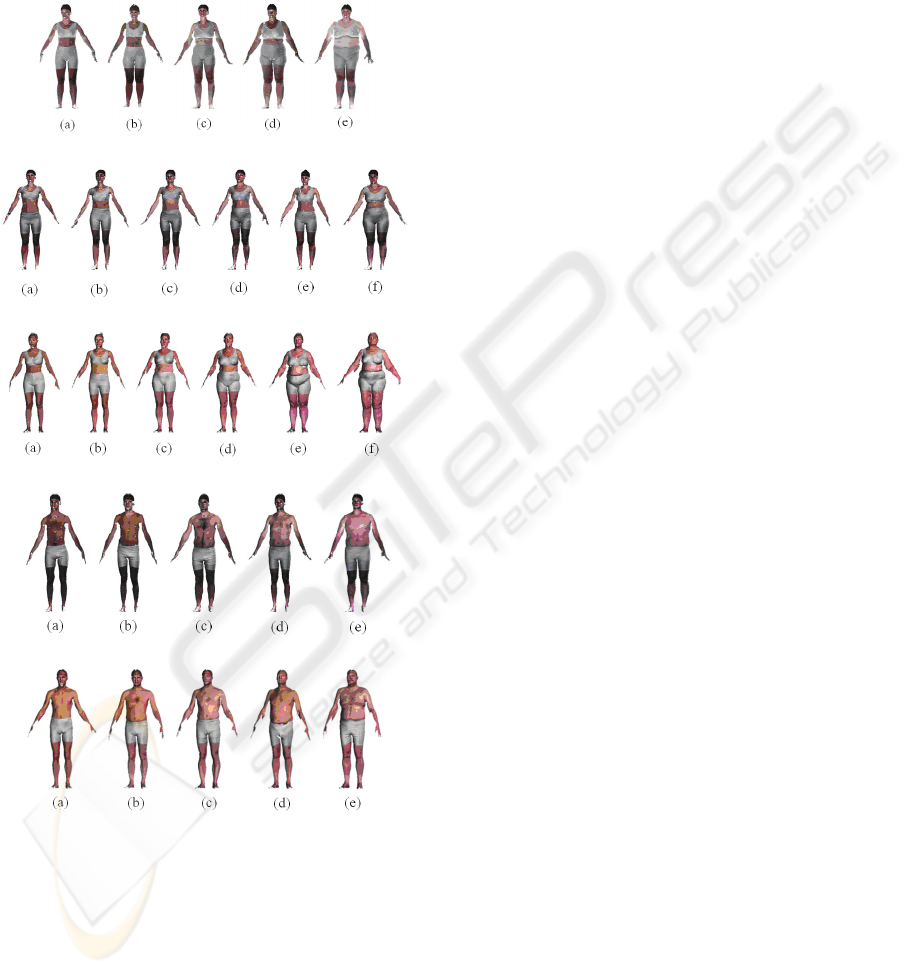
American females
Italian females
Dutch females
Italian males
Dutch males
Figure 2: Cluster Centroids for the five populations
ranging from smallest to largest Archetypes.
Figure 2 shows the 3-D body scans of the human
subjects that correspond to these measurements,
highlighting the difference in body types of the
clusters.
We proceed by inspecting the body measurement
of the Centroids of the various populations. We
consider the mean (in cm), the standard deviation,
and the number of subjects in each cluster. By
inspecting the body measurements of the Centroids,
the cluster distribution, and through the analysis of
the results using Cleopatra, we observe that the
anthropometric clusters do, indeed, discriminate
between the different body sizes.
3.2 Analysing the Populations
We next analyze the three populations of our study,
and discuss some similarities and differences for
both the male and female populations. In our
analysis, we consider the Centroids or archetypes,
since these are representatives of the other subjects
that belong to the same cluster.
In the analysis of the male population we also
consider the results for the American male
population as presented in (Viktor et al., 2006).
When considering the data, the next observations are
worth mentioning. Even though, the three
populations are described by five sizes, these are not
comparable, per se, to one another. For example, if
we consider the Small sizes for the Americans,
Italians and the Dutch, we observe the Italians are
considerably thinner, while both the Americans and
Dutch tend to be more robust. It may be seen, also,
that the tallest population is the Dutch, while the
shortest population is the Italians. Moreover, in the
three populations, the XX-Large subjects are shorter
than the X-Large subjects. This is an important
feature to consider when designing, for example,
pants; the legs should have short lengths for the XX-
Large size. Furthermore, if we examine the
measurements and height of the American and
Dutch archetypes of the corresponding sizes, we
observe that the range of measurements are similar,
but in general the Dutch are taller, making the
Americans the most robust population.
Regarding the female population, interesting
aspects are observed. Since the number of sizes for
the Americans is five, while for the Italians and
Dutch they are six, again we cannot compare them
directly. However, we observed that the Italians are
the thinnest and shortest population. We also
observe that the Dutch X-Small subjects are more
robust and taller than the American Small; the Dutch
size Small individuals have wider chests and hips,
and are taller than the American Medium. If we
continue in this way, it follows that the Dutch XX-
Large individuals are taller and more robust than the
American XX-Large, but surprisingly, the American
XX-Large subjects are taller and more robust than
the Dutch XX-Large. Moreover, we notice some
relationships among the different sizes of the three
populations. For instance, we notice the body
EXPLORATIVE DATA MINING FOR THE SIZING OF POPULATION GROUPS
155

Table 1: Measurement reduction results.
Original PCA Info Gain Gain Ratio χ
2
Consist. SS CFS Subset
American Female PART 75.8% 79.3%(15) 82.0%(24) 77.3%(11) 80.9%(27) 82.4% (8) 79.7%(25)
Ripper 76.6% 75.0% (10) 80.5% (19) 79.3% (19) 81.3% (12) 77.7% (13) 78.1% (25)
C4.5 76.2% 78.1% (5) 80.1% (6) 78.5% (7) 80.1% (8) 83.6% (8) 77.7% (21)
American Male PART 78.7% 76.8% (10) 82.6% (8) 81.2% (5) 82.6% (8) 83.1% (8) 80.0% (26)
Ripper 79.2% 76.3% (11) 82.9% (6) 81.2% (8) 82.9% (15) 79.7% (8) 78.7% (26)
C4.5 80.1% 74.6% (11) 83.8% (6) 81.9% (7) 83.1% (7) 84.5% (8) 79.5% (26)
Dutch Female PART 81.1% 80.4% (19) 83.9% (12) 82.3% (13) 84.7% (7) 83.1% (7) 81.9% (35)
Ripper 77.9% 77.3% (19) 83.4% (13) 82.9% (17) 82.7% (7) 81.3% (7) 81.9% (25)
C4.5 77.4% 77.4% (19) 82.9% (13) 83.3% (11) 82.7% (7) 81.7% (7) 79.3% (25)
Dutch Male PART 80.3% 82.9% (12) 82.7% (13) 82.2% (14) 81.1% (14) 80.3% (12) 81.3% (25)
Ripper 80.6% 81.5% (7) 81.3% (9) 82.4% (14) 81.3% (13) 82.0% (8) 80.3% (25)
C4.5 78.5% 82.0% (7) 81.8% (9) 82.2% (6) 80.6% (13) 80.4% (12) 80.3% (31)
Italian Female PART 78.1% 78.4% (18) 83.8% (7) 83.3% (10) 81.7% (7) 81.2% (12) 80.2% (24)
Ripper 75.8% 75.5% (7) 81.7% (7) 81.4% (7) 82.5% (8) 80.2% (8) 78.1% (31)
C4.5 76.8% 76.8% (12) 81.7% (5) 81.7% (8) 83.0% (6) 79.1% (12) 79.9% (24)
Italian Male PART 73.6% 80.9% (13) 82.1% (18) 82.1% (15) 81.1% (12) 79.7% (20) 78.7% (25)
Ripper 74.3% 83.3% (13) 78.5% (15) 80.2% (10) 77.5% (14) 78.9% (20) 78.0% (25)
C4.5 73.9% 81.4% (12) 77.0% (9) 78.2% (8) 76.3% (8) 75.8% (20) 76.3% (25)
measurements that correspond to the Dutch Large,
American X-Large and Italian XX-Large sizes are
very similar. Furthermore, the size Small of the
Dutch is comparable to the X-Large size of the
Italians. The Dutch seems to be larger than the
Americans for the smaller sizes, but the American
XX-Large resulted to be the tallest and most robust.
4 MEASUREMENT REDUCTION
Utility-based data mining accounts for the economic
aspects that impact the mining process, and aims to
maximize the utility of the process (Zadrozny et al.,
2006). In the previous section, we used in our
analysis the total number of body measurements.
Here, we aim to identify the measurements that
require special attention when designing garments.
Reducing the number of measurements aids to
increases the learning process efficiency, enhances
comprehensibility, and improves the learning
performance (Han and Kamber, 2006). To this end,
we perform two kinds of dimension reduction
techniques, namely feature selection and feature
extraction.
Interestingness measures are used in feature
selection to remove the attributes with little or no
predictive information (Kim et al., 2003, Geng and
Hamilton, 2006, McGarry, 2005). In our case study,
this means that we use interestingness measures to
identify the subset of the body measurements, which
is of most importance when describing an
Archetype. For feature selection we thus apply
Information Gain, Gain Ratio, Chi Squared, the
Consistency subset evaluator and the CFS subset
evaluator. These are measures have been widely
used in the context of feature selection and have
been found to produce good results (Cunningham,
2007). For feature extraction we use Principal
Component Analysis (PCA), a well-known feature
extraction method.
4.1 Results Obtained
In order to perform feature selection and feature
extraction, we first constructed a number of
classifiers, where the clusters we discovered during
the characterization phase acted as class labels. For
our experimentation, we consider three different
classifiers, namely RIPPER, C4.5 and PART.
The results of applying PCA and feature
selection on the anthropometric data for the
KDIR 2009 - International Conference on Knowledge Discovery and Information Retrieval
156

American, Italian and Dutch male and female
populations are summarized in Table 1. Shown are
the predictive accuracy and, in parenthesis, the
number of attributes in the subset.
For the American male population we observe
that the subsets produced by Information gain, Gain
Ratio, Chi Squared and Consistency subset evaluator
considerably improve the predicted accuracy with
less body measurements. This is especially evident
for the subset produced by the Consistency subset
evaluator, where the accuracy is higher than 83%,
when using PART and C4.5. This subset then
contains the eight most important measures to define
the body sizes for the male population.
When considering the American females, it may
be seen that the subsets obtained using Information
gain, Chi Squared and two subsets produced using
the Consistency measure significantly improve the
predicted accuracy. We also observe that the subsets
produced using the Consistency subset evaluator
contains, in average, a smaller number of body
measurements than the subsets produced using
Information gain and Chi Squared measures.
Moreover, the accuracy is maximized using one of
the subsets that contain only eight body
measurements.
We then select this subset as containing the most
significant body measurements to define the body
sizes for the American females. The reduced sets of
body measurements for the American population are
shown in Table 2.
The reduced set of measurements indicate that,
for the American males, the most important body
measurements are the acromial height and knee
height together with the length of the arm. Special
attention should be paid to the knee and acromial
heights when designing long or short pants, in order
to thus take the position of the knee into
consideration. Furthermore, the length of the arm is
important when designing shirts that fit this
population well. For the American females, the
circumference under the bust and the buttock knee
length become crucial when defining the body size.
Hence, when designing clothes for the American
females, the circumference under the bust should
receive more attention than other measurements that
are mainly used in garment design, such as the bust
circumference. Moreover, the subscapular skinfold,
a measurement of subcutaneous fat accumulation, is
considered in the reduced set of body measurements
for the American females. This confirms our
previous results that the Americans are the most
robust population.
We consider, next, the results of the Dutch
population. For the Dutch males, PCA and all
feature selection methods produce good results.
Table 2: Reduced Set of Anthropometric Body
Measurements for the American Population.
Males Females
Acromial Height Sitting Arm Length (Shoulder-Wrist)
Arm Length (Shoulder-Wrist) Arm Length (Shoulder-Elbow)
Arm Length (Spine-Wrist) Bust Circumference under Bust
Hand Length Buttock Knee Length
Knee Height Sitting Stature
Stature Subscapular Skinfold
Thumb Tip Reach Thumb Tip Reach
Weight Weight
Table 3: Reduced Set of Anthropometric Body
Measurements for the Dutch Population.
Males Females
Chest Girth at Scye Arm Length (Spine-Wrist)
Hip Breadth Sitting Bust Circumference
Stature Chest Girth at Scye
Vertical Trunk Circum. Stature
Waist Circumference Thumb Tip Reach
Weight Vertical Trunk Circumference
Weight
We observe that, in general; the highest accuracy is
achieved using the subsets produced by Gain Ratio
and PCA. Although PCA produces accurate results,
its application in a tailoring scenario presents
additional challenges, because PCA do not produce
a subset of the original attributes. Instead, PCA
produces a linear combination of the original set of
attributes, preventing the direct application of PCA
results in the tailoring process. We therefore select
the subset containing six attributes produced by Gain
Ratio, because this produces the best trade-off
between accuracy and the number of attributes.
When analyzing the results for the Dutch females,
the best results are obtained using Information Gain,
Gain Ratio and Chi Squared. These three
interestingness measures produced subsets that
highly improve the accuracy. However, the number
of attributes in the subsets generated by Information
Gain and Gain Ratio is larger than the number of
attributes in the subset produced by Chi Squared.
We therefore select the subset with seven attributes
produced by Chi Squared. The reduced sets of body
measurements for both males and females are
presented in Table 3.
For the Dutch males, the reduced set of
measurements indicates that the most significant
measurements are the waist circumference, the chest
girth at scye and the vertical trunk circumference.
When tailoring shirts, sweaters or jackets, for the
male population, these measurements should be
considered carefully to produce garments that fit this
population properly. For the Dutch females, the most
EXPLORATIVE DATA MINING FOR THE SIZING OF POPULATION GROUPS
157

important measurements are the bust circumference
and, as in the case of the males, the chest girth at
scye and the vertical trunk circumference. Therefore,
when tailoring clothes for the Dutch females, the
bust circumference requires special attention in
order to design garments that fit the population
better.
By inspecting Table 1 we observe that for the
Italian males, PCA and Gain Ratio produce the best
results. As mentioned previously, PCA presents
additional challenges when applying directly in the
garments design. We then select the subset
generated by Gain Ratio that maximizes the
accuracy. That is, the subset containing fifteen
attributes.
Table 4: Reduced Set of Anthropometric Body
Measurements for the Italian Population.
Males Females
Arm Length
(Shoulder-
Wrist)
Hip Circ Max Height
Arm Length
(Shoulder-Wrist)
Arm Length
(Spine-Wrist)
Knee Height Sitting
Arm Length
(Spine-Wrist)
Buttock Knee
Length
Stature Knee Height Sitting
Chest
Circumference
Thumb Tip Reach Stature
Chest Girth at
Scye
Waist Circumference Thumb Tip Reach
Crotch Height Waist Height
Vertical Trunk
Circumference
Hip Breadth
Sitting
Weight Weight
Hip
Circumference
For the Italian female population, we notice that
the subsets produced by Information gain and Chi
Squared significantly increase the accuracy. The
highest accuracy is achieved using the subset
generated by Information gain that contains seven
attributes. We therefore select this subset of body
measurements for the Italian female population. The
reduced sets containing the most important body
measurements for the Italian population are shown
in Table 4. For the Italian females, the reduced set of
measurements considers the vertical trunk
circumference and the knee height, which are
relevant when, for example, tailoring blouses, skirts
or pants. The vertical trunk circumference is
important when deciding what the length of a jacket
or a blouse should be, in order to produce garments
that are not too short or long for this population.
For the Italian males, the most important
measurements are the chest, waist and hip
circumferences along with the crotch, waist and hip
heights. The measurements, then, address both the
height and girths. This indicates that not only the
height, but also the chest, waist and hip
circumferences should receive special attention
when designing clothes for the Italian males. This,
again, confirms our results that the main
characteristics of the Italian population are related to
height and girths. That is, the Italians are the shortest
and thinnest population.
4.2 Considering Tailoring Practices
In this section, we contrast the results we obtained
during our analysis against the techniques that are in
use in the apparel industry. To this end, we consider
the process used when tailoring a jacket for a female
subject, as found in the literature (Aldrich, 2001,
Schofield and LaBat, 2005, A Suit that Fits, 2009).
When tailoring a jacket, a tailor is instructed to
measure the bust and vertical circumference, the
shoulder width, the arm length from the shoulder to
the wrist, and the length of the centre back to the end
of the jacket.
For illustrative purposes, we consider the results
obtained from the Dutch anthropometric
measurements. Recall, that our study has found that
the most important anthropometric measurements
for the Dutch female population is the chest girth at
scye (i.e. the girth right underneath the arms), the
arm length from the spine to the wrist (recorded
when the arm is bent and the hand rests in the waist),
the bust circumference, the stature, the thumb tip
reach and the vertical trunk circumference. When
comparing our results to current tailoring practices,
we observe the following. The measurements as
obtained by our system are more specific, in the
sense that, for a better fit, the curve of the jacket
sleeves are also taken into account. Similarly, for a
better fit, it follows that also considering the under
arm measurement will give a more comfortable fit
than when simply considering the bust
circumference. Interestingly, the thumb tip reach is
of importance when designing the jacket sleeve
length, to ensure, e.g. in protective clothing design
when handing hazardous materials, that movement is
not restricted when having to reach for an
instrument. Recall that for the Dutch females, the
Medium-sized individuals tend to be very tall with
long arms. This observation is contrary to current
tailoring practices, where the sizes are simply
constructed by increasing the measurements by a
constant value (Aldrich, 2001, Schofield and LaBat,
2005, A Suit that Fits, 2009). Our validation thus
KDIR 2009 - International Conference on Knowledge Discovery and Information Retrieval
158

confirms that our approach was able to correctly
identify the subset of measurements that is of
importance, which needs to be incorporated into
current practices to streamline clothing design.
5 CONCLUSIONS
One of the biggest challenges for the apparel
industry is to produce garments that fit the
customers properly and are aesthetically pleasing.
Better characterizations of our populations are thus
needed. Furthermore, the different sizes must
correspond to real body shapes, i.e. one or more
archetypes should represent the individuals
belonging to the same size accurately. In the context
of tailoring, however, the optimal scenario is to
cover the largest number of people with the fewest
number of sizes. Here, it is preferred to have only
one archetype, since each new size increases the
complexity in the manufacturing.
Our approach satisfies the aforementioned
requirements, since we were able to group the
individuals into clusters with a well-defined
Centroid. Our verification, when using the Cleopatra
system, indicates that the cluster membership
corresponds to the reality. Our results show that the
number of body measurements may be significantly
reduced by applying interestingness measure-based
feature selection and feature extraction. Moreover,
these new sets of reduced body measurements
improve the predictive accuracy. These sets contain
the most important body measurements for defining
the body sizes, and may be used in garment design
to identify those body measurements that require
special attention, when tailoring clothes for a
specific population and gender.
REFERENCES
Aldrich, W. (2001). Pattern Cutting for Women's Tailored
Jackets: Classic and Contemporary, Wiley-Blackwell
Publishing, Oxford.
Ashdown. S., Loker, S. and Rucker, M. (2007). Improved
Apparel Sizing: Fit and Anthropometric 3-D Scan
Data, Annual Report NTC Project: S04-CR01-07,
National Textile Center.
Cunningham, P. (2007). Dimension Reduction, Technical
Report UCD-CSI-2007-7, University College Dublin,
1–24.
DesMarteau K. (2000). CAD: Let the Fit Revolution
Begin, Bobbin, 42, 42-56.
Geng, L. And Hamilton, H. J. (2006). Interestingness
Measures for Data Mining: A Survey, ACM Comput.
Surv., 38 (3), 1-32.
Han, J. and Kamber, M. (2006). Data Mining: Concepts
and Techniques, Morgan Kaufmann, San Francisco.
Hsu, C.-H., Lin, H.-F. and Wang, M.-J. (2007).
Developing Female Size Charts for Facilitating
Garment Production by Using Data Mining, Journal of
Chinese Institute of Industrial Engineers, 24 (3), 245–
251.
Kim, Y. Street, W. N. and Menczer, F. (2003). Feature
Selection in Data Mining, Data mining: Opportunities
and Challenges, IGI Publishers, USA, 80–105.
McGarry, K. (2005). A Survey of Interestingness
Measures for Knowledge Discovery, Knowl. Eng.
Rev., 20 (1), 39–61.
Paquet, E., Robinette, K. M., and Rioux, M. (2000).
Management of three-dimensional and anthropometric
databases: Alexandria and Cleopatra. Journal of
Electronic Imaging, 9, 421–431.
Robinette, K. M., Blackwell, S., Daanen, H., Fleming, S.,
Boehmer, M., Brill, T., Hoeferlin, D., and Burnsides,
D. (2002). Civilian American and European Surface
Anthropometry Resource (CAESAR), Final Report,
Volume I: Summary. AFRL-HE-WP-TR-2002-0169,
United States Air Force Research Laboratory, Human
Effectiveness Directorate, Crew System Interface
Division, 2255 H Street, Wright-Patterson AFB OH
45433-7022.
Schofield, N. A. and LaBat, K. L. (2005). Exploring the
Relationships of Grading, Sizing and Anthropometric
Data, Clothing and Textiles Research Journal, 23 (1),
13–27.
SizeUSA (2009). The US National Size Survey,
http://www.sizeusa.com/.
SizeChina (2009). China National Sizing Survey,
http://www.sizechina.com/.
A Suit that Fits (2009), http://www.asuitthatfits.com.
Veitch, D., Veitch, L. and Henneberg, M. (2007). Sizing
for the Clothing Industry Using Principal Component
Analysis - An Australian Example, Journal of ASTM
International (JAI), 4 (3), 12 pp.
Viktor, H. L., Paquet, E., and Guo, H. (2006). Measuring
to fit: Virtual tailoring through cluster analysis and
classification. In PKDD 2006: Knowledge Discovery
in Databases, 395–406.
Witten, I. H. and Frank, E. (2005). Data Mining: Practical
Machine Learning Tools and Techniques, Morgan
Kaufmann, San Francisco.
Zadrozny, B., Weiss, G. and Saar-Tsechansky, M. (2006).
UBDM 2006: Utility-Based Data Mining 2006
Workshop Report, SIGKDD Explor. Newsl., 8(2), 98–
102.
EXPLORATIVE DATA MINING FOR THE SIZING OF POPULATION GROUPS
159
