
MULTIDIMENSIONAL INFORMATION VISUALIZATION
TECHNIQUES
Evaluating a Taxonomy of Tasks with the Participation of the Users
Eliane Regina de Almeida Valiati, Josué Toebe, Antonio Flávio Gomes, Milene Andréa Guadagnin
Leandro Luis Bianchi and João Roberto Telles
Faculdade de Tecnologia SENAC de Passo Fundo, Avenida Sete de Setembro n 1045, Passo Fundo, Brazil
Keywords: Information Visualization, Taxonomy of tasks, Usability evaluation.
Abstract: Multidimensional information visualization techniques has the potential to assist in the analysis and
understanding of large volumes of data by detecting patterns, clusters and trends which are not obvious,
when using non-graphical forms of presentation. When developing a visualization technique, the analytic
and exploratory tasks that a user might need or want to perform on the data should guide the choice of the
visual and interaction metaphors implemented by the technique. Usability tests of techniques for
visualization also need a clear definition of tasks of the user. The identification and understanding of these
tasks is a matter of recent research in the area of visualization of information and some works have
proposed taxonomies to organize them. This paper describes an experimental evaluation of a classification
based on the observation of different profiles of users performing tasks in exploratory data using
multidimensional visualization techniques.
1 INTRODUCTION
Techniques of visualization have been developed to
support the navigation, manipulation and
information extraction from large data sets.
The identification and understanding of the
nature of the tasks of the user in the process of
acquisition of knowledge in visual representations is
a matter of recent research in the area of
visualization of information (Stasko, 2006).
This article aims to present the evaluation of a
classification of tasks the user describing two
experimental procedures involving different user
profiles, reporting and discussing the different
results.
2 RELATED WORK
Weherend and Lewis (1990) and Springmeyer
(1992) in the early 90’s were among the first ones to
explicitly address user operations and tasks
characterizing the data analysis process in order to
facilitate the selection of adequate visual
representations.
With the goal of facilitating the choice of visual
representations, Weherend and Lewis (1990)
classified operations that a user might need to exe-
cute to analyze data.
Later on, Zhou and Feiner (1998) introduced
another categorization of tasks. They separated
presentation intents (goals a user has when using a
visual representation) from low-level visual
techniques (the exact operation performed on a
given object presented in the display) by means of
an intermediate level, the visual tasks.
Amar and Stasko (2004) proposed a new
taxonomy with higher level tasks, that can provide a
better support to visualization systems designers and
evaluators. In a very recent work, Amar et al. (2005)
proposed a taxonomy of 10 low level tasks based on
196 analytic questions found by students when
analyzing data with commercial visualization
systems.
3 TAXONOMY OF TASKS
This section presents the taxonomy of specific users’
tasks we used to guide the selection of tasks of our
experiment. The taxonomy was designed to support
the design of different scenarios for the evaluation of
multidimensional visualization techniques.
The taxonomy comprehends seven tasks:
identify, determine, visualize, compare, infer,
configure and locate. Five of these tasks can be
considered as goals a user might have when using a
311
Regina de Almeida Valiati E., Toebe J., Flávio Gomes A., Andréa Guadagnin M., Luis Bianchi L. and Roberto Telles J. (2009).
MULTIDIMENSIONAL INFORMATION VISUALIZATION TECHNIQUES - Evaluating a Taxonomy of Tasks with the Participation of the Users.
In Proceedings of the International Conference on Knowledge Discovery and Information Retrieval, pages 311-314
DOI: 10.5220/0002305903110314
Copyright
c
SciTePress
visualization technique for either visually exploring
or analyzing the data set through some statistics
(identify, determine, compare, infer and locate). The
other two tasks (visualize and configure) are typical
intermediate level tasks that support the analytical
ones.
4 EXPERIMENTS
This section describes two experimental procedures,
in which different profiles of users (actual and
experimental) used the same techniques for
visualization of information for the use of
multidimensional data.
The main objective of the experiments was to
identify the interactive tasks performed by users
during the data analysis and exploitation, and verify
that experimental procedures would be more
appropriate to evaluate the classification of tasks
consistently.
4.1 Visualization Techniques
In experiments used two different implementations
of techniques for geometric visualization. One of the
component implementations Xmdvtool package
(available at http://davis.wpi.edu/ ~ xmdv). The
other implementation is part of an application,
developed by Hoffman (1999) and his group,
available at (http://ivpr.cs.uml.edu/ ~ hoffman /).
4.2 Experiment I: Trial Users
In the first experiment were tested for interaction
with users 11 students of the discipline of HCI, the
Course of Computer Science.
4.2.1 Data Sets
The classical data set containing information about
American, Japanese and European cars
manufactured between 1970 and 1982 was used.
This data set was selected due to the familiarity
all the students would have with the domain,
facilitating the understanding of questions as well as
their accomplishment. Moreover, it has been used in
many data mining and visualization systems for
evaluation purposes, making easier further
comparison of results.
4.2.2 Procedure
Before the experiment, users received training
regarding the use of techniques. At the beginning of
the test of interaction, each user received a list
containing 4 high-level analytical issues to be solved
using two techniques of visualization and was
instructed to verbalize all actions taken and
problems encountered (“think aloud” method).
The experiments were conducted individually, in
the laboratory, in the presence of an observer noted
that the sequence of tasks involved in resolving each
issue.
Users were randomly selected to use two
techniques in alternating order, so that 5 users and
then used Radviz Parallel Coordinates (the
application of Hoffman) and 6 users using Parallel
Coordinates and then Matrix ScatterPlots (the
package Xmdvtool), totaling 22 comments.
Completed the tests of interaction, the scenarios
observed were compared to scenarios estimated by
the evaluator (ie, the sequences of tasks to achieve
the answers to questions).
4.2.3 Results
Looking up to the 88 real scenarios (8 real scenarios
performed by each of the 11 users in the solution of
the 4 questions) observed during this experiment and
comparing them to estimated scenarios was possible
to observe that independent of the techniques used
for all users execute the resolution of each issue
basically the same tasks, with very few variations.
The only differences relate to the way that the
iterative sequence of actions (subtasks) occurred
during the analysis and exploitation of data between
users.
Due to the exploratory and iterative nature in
search of solutions: the use of views and subsequent
analysis of data users conducted repeatedly return to
certain tasks, in different ways, in an attempt to
understand the issues and solutions proposed.
Considering all real scenarios, therefore, was to
perform all tasks of the proposed classification (see
Table 1) except the task "infer" which may not occur
due to the type of questions proposed to users.
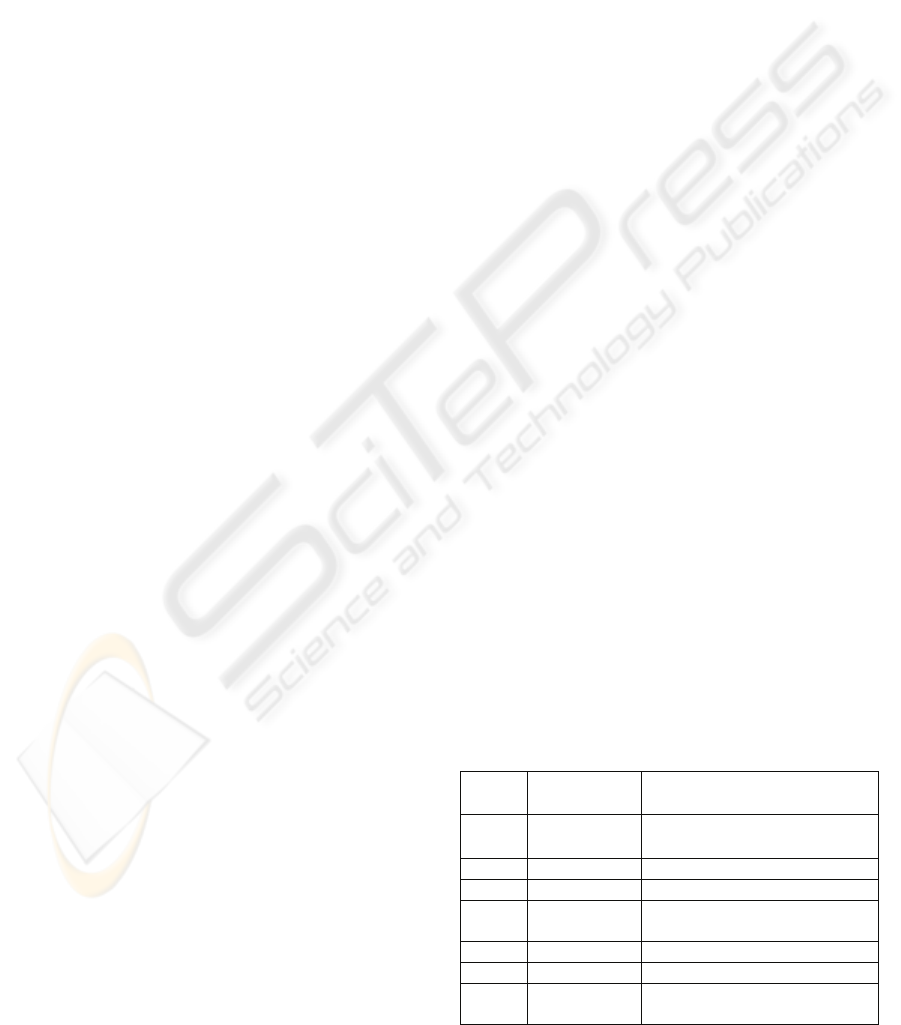
Table 1: Tasks observed by Experiment 1.
Tasks Number of
incidents per user
Types of incidents
Identify 9 groups, data distribution, similarities,
differences, patterns, correlations.
Determine 1 values, average
Visualize 7 n dimensions, n items, data
Compare 3 groups, data, figures, graphics primitives
(color, shapes, sizes)
Infer 0
Configure 8 Filtering, primitive graphics
Locate 4 items, data, figures, groups, primitives
graphics
KDIR 2009 - International Conference on Knowledge Discovery and Information Retrieval
312
4.3 Experiment II: Real User
The second experiment was a case study involving
one geographer that work in a research project
related to Urban Area Sociospatial Diagnostic. He
was an expert user in Geography domain and having
also a good experience in information analysis
activity.
The main goal of user in this case study was to
verify the relation between socioeconomic data
about habitation, employment, education level and
revenue of boroughs and residential areas of a city.
4.3.1 Data Sets
The data set for this case study have appertained to
researcher herself, containing socioeconomical data.
The data set used had 241 items and 12 dimensions.
4.3.2 Procedure
We use the same methodology for all longitudinal
case studies, according guidelines for MILCs
described in (Shneiderman, 2006), focusing on
participatory observation and interviews, like
adopted by (Seo, 2006). Nevertheless, for clarity, we
describe betimes the main proceedings for each case
study.
Before the beginning of experiment (the data
analysis), each user was trained on visualization
techniques to be used.
There was no a priori rigid and fixed protocol
defined for users behaviour: the number of meetings
with experimenter, the time of observation, data sets
for analysis and also the high-level analytical
questions for data exploration were defined by the
users themselves, as answers to real work questions.
Likewise, we requested for each user to use the
visualization techniques as far as he hasn’t seen any
additional understanding about the data in analysis
(considering the number of meeting with
experimenter and the time of duration each session).
During the sessions (always occurring weekly
with the presence of experimenter), each user was
observed and stimulated to speak (“think aloud”
method) while doing data analysis and exploitation
using visualization techniques.
After the session end, all the registers were
reorganized in order to allow a better analysis of
collected data..
The case study had 5 user-experimenter
meetings, completing 12 observation hours. In the
first meetings, user have used the Parallel
coordinates and then ScatterPlots Matrix (from
Xmdvtool package), and for the remainder the
techniques available in Hoffman’s application.
4.3.3 Results
Through the analysis of records made in each
meeting, the information collected were categorized
into: 23 high-level analytical issues, different
instances of tasks and subtasks.
Therefore, during the process of visual analysis
and exploration of data, the user made several
analytical issues related to the factors observed.
Examples of high-level analytical issues, which
could be observed and recorded, one can cite: (1)
"What is the profile of the neighborhood X? Which
districts have a similar profile?” (2) Are there
significant socioeconomic differences between
neighborhoods and lots?".
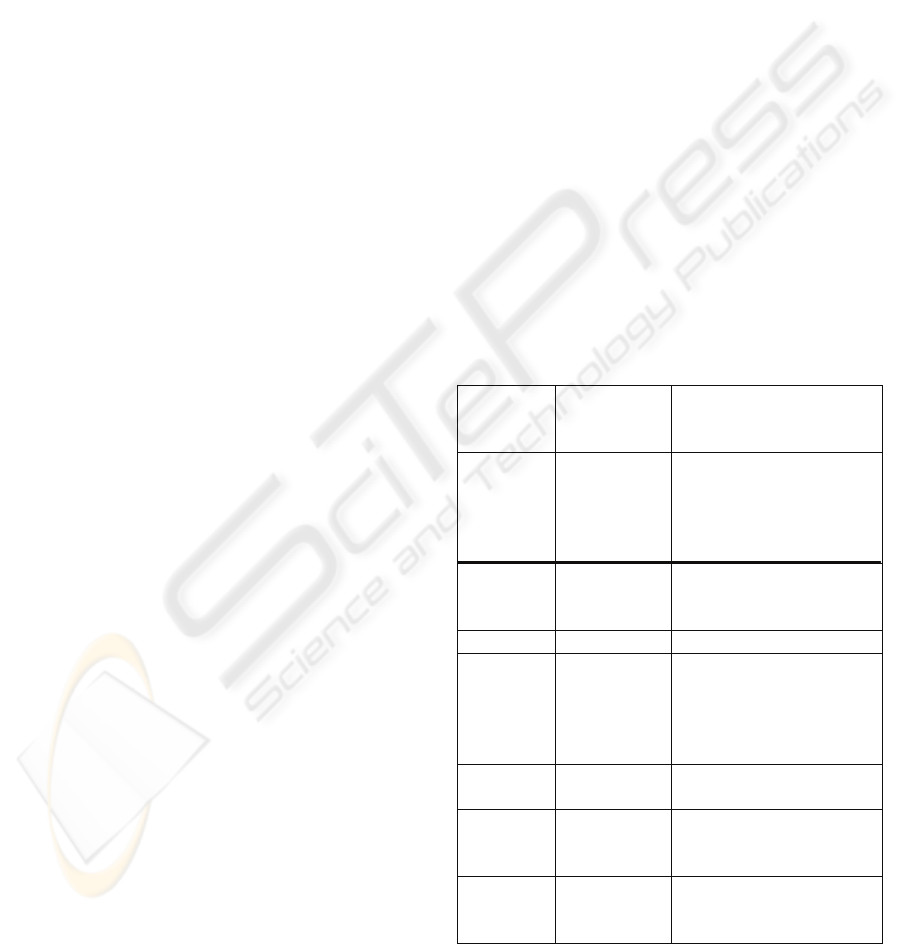
Table 2 summarizes the observations with
respect to the tasks performed, verifying that the
tasks of greatest occurrence were, respectively,
Configure, Visualize. Compare and Identify as the
resolution of almost all the tasks / issues analytical
high-level they appear many subtasks at different
times and levels.
There is also the various types of occurrences of
each task, which in this experiment were to detect
possible.
Table 2:Tasks observed by Experiment 2.
Number of
incidents per
user
Types of incidents
Identify 59 groups, correlation,
properties, characteristics,
similarities, differences,
dependency, independence,
changes in data
Determine 16 values, average, variance,
range, amounts, proportions,
differences, probability
Visualize 81 n dimensions, n items, data
Compare 55 dimensions, items, data,
figures, groups, properties,
proportions, positions,
distances, primitive graphics
(color, shapes, sizes)
Infer 17 hypotheses, rules, trends,
probabilities, causes / effects
Configure 83 rating, filtering, zoom, order
of size, attributes derived,
primitive graphics
Locate 47 items, data, figures, groups,
properties, positions,
distances, primitive graphics
MULTIDIMENSIONAL INFORMATION VISUALIZATION TECHNIQUES - Evaluating a Taxonomy of Tasks with the
Participation of the Users
313

5 DISCUSSION OF RESULTS
AND CONCLUSIONS
The two experiments reported were designed to
identify tasks performed by users during the data
analysis and exploitation, and verify that
experimental procedures would be more appropriate
to evaluate the classification of tasks consistently.
Thus, in each experiment were different profiles of
users (actual and experimental) and fields (data set
and contexts of use). In common, several techniques
were used visualization of multidimensional and
different implementations of the same techniques.
Tasks the user could be observed through the
two experiments. However, by the Experiment 2 it
was possible to observe greater number of tasks,
number and type of occurrences of each task,
certainly, because of the type of user involved and
the procedures adopted in this experiment.
The experiment 1 was based on four questions of
analysis proposed by the evaluators to users.
Already the results of experiment 2 were obtained
with a considerable body of 23 high-level analytical
questions, formulated by the user through the
process of exploration and analysis of their data.
Still, despite the different situations in terms of area
and issues of analysis, tasks were not detected in the
classification proposed not only new occurrences of
the same tasks. Moreover, except for "infer" in
experiment 1, all tasks of classification were
observed in real situations of use, which indicates
that they are necessary for the performance of the
analytical process by users.
However, tests of interaction and case study
showed that different results can be obtained when
actual users (experts in the field of data ) are
involved in the assessment in comparison to
experimental users (not specialists).
This study is an effort to systematize the process
of evaluating the usability of visualization
techniques, whereas part of this process should be
focused on the specification of tests of interaction
covering the diversity of tasks that users of this class
of systems must perform.
As future work is to conduct experiments with
new procedures based on field studies, as used in
experiment 2 and strongly suggested in
(Shneiderman, 2006), including other areas, so it is
possible to identify high-level analytical issues that
address consequently, different tasks and using
different techniques for viewing data, and different
implementations of the same techniques for viewing.
REFERENCES
Amar, R., Stasko, J., Knowledge Task-Based Framework
for Design and Evaluation of Information
Visualizations, Proc. IEEE Symposium on Information
Visualization (2004), 143-149.
Amar, R., Eagan, J., Stasko, J., Low-Level Components of
Analytic Activity in Information Visualization. Proc.
IEEE Symposium on Information Visualization (2005),
111-147.
Hoffman, P.E. Table Visualization: A formal Model and
Its Aplications. Computer Science Dept., University of
Massachusetts at Lowell, 1999 (Doctoral
Dissertation).
Stasko, J. Evaluating Information Visualizations: Issues
and Opportunities. Proc. BELIV’06 – Beyond Time
and Errors: Novel Evaluation Methods for Information
Visualization - a Workshop of AVI’06, (2006), 5-8.
Seo, J. and Shneiderman, B. Knowledge discovery in high
dimensional data: Case studies and a user survey for
the rank-by-feature framework. IEEE Trans. On
Visualization and Computer Graphics 12, 3
(May/June, 2006), 311-322.
Shneiderman, B., The Eyes Have It: A Task by Data Type
Taxonomy for Information Visualization, IEEE
Symposium on Visual Languages, 12, (1996), 326-343.
Shneiderman, B., Plaisant, C. Strategies for Evaluating
Information Visualization Tools: Multi-dimensional
In-depth Long-term Case Studies. Proc. BELIV’06 –
Beyond Time and Errors: Novel Evaluation Methods
for Information Visualization - a Workshop of
AVI’06, (2006), 38-43.
Springmeyer, R., Blattner, M. and Max, N.L., A
characterization of the scientific data analysis process,
Proc. IEEE Visualization’92, IEEE Computer Society,
(1992), 235 – 242.
Weherend, S., Lewis, C. A Problem-oriented
Classification of Visualization Techniques. Proc.
IEEE Visualization’90. IEEE Computer Society
(1990). 139-143.
Zhou, M., Feiner, S. K., Visual Task Characterization for
Automated Visual Discourse Synthesis, Proc. CHI’98
Conference, ACM Press, (1998), 392-399.
KDIR 2009 - International Conference on Knowledge Discovery and Information Retrieval
314
