
A Hybrid Multi-Experts Methodology for Mechanical
Defects’ Detection and Diagnosis
Kurosh Madani
1
, Moustapha Sene
2
and Véronique Amarger
1
1
Images, Signals, and Intelligent System Laboratory (LISSI/ EA 3956)
PARIS-EST/ PARIS 12 University, Senart Institute of Technology
Avenue Pierre Point, Lieusaint, 77127, France
2
Gaston Berger University, UFR SAT, Route de Ngallèle, BP 234 Saint-Louis, Sénégal
Abstract. Compared with parametric classifiers, several advantages set Neural
Networks as privileged approaches to be used as discriminating classifiers in
performing diagnosis tasks. In this paper, we present a hybrid Multi-Experts
neural based architecture for mechanical defects’ detection and diagnosis. This
solution is evaluated within vibratory analysis frame using a wavelet transform
faults’ detection scheme.
1 Introduction
Monitoring of mechanical systems requires development of adapted procedures com-
patible with the operation ranges (shapes) of the monitored devices. Generally, be-
haviours analysis is associated to a set of signals (called also signatures of the moni-
tored effects”). An example of such signatures could be obtained from chemical or
physical characteristics of materials composing the monitored mechanical devices or
involved in their operational phases, as: current, lubricant viscosity, acoustical signa-
tures, etc. For bearing defects, these signatures are characterized by transitory phe-
nomena (repetitive or random) due to the shocks’ effect on the structures. Such signa-
tures compile the frame of the vibratory analysis. A number of previous works show
that vibratory analysis issued signatures include pertinent information about mechani-
cal devices’ worsening [1], [2]. Note that conventional approaches of signal process-
ing don’t permit to exploit this information in its totality especially if the related sig-
natures are not periodical signals [3].
The general frame of the present work deals with early faults’ detection in indus-
trial plants, especially with mechanical faults’ detection in turning machines. For the
turning machines, the main faults which could be diagnosed through vibration analy-
sis are: imbalance, misalignment, looseness, shaft, bearing and gear damages, cavita-
tions in pumps, turbulent flows in ducts, foundation problems and electrical faults [4].
An additional difficulty related to the above-mentioned defects is due to the fact a
large part of mechanical devices in a turning machine are inaccessible, because they
are generally located inside the machine. Concerning inaccessible mechanical de-
vices, the vibratory analysis issued techniques show attractive features because they
may detect vibratory effects of internal devices from a global vibratory signature.
Proceedings of ICINCO 2009
6th International Conference on Informatics in Control, Automation and Robotics
Copyright © INSTICC
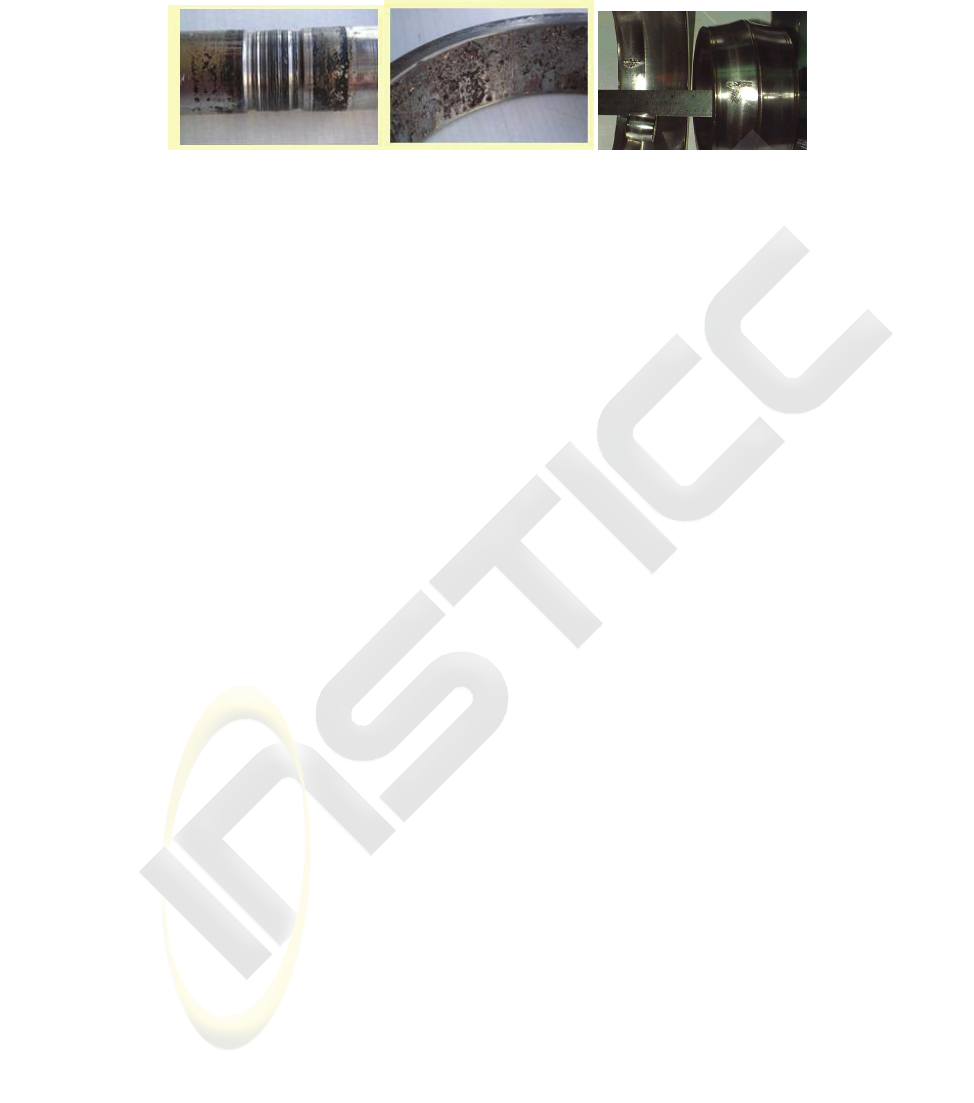
Fig. 1. Examples of “Unbalanced Force Defect’s” effect on turning plant’s rotation axis (left)
and “Flaking Path Defect” in a bearing device (middle and right).
We propose different slant, associating wavelet transform, vibratory analysis (be-
cause of the aforementioned advantages) and Artificial Intelligence issued approach-
es. In fact, beside the vibratory analysis issued techniques’ advantages, wavelet trans-
form could act as some kind of “zoom” effect (multi-resolution capability) in order to
separate appropriated frequencies’ components (those related to potential faulty be-
havior) from monitoring signal’s of others components. On the other hand, artificial
intelligence is used for classification tasks (fault’s nature authentication). Taking
advantage from neural networks’ based classifiers and their learning and generaliza-
tion [5], [6], these techniques are applied for characterizing bearings deterioration.
The two bearing device defects’ categories we are interested in this paper are: “Un-
balanced Force Defect” (UFD) and “Flaking Path Defect” (FPD). Fig. 1 shows exam-
ples of the impact of such defects on turning plants’ mechanical devices. A compara-
tive study between our hybrid technique and two neural network based architectures,
Radial Basis Function (RBF) network and Learning Vector Quantization (LVQ) net-
work, has been presented.
The paper will respect the following structure: the next section will briefly present
wavelet base defect detection within the vibratory analysis frame. The section 3 will
present the “expert-fusion” based classification approach: a key part of the proposed
solution. Section 4 and its subsections will give validation results and discussion.
Finally, the last section will conclude the paper and give a number o perspective
points.
2 Vibratory Analysis and Wavelet based Defects’ Detection
The detection procedure is based on the analysis of the minor (details) components of
the vibratory signature’s wavelet transform: the occurrence of a shock in the vibratory
behaviour is highlighted by the amplitude of the wavelet coefficients. The procedure
includes four steps:
1. Determining the needed resolution corresponding to the wavelet coefficients
ensuring the shocks’ detection,
2. Computing of detail (minor) wavelet transform coefficients,
3. Computing of indicators’ values relative to the vibratory signal,
4. Defect’s severity characterization by comparing the indicators’ values to a set
of knowledge based thresholds values.
The vibratory signature’s wavelet transform based processing opens the possibility
of a “multi-bands” vibratory analysis (e.g. multi-resolution detection), involving
several frequency bands. Thus, the proposed detection procedure could be run for
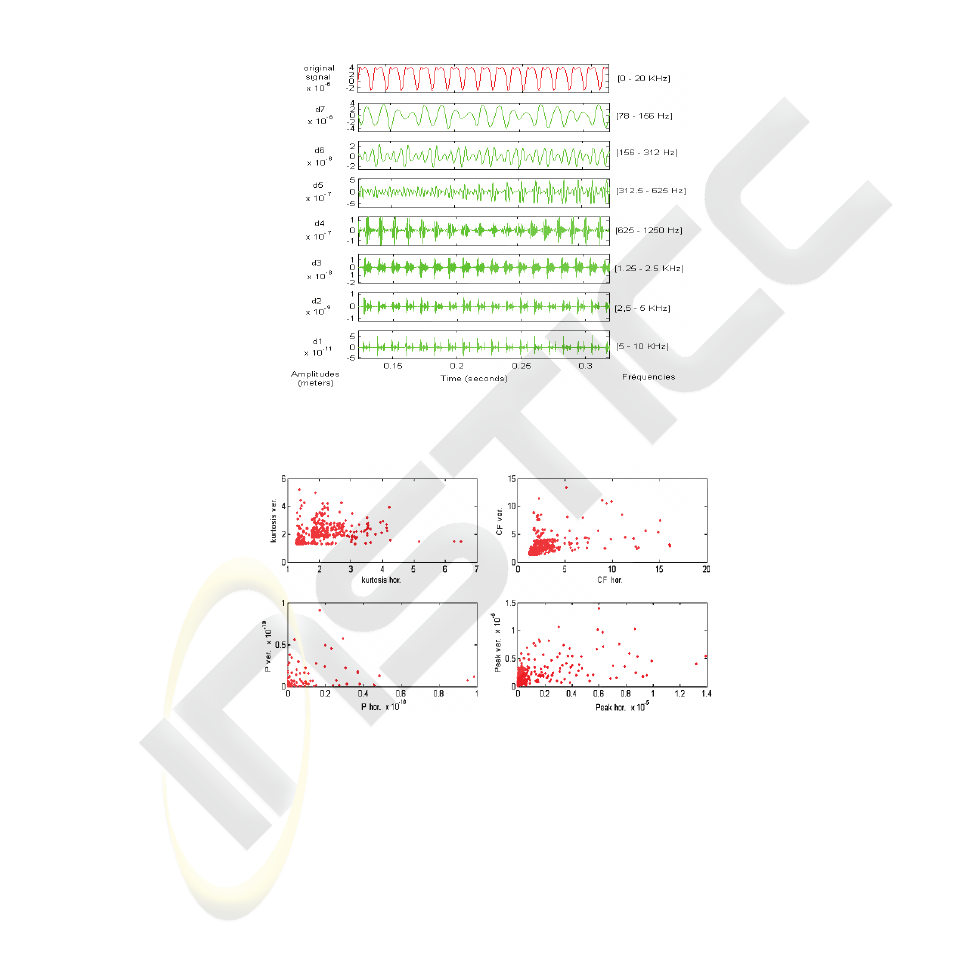
each of the obtained spectrum ranges (detail) [7], [8], [9], [10]. Fig. 2 shows an ex-
ample of obtained bands from an electromechanical turning machine issued vibratory
signature. The presence of one or several defects results in the apparition of new
frequencies. Detection of these new frequencies allows distinguishing potential
glitches, to classify them according to their typological features (unbalanced force
defect, flaking path defect, etc.) and to warn their consequences.
Fig. 2. Wavelet decomposition of a vibratory signal corresponding to flaking path defect (depth
157µm) at speed of 1500 rpm with wavelet sym7.
Fig. 3. Representation of the set of descriptions.
Concerning indicators, various scalar indicators as energy (E), peak, crest factor
(CF), power (P), root mean square (rms), shape factor (SF) and kurtosis (kur) [10]
[11] [12] could be valuable markers to define a “Multi-Features Vector” (MFV)
which will be used as input for the classification unit. Concerning bearing devices
such MFV are constructed for two directions of involved forces: horizontal and verti-
cal.
T
Pj
FeatureFeatureFeatureFV ],,,,[M
1
""=
(1)

],,,[M kurSF,rmsPCF,peakE,FV =
(2)
The analysis of data relative to the monitored plants’ faulty or healthy operational
modes in such feature spaces (defined on the basis of the constructed MFV) is a cru-
cial point in defining classes’ reparability boundaries and rules in order to make the
classifier’s action more accurate. Fig. 3 shows the data representation corresponding
to different aforementioned indicators in a bi-variables feature subspace constructed
from horizontal and vertical components of those indicators. It shows the possibility
to identify appropriated shapes of corresponding to healthy and deficient behaviours
of the concerned mechanical device (here a bearing device). So, if the classification
task is of major importance in the proposed technique, the choice of pertinent indica-
tors (via the above-mentioned data analysis in indicator’s issued feature space) and a
reliable detection (performed here by using a wavelet based multi-resolution ap-
proach) are two other strong points in our technique.
3 Multi-Experts based Classification
The classification strategy we propose is based on Multi-Experts principle also
known as “Mixture of Experts” based approach. In such class of processing strategy
the final output (the treatment’s result) is constructed (obtained) from a set of local
models (experts) which are specialized (devoted) either to a specific processing task
or to a specific region of the processed problem’s feature space. The final result is
obtained from a fusion of local models’ outputs or from a decision policy involving
either the whole experts or a reduced number (a subset) of specialized processing
units.
Fig.4. Single-Expert ANN based classifier.
It should be noted that the outputs’ fusion operation is not exclusive (specific) to
Multi-Experts schemes and may be used as a resource to perform the decision task.
An example is depicted in Fig.4 where a 3-categories classification, performed using
a single artificial neural network, takes advantage from a decision to carryout the
final classification. The decision policy could involve either matching rules or combi-
nation policy to construct the final decision.
In our approach, the proposed scheme is a Multi-Expert neural based classifier in-
cluding three neural networks (operating as local features’ classification modules)
where the final output (classification result) matches three possible turning plant’s
Class 1
Input x(n)
Neural
Network
COMBINATION
UNIT
y
2
(n)
Class 2
Class 3
y
1
(n)
y
3
(n)
operational categories. Two among those three categories correspond to a faulty bear-
ing device and one to a healthy bearing device meaning a “Normal” state (N) of the
concerned mechanical device. The two bearing device defects’ categories are “Unbal-
anced Force Defect” (UFD) and “Flaking Path Defect” (FPD), respectively. The
decision unit operates on the basis of combinatory matching rules in order to carryout
a unique class (category) among the three above-mentioned possible categories.
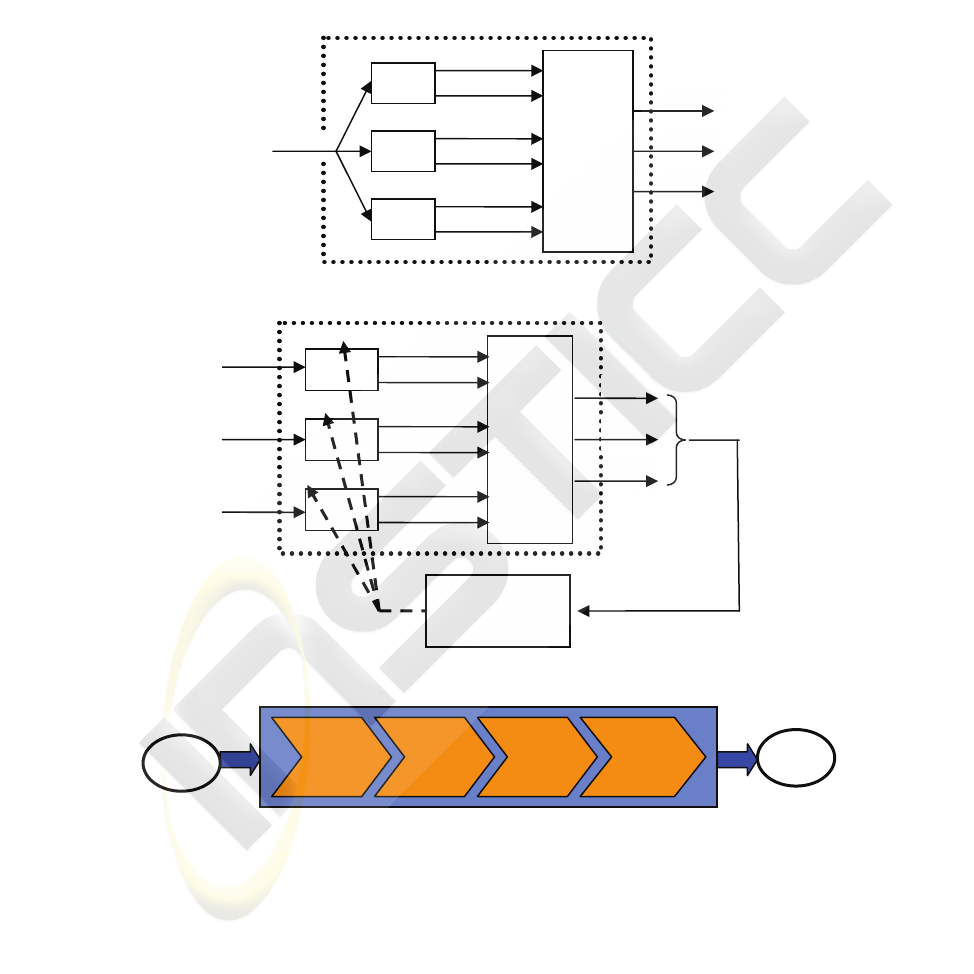
Fig. 5. Multi-Expert ANN based classifier’s bloc-diagram.
Fig. 6. Training scheme of Multi-Expert ANN based classifier.
Fig. 7. Global bloc-diagram of the proposed solution.
Concerning the experts, each of them is specialized in matching between two classes:
one of them is concerned with FPD and N classes’ discrimination, the other deals
with the classification of UFD and N functioning categories and the last one distin-
guishes between FPD and UFD classes of bearing defects. Fig. 5 gives the classifier’s
bloc diagram. The neural based classifier’s knowledge construction is done over a
PROPOSED SOLUTION
Defect
Diagnosis
Signa-
tures
Signals’
Processing
Fault
Detection
Behavior
Classification
Knowledge
Exploitation
Input 1
Class 3
Input 3
y
1
(n)
y
2
(n)
Input 2
ANN
2
FUSION
UNIT
Class 1
Class 2
ANN
3
ANN
1
y
3
(n)
y
4
(n)
y
5
(n)
y
6
(n)
Learning
Mechanism
Class 3
y
5
(n)
y
6
(n)
y
3
(n)
y
4
(n)
y
1
(n)
y
2
(n)
Input
ANN
2
FUSION
UNIT
Class 1
Class 2
ANN
3
ANN
1
training process involving each of the three neural networks separately. Fig. 6 gives
the learning mode’s bloc diagram. Two kind of local neural network based experts
have been implemented and compared: Learning Vector Quantization (LVQ) neural
structure and Radial Basis Function (RBF) neural model. The global bloc-diagram of
the proposed solution is shown in Fig. 7.
4 Validation, Results and Discussion
4.1 Experimental Set-up and Protocol
The experimental protocol for validation of the above-described automated diagnosis
chain has been based on detection and diagnosis (authentication) of the two afore-
mentioned defects in SKF-6002 bearing device. Table 1 gives topological and dy-
namical characteristics of the SKF-6002. So, three operational categories (classes)
have to be detected and
recognized: the normal class, the unbalanced defect class and
the flaking path defect class (correspondent to a diagnosis of the defect detected
which is being a failing of the flaking path of the outer race). According to the previ-
ously identified indicators, a training database containing 1594 MFV has been con-
structed, including a number of MFV corresponding to each possible class. The ratio
of each class in the learning database is reported in table 2. The same table gives the
ratio of each class within the testing database which includes 798 MFV. The two
kinds of above-described defects are present with different degrees of impairment as
well in learning database as in testing one. Concerning the unbalance forces’ related
defects, the considered rotation axis dislocations correspond to misbalancing forces
covering 10 to 100 g.cm. While, the flaking paths defects correspond to fissures of
280 μm average deep and a varying width covering the range of 30 to 910 μm.
Table 1. Technical and geometrical features of deep grove ball bearing SKF-6002.
4.762 mm
18.738 mm
28.262 mm
20
μ
m
3 μm
2
μ
m
6 N
0.6, 1.0 and 2.4 k
g
200 Ns/m
9
8
π/4
Constant for Hertzian contact elastic deformation
(
k
)
7,055.10
9
N/m
3/2
Ball diameter
Inner race diameter (
d
)
Outer race diameter (
D
)
Radial clearance (
γ
)
Maximum amplitude of waviness (
Πp
)
Initial amplitude of waviness (
Πo
)
Radial load (
W
)
Mass of rotor (
m
)
Damping factor (
c
)
Number of balls (
Nb
)
Number of wave lobes (
N
)
Angular location (
S
)
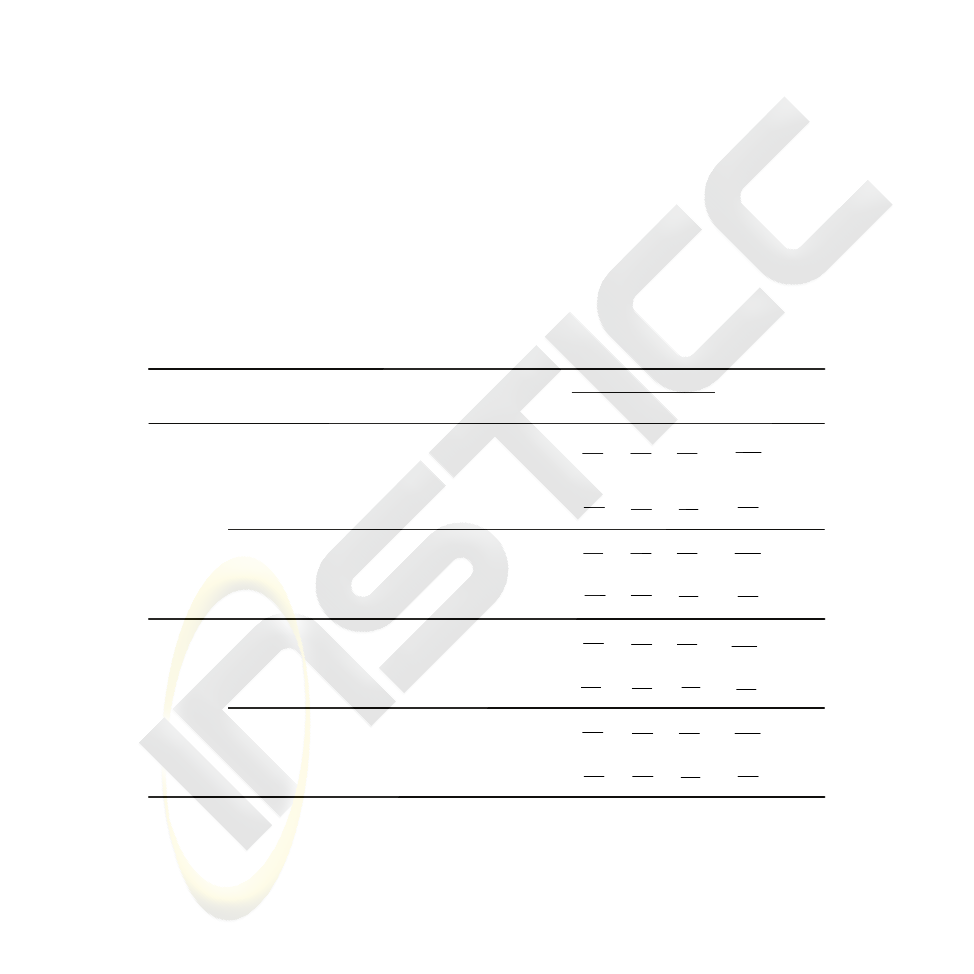
Table 2. Number of Multi-Feature Vectors (MFV) used in training and testing phases as well
as the ratio of signatures: healthy, unbalanced defect and flaking path defect (%).
Number of MFV Normal Unbalanced force Flaking path defect
1594 (for training) 34.6 29.9
35.5
798 (for testing) 49.9 30.1 20.0
For validation experiments we have considered two following cases: a detec-
tion/authentication chain based with a single neural network classifier and our hybrid
multi-experts scheme. As well for the single neural network based classifier as for the
hybrid solution, two kind of neural models (LVQ-like neural net and RBF-like
model) have been implemented.
4.2 Experimental Set-up
Table 3 summarizes results relative to obtained performances using single neural
network based scheme. For each kind of classifiers different MFV have been consid-
ered. The considered MFV are composed by previously introduced (in section 2)
scalar indicators measures in horizontal and vertical directions. They differ in number
of components (number of indicators composing the MFV). The number of compo-
nents varies from 4 (corresponding to horizontal and vertical measures of 2 indica-
tors) to 14 (corresponding to same measures of 7 indicators) and defines the number
of neurones of the input’s layer. The output layer of each neural classifier contains 3
neurons corresponding to the 3 possible operation categories.
Table 3. Performances of the single neural network based classifier – plant’s rotation speed is
400 rpm.
566
405
477
78
551
494
240
55
160
81
398
362
% 41,62
798
498
=
% 29,61
1594
977
=
160
112
240
222
398
299
% 32,79
798
633
=
566
542
477
426
551
371
% 00,84
1594
1339
=
566
539
477
388
551
446
% 14,86
1594
1373
=
160
97
240
206
398
297
% 19,75
798
600
=
551
450
477
427
566
561
% 21,90
1594
1438
=
160
145
% 21,82
798
656
=
240
213
398
298
Generalization
Memorization
Generalization
Memorization
Generalization
Memorization
Generalization
Memorization
Sequences of
observations
RBF
LVQ
Neural
Network
Type
16024039814
56647755114
1602403984
5664775514
16024039814
56647755114
1602403984
5664775514
FDRUDRNR
Average
Detection Rate
Correct Detect RateNumber of Data Sets
N UFD FPD
Dimension
of Input
Vector
Generalization
Memorization
Generalization
Memorization
Generalization
Memorization
Generalization
Memorization
Sequences of
observations
RBF
LVQ
Neural
Network
Type
16024039814
56647755114
1602403984
5664775514
16024039814
56647755114
1602403984
5664775514
FDRUDRNR
Average
Detection Rate
Correct Detect RateNumber of Data Sets
N UFD FPD
Dimension
of Input
Vector
In the same way and considering the same MFV, Table 4 gives the obtained results
for hybrid Multi-Experts chain. The local neural experts are RBF-like neural net-
works.
It is interesting to note from Table 3 that in the case of RBF-like single neural net-
work based classifier the generalization (e.g. testing) using MFV including 2 indica-
tors (e.g. 4 components) performs better results than those obtained with a 7 indica-
tors MFV (e.g. 14 components). This could be explained by the fact that considering

more indicators leads to increase the input feature space dimensionality for a same
number of learned (representative) patterns and thus, the RBF-like classifier (which
operates on the basis of a patters’ distance issued matching policy) has to map a lar-
ger feature space with the same number of learned patterns. While the same table
shows that LVQ-like neural classifier leads to quite similar (rates of defects’ correct
detection and classification between 75 and 80 %) either using MFV including 7
indicators or exploiting 2 indicators MFV (even if the obtained results are slightly
better when 7 indicators are used). This is due to the conjunction of two facts. The
first one is related to the fact that in LVQ-like neural model the matching is obtained
in “competitive layer” of such network performing a “Winner Takes All” (WTA)
policy. In fact, the two defects’ categories as well as the healthy operational state are
matched essentially on the basis of two (among seven) indicators, but as the matching
is obtained from a WTA based decision policy (excusive decision), the increase of the
input feature space’s dimensionality remains of a limited effect on classification per-
formance. Beside this first factor, another reason avoiding the classification rate de-
creasing here is related to the fact that the major data is discernible enough regarding
the above-described matching policy in 2-D feature space obtained from the first two
indicators. The similar performances obtained with RBF-like classifier (82% correct
classification) when 2 indicators are used confirms this purpose
Table 4. Performances of the Multi-Experts based classifier – plant’s rotation speed is 400
rpm.
1602400ANN
3
89,730240398ANN
2
1600398ANN
1
Generalization
4 indicators
5664770ANN
3
92,71 %0477551ANN
2
5660551ANN
1
Memorization
4 indicators
FDRUDRNR
Average
Detection Rate
Individual
Average
Detection
Correct Data Rate
Number of Data Sets
N UFD FPD
RBF architecture
1602400ANN
3
89,730240398ANN
2
1600398ANN
1
Generalization
4 indicators
5664770ANN
3
92,71 %0477551ANN
2
5660551ANN
1
Memorization
4 indicators
FDRUDRNR
Average
Detection Rate
Individual
Average
Detection
Correct Data Rate
Number of Data Sets
N UFD FPD
RBF architecture
477
419
566
559
% 77,93
1043
978
=
477
455
% 32,92
1028
949
=
566
566
% 03,92
1117
1028
=
551
462
160
145
398
324
% 05,84
558
469
=
160
159
240
211
% 50,92
400
370
=
398
360
% 63,92
638
591
=
551
494
240
231
However, the slightly better results obtained with RBF architecture with MFV includ-
ing 2 indicators (4 components) seems to privilege the use of this neural classifier
against in spite of the LVQ based classifier. That is why the Multi-Experts architec-
ture has been implemented including three RBF networks. Results are reported in
Table 4. It is pertinent to note the significant enhancement of classification rate. Fig.
8 completes the results of the two last tables by giving learning and generalization
performances versus the number of involved (exploited) indicators. If Fig. 8-a con-
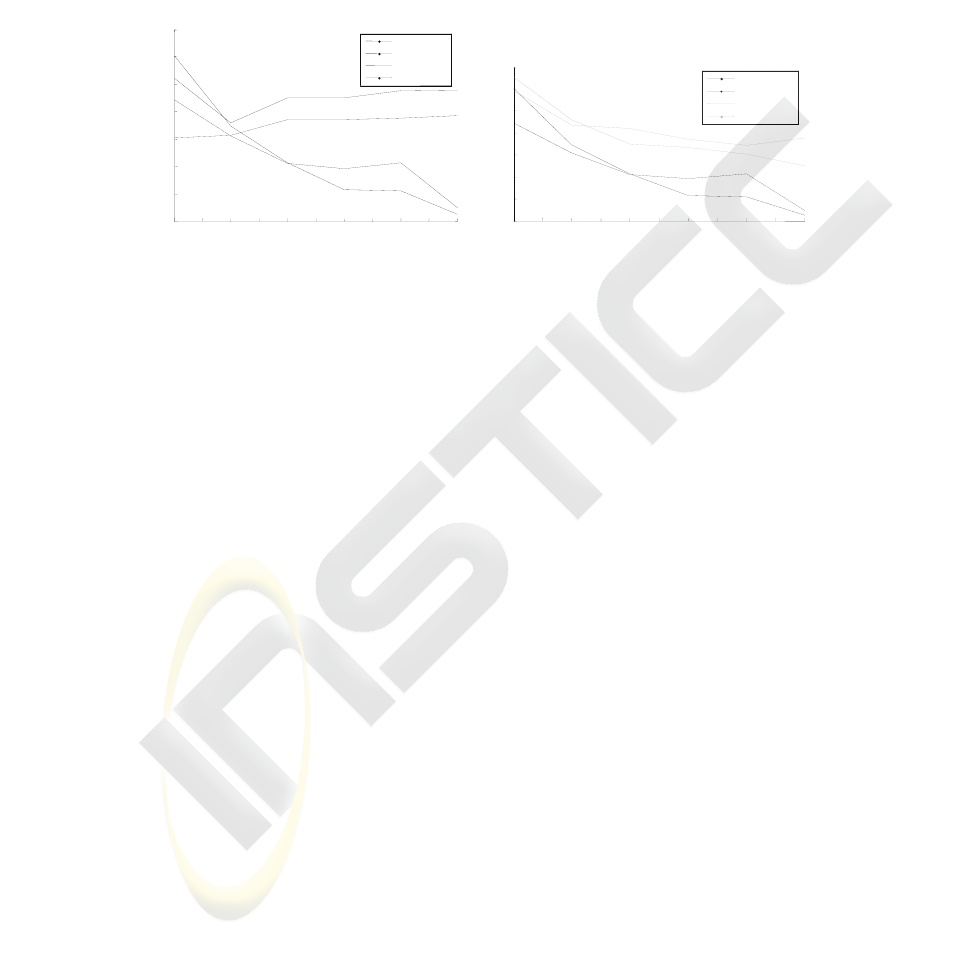
firms the results consequences of the first table (Table 3), the second (e.g. Fig. 8-b)
reveals an additional interesting point. In fact it is interesting to note the enhancement
of classification rate as well when a 4 component MFV is exploited as when the input
MFV includes 14 components (a 15% classification rate increasing). That shows the
experts’ mixture strategy’s pertinence (efficiency).
(a)
4 5 6 7 8 9 10 11 12 13 14
60
65
70
75
80
85
90
95
Number of indicators in inputs vector
Average Detection Rate (%)
Global configuration of classifier
Memoriz. RBF
Generiz. RBF
Memoriz. LVQ
Generiz. LVQ
4 5 6 7 8 9 10 11 12 13 14
60
65
70
75
80
85
90
95
Number of indicators in inputs vector
Average Detection Rate (%)
Global configuration of classifier
Memoriz. RBF
Generiz. RBF
Memoriz. LVQ
Generiz. LVQ
(b)
4 5 6 7 8 9 10 11 12 13 14
60
65
70
75
80
85
90
95
Number of indicators in inputs vector
Average Detection Rate (%)
Based Configuration on the mixture of experts
Global RBF mem.
Global RBF gen.
Mixture RBFmem.
Mixture RBF gen.
4 5 6 7 8 9 10 11 12 13 14
60
65
70
75
80
85
90
95
Number of indicators in inputs vector
Average Detection Rate (%)
Based Configuration on the mixture of experts
Global RBF mem.
Global RBF gen.
Mixture RBFmem.
Mixture RBF gen.
Fig. 8. Performances of training and generalization versus number of involved features for
single neural network based classifier (a) and Multi-Expert solution (b).
5 Conclusions and Perspectives
We have presented a hybrid Multi-Experts neural network based architecture for
mechanical defects detection and authentication in turning plants, which are mas-
sively present in industrial production chains. The pertinence of the experts’ mixture
strategy has been shown and validated. On the other hand, the advantage of a wavelet
transform based multi-resolution detection leads to capability of simultaneous detec-
tion of different kind of mechanical defects. Finally, the use of vibratory analysis
technique make possible the inaccessible mechanical devices’ monitoring from a
global vibratory signature obtained from relatively low cost standard sensors.
Acknowledgements
Authors whish express their gratitude to Dr. Michel Barret, keeping his name alive.
Dr. M. Barret have worked during several years within this project and unfortunately
leave us after his last battle against a long diseases.
References
1. N. Tandon, A. Choudhury, “A review of vibration and acoustic measurement methods for
the detection of defects in rolling element bearings”, Trib. Internat. 32, p. 469-480, (1999).
2. S. P. Harsha, “Non linear dynamic response of a balanced rotor supported on rolling ele-
ment bearing”, Elsevier, Apr. (2004)

3. Juez, G. I. Sainz, E. J. Moya and J. R. Peran, Early detection and diagnosis of faults in an
AC Motor, Bio-Inspired Applications of Connectionism (J. Mira and A. Prieto (Ed.)), Lec-
ture Notes in Computer Science Series, Spinger Verlag, pp. 595-602, (2001)
4. Z. Chen, Y. He, F. Chu, J. Huang, “Evolutionary strategy for classification problems audits
application in fault diagnostics”, Pergamon, Engineering Applications of Artificial Intelli-
gence 16, p. 31-38, (2003)
5. R. P. Lippman, “An Introduction to Computing with Neural nets”, IEEE ASSP Magazine,
pp. 4-22, April (1987)
6. A. Boulenger, C. Pachaud, “Vibratory analysis in plants’ monitoring, maintenance and
diagnosis”, 2
nd
edition, Dunod, Paris, (2004) - (in French)
7. G. Zwinggelstien, “La maintenance basée sur la fiabilité, guide pratique d’application de
la RCM ”, Hermès, Paris, (1996) - (in French).
8. M. Barret, A-S Dujardin, V. Amarger, K. Madani, J-F. Durastanti, “Mechanical faults
recognition using wavelet transform and artificial neural network techniques”, in “Com-
puter Information Systems and Industrial Management Applications”, Ed. K. Saaed & al.,
Conradi Research Review, ISBN 83-87256-55-2, pp. 243-251, (2003)
9. J. Anoni, R.B. Randal, The spectral kurtosis: application to the vibratory surveillance and
diagnostics of rotating machines, Elsevier, Mechanical Systems and Signal Processing,
(2004)
10. J. P. Don, F. Bolaers, L. Rasolofondraibe, Optimization of the detection of rolling bearing
defects using spectral subtraction de-noising of the signal, Elsevier, pp. 213-219, (2003)
11. Z. Kiral, H. Karagulle, Simulation and analysis of vibration signals generated by rolling
element bearing with defects, Tribology International 36, p. 667–678, Elsevier, (2003)
