
DESIGN OF A HAND DYNAMOMETER FOR TESTING
AND ANALYSIS OF HAND FUNCTIONS
Wan-Seok Ryu, Se-Jong Ahn, Seung-Yong Kang, Sung-Taek Chung
Department of Computer Engineering, KPU, Siheung-si, Gyeonggi-do, Korea
Han-Soo Kang, Hyu-Jeong Kim
Foretek Co., Ltd., Seonjin Bldg., #35-11, Samsung-dong, Gannam-gu, Seoul, Korea
Keywords: Hand functions, Handgrip strength, Rehabilitation.
Abstract: The primary purpose of this study was to analyze quantitatively the degree of injury and/or the progress of
treatment for physical impairment. This study provided a more detailed study that evaluates all test
parameters including maximum grip strength, duration of operation, average grip strength, acceleration
work, dynamic endurance time and percent change in static endurance. In addition, a complete database
management system is developed and used to store related training, evaluation, and personal information.
Designed device in this paper developed a grip sensor using loadcell transducer (≤60kg). The system will
be efficient to operate and convenient to use, furthermore, it can be helped for understanding and analysis
the progress of a patient during a doctor’s rehabilitation program.
1 INTRODUCTION
The functions of hand are one of the important parts
of our body that performs a lot of function in our
lives. Therefore, hand injury including slight and
acute injury such as distortion, bruise, fracture,
occupational injuries, and amputations can seriously
affect our life. To recovery from these injuries,
latent risk due to the patient’s detail information
should be considered prior to the treatment to set a
plan and goal of following treatment.
In addition, studies on hand function have
reported that aging also affect hand function and
reduce an amount of muscles. According to
(Mathiowetz, Kashmand and Volland, 1985),
reliable and valid evaluation of hand strength is of
importance in measuring hand function and
evaluating patient’s ability to return to employment.
(Gallery and Foster, 1985) presented that injured or
diseased hand decreases its muscular strength and
therefore it should be recovered rapidly.
Furthermore, measurement of muscular strength
prior to treatment is necessary procedure of
evaluating states of patient, especially, when it is
damaged by neurological disease, musculoskeletal
system disorder or other factors. In addition, hand
grip strength is used to diagnose the symptom of
rheumatoid arthritis, chronic fatigue syndrome,
developmental disabilities, muscular dystrophy and
pakinson’s disease (Innes, 1999; Andria,
Attivissimo, Giaquinto & Sasanelli, 2006). (Bassey
and Harries, 1993) reported a 2% loss of grip
strength per year for men and women older than 65
years old. As described, studies on handgrip strength
have been studied in various fields. To measure
handgrip strength, various facilities and equipment
have been developed for each purpose. Those
include analog and digital types of equipment.
Generally, digital type is preferred in order to get an
accurate result. Due to this importance and
requirement, generally, JAMAR’s digital hand
dynamometer is widely known and used to measure
handgrip strength. However, functions of this system
are only able to display real time variation and
maximum value of handgrip strength. Thus, there
has been a limitation of evaluating complex hand
function only using the values from the existing
system.
In this paper, we have developed software that is
able to evaluate and analyze the quantitative degree
of injury, disorder, etc. We have also developed grip
155
Ryu W., Ahn S., Kang S., Chung S., Kang H. and Kim H. (2010).
DESIGN OF A HAND DYNAMOMETER FOR TESTING AND ANALYSIS OF HAND FUNCTIONS.
In Proceedings of the Third International Conference on Biomedical Electronics and Devices, pages 155-158
DOI: 10.5220/0002589801550158
Copyright
c
SciTePress
sensor using load-cell transducer (≤60kg) to measure
real time for various functions of hand.
Acquired data using this system are able to help
not only clinical studies but also effectively
performing rehabilitation training and determining
realistic treatment goals according to improvement
of the measured value.
2 MATERIAL AND METHODS
2.1 System Block Diagram
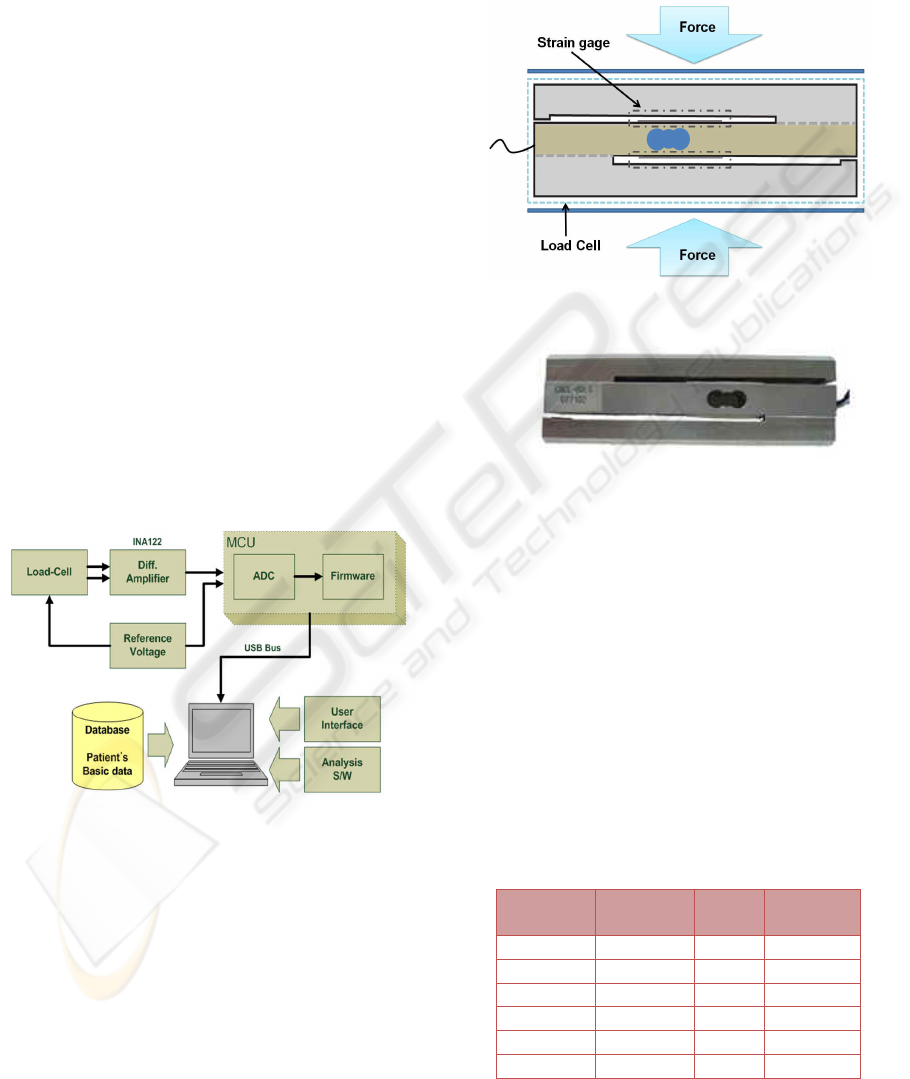
Figure 1 shows the proposed system block diagram.
Applied pressure to a load-cell changes into analog
signals and the system transfer it to a MCU (a micro
control unit) through an INA122 (a differential
amplifier). These signals are converted to digital
signals by a ADC (an analog to digital converter)
then, firmware of the MCU transfer the converted
value to a personal computer(PC), which consist of a
database to manage user information, a friendly user
interface to display real time variation and software
to analyze data. As it is required to preserve a same
potential difference between load-cell and the MCU,
we operated the system with 3V voltage reference
and applied it to both the load-cell and the MCU.
Figure 1: A system block diagram.
2.2 Design of Grip Sensor
The configuration of the grip sensor and a prototype
sensor are shown in Figure 2 and Figure 3,
respectively. We set a range of the prototype sensor
as 0~60kg±0.1kg, which is capable of measuring a
grip strength of an adult. Applied strength to load-
cell turns into resistance through strain gage inside
of the dotted line shown in Figure 2. Strain gage,
generally, consists of Wheatstone bridge circuit;
variation of output voltage depends on variation of
input voltage according as changing of the resistance
value. However, the output signal of load-cell is
very weak, we amplified the signal through an INA
122. The amplified signals were sampled at an
interval of 100ms.
Figure 2: A configuration of grip sensor.
Figure 3: A prototype sensor using load-cell.
As we applied 3V voltage reference to ADC
input, ADC level was 614. At this time, we
amplified the signal 450 times through the INA122
to get an approximately 5mV/level of the ADC.
For
instance, when 1kg of grip strength is applied, the
ADC level is approximately 10 including an error
range of 0.1kg.
For a reliability of relative error of the load-cell,
we measured given pressure to the load-cell using 1,
2, 5, 10, 20, 40kg balanced weights and results is
shown in table 1. We set up a unit pressure as
9.2N/kg, which is a mean pressure resulted from
calibration process.
Table 1: Measured and corrected value of load-cell with
balanced weights.
Balance
Weight (kg)
Measured
Value (N)
N/kg
Correction
Value (N)
1 9.6 9.6 9.2
2 18.6 9.3 18.4
5 44 8.8 46
10 89 8.9 92
20 184 9.2 184
40 386 9.4 376
BIODEVICES 2010 - International Conference on Biomedical Electronics and Devices
156
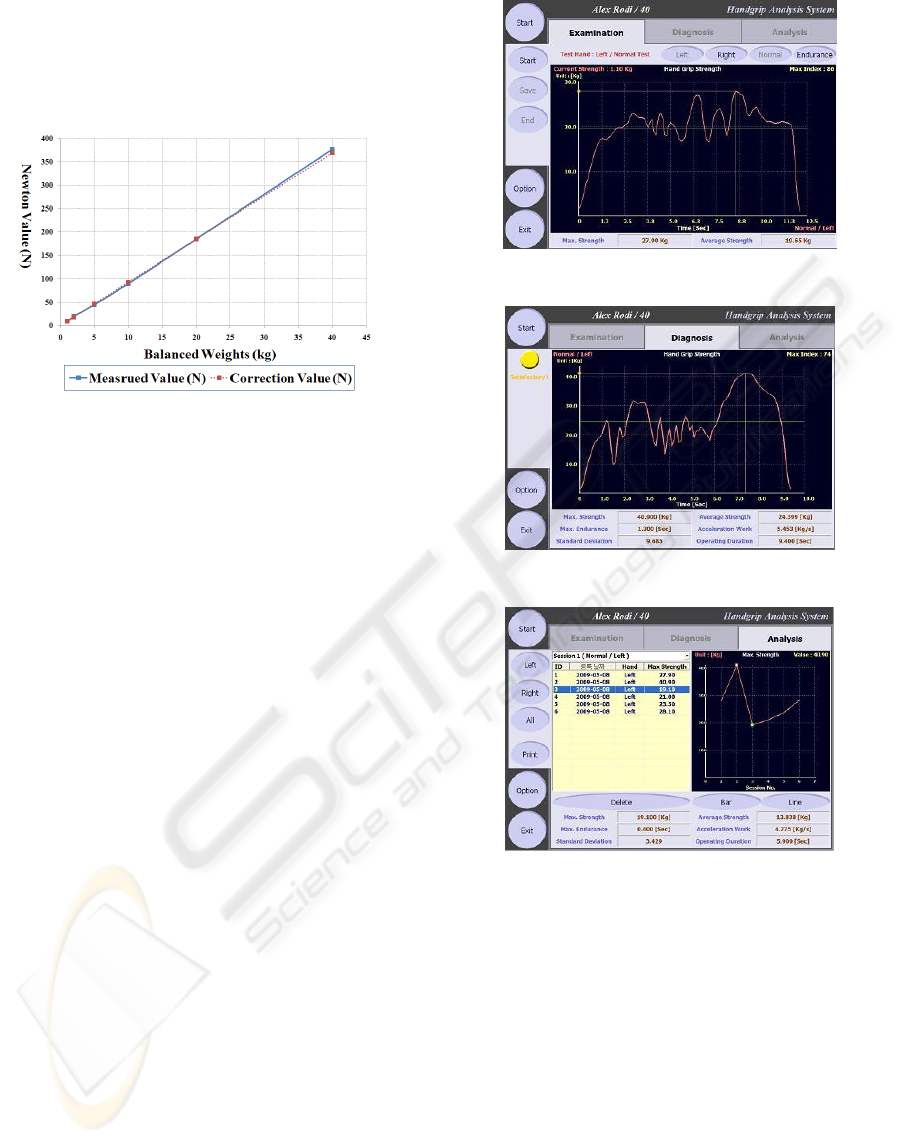
Figure 4 shows an example of the calibrated results.
As shown in Figure 4, the red line indicates the
result before the calibration and the blue line
indicates the result after the calibration, and relative
error is negligible.
Figure 4 : A comparison graph of measured value and
correction value.
2.3 Analysis Software of Hand
Functions
In this paper, we implemented the software by
Visual C++ .Net 2003 in order to evaluate hand
functions. In addition, we designed a database in
order to store patient’s personal information and
results of each functional test with the acquired data
so that these data can be used to perform and plan
rehabilitation treatment as well as compare the data
with previous data.
The software consists of cases of examination,
diagnosis and analysis. Figure 5 shows the case of
examination. In this case, the software can measure
grip strength on dynamic and static endurance test
mode. (Nicolay & Walker, 2005; Crosby & Wehbe,
1994), and displays it in real time. The case of
diagnosis is shown in Figure 6. It diagnoses data
from examination by offering not only simple values
such as maximum grip strength, duration of
operation, average grip strength and acceleration
work (Yang, Huang & Yang, 2006), but also
variations and standard deviation of grip strength
such as dynamic and static endurance test mode.
Figure 7 shows the case of analysis. It presented
tracing of patient’s examination by comparing
current data with previous data in order to display
variation of patient’s results based on each test mode
obviously.
Consequently, the functions of the proposed
system would help determining the effectiveness of
various treatment procedures as diagnosing by
accurate data.
Figure 5: A picture of examination.
Figure 6: A picture of diagnosis.
Figure 7: A picture of analysis.
3 RESULTS AND CONCLUSIONS
We developed a digital hand dynamometer for
measure handgrip parameter quantitatively and
implemented user interface to evaluate hand
functions. As the results of this study offer
quantitative values of handgrip strength, it would
contribute in understanding of hand functions to
various fields. In addition, visualized results would
make patients interesting to take part in
rehabilitation programs. Moreover, doctors would
evaluate patient’s hand functions conveniently.
The proposed system easily carried and able to
connect to a personal computer through USB Bus,
DESIGN OF A HAND DYNAMOMETER FOR TESTING AND ANALYSIS OF HAND FUNCTIONS
157

which means patients can transfer measured data to
their doctors by network service so that patients can
save their cost and times.
Future work with this system will involve adding
wireless communication system as discussed above
and a comparing study through a clinical study.
ACKNOWLEDGEMENTS
This work was supported by the Korea Science and
Engineering Foundation (KOSEF) grant funded by
the Korea government (MEST) (No. 2009-0071567).
REFERENCES
Andria, G., Attivissimo, G. A., Giaquinto, N., & Sasanelli,
N., 2006. Functional evaluation of handgrip signals for
Parkinsonian patients. IEEE Transaction On
Instrumentation and Measurement, 55 (5), 1467-1473.
Bassey, E. J. & Harries, U. J., 1993. Normal values for
handgrip strength in 920 men and women aged over
65 years and longitudinal changes over 4 years in 620
survivors. Clinical Science, 84, 331-337.
Crosby, C. A. & Wehbe, B. M., 1994. Hand strength:
normative values. Journal of Hand Surgery, 19, 665-
670.
Gallery, P. M. & Forster, A. L., 1985. Human Movement.
Churchill Livingstone Co., 98-99.
Innes, E., 1999. Handgrip strength testing: A review of the
literature. Australian Occupational Therapy Journal,
46, 120-140.
Mathiowetz, V., Kashman, N., & Volland, G., 1985. Grip
and pinch strength: Normative data for adults. Archive
Physical Medical Rehabilitation, 66, 69-72.
Nicolay, C. W. & Walker, A. L., 2005. Grip strength and
endurance: Influence of anthropometric variation,
hand dominance, and gender. Industrial Ergonomics,
35, 605-618.
Yang, H. Y., Huang, H. C., & Yang, C. H., 2006. A
generic grip strength training and evaluation system.
Journal of Medical and Biomedical Engineering, 26,
75-80.
BIODEVICES 2010 - International Conference on Biomedical Electronics and Devices
158
