
HERMES
Mobile Balance and Instability Assessment System
Hyduke Noshadi, Shaun Ahmadian, Hagop Hagopian, Jonathan Woodbridge, Foad Dabiri
Navid Amini, Majid Sarrafzadeh
Computer Science Department, University of California, Los Angeles, CA 90095, U.S.A.
Nick Terrafranca
MesiSens, 570 Westwood Plaza, Los Angeles, CA 90095, U.S.A.
Keywords:
Wireless health, Sensor selection, Plantar pressure sensing, Instability modeling and analysis.
Abstract:
In this paper we introduce Hermes, a lightweight smart shoe and its supporting infrastructure aimed at extend-
ing instability analysis and human balance monitoring outside of a laboratory environment. By combining
embedded sensing, signal processing and modeling techniques we create a scientific tool capable of quantify-
ing high-level measures. The system monitors walking behavior and uses an instability assessment model to
generate quantitative value with episodes of activity identified by the physician as important. The model incor-
porates variability and correlation of features extracted during ambulation that have been identified by geriatric
motion study experts as precursors to instability, balance abnormality and possible fall risk. Our experiments
demonstrate the feasibility of our model and the complimentary role our system can play by providing long-
term monitoring of patients outside a hospital setting at a reduced cost, with greater user convenience, and
inference capabilities that meet physicians and researchers needs.
1 INTRODUCTION
Fall related injuries are a growing challenge to health
care systems. In 2002, more than 19 billion USD were
spent on fall related injuries for those 65 and older in
the US alone (J.A. Stevens, 2006). This number is
expected to exceed 55 billion by 2020 (F. Englander,
1996) (CDC, 2009). More astoundingly, the combi-
nation of direct and indirect costs related to fall re-
lated injuries range from 75 to 100 billion annually
in the U.S (Comodore, 1995). A recent study shows
that hospital and long-term-care costs resulting from
falls in nursing homes and long term care facilities
has been estimated to be an average of 6,200 per year
per resident (N.V. Carroll, 2008).
Health care systems do not have the capabilities to
continuously monitor an individual’s instability and
fall risk outside of a hospital setting. Although reg-
ular doctor visits are helpful, too many visits are re-
quired to be effective amounting to an enormous cost
. In hopes of mitigating the economic and emotional
costs of falls, we have developed Hermes. Hermes is
a lightweight, non-invasive system that assesses a pa-
tient’s fall risk through continuous monitoring in or
outside of a lab setting. Although Hermes alone does
not directly prevent falls, it does allow primary-care
providers to make assessments that could allow pre-
ventative measures to be taken. The current version
of the Hermes prototype costs approximately $400.
However, this cost can be reduced significantly when
manufactured commercially.
To better understand the potential impacts of Her-
mes we present several methods currently used by
physicians and geriatric experts for assessing insta-
bility and measuring imbalance. These methods are
categorized into two major classes. The first set
of methods are clinical tests that rely mainly on
the trained eyes of physicians for evaluation and
diagnosis (A. Behrman, 2002) (Upa, 1998) (Thor-
bahn and Newton, 1996). One benefit of this class
of tests is that little or no equipment is required.
The second major class of tests are those that oc-
cur in motion laboratories using expensive motion
capture equipment along with pressure-based de-
vices (Bertec.com, 2008) (Vicon.com, 2008) (Mon-
sell, 1997) (Gaitrite.com, 2008). Consequently, these
264
Noshadi H., Ahmadian S., Hagopian H., Woodbridge J., Dabiri F., Amini N., Sarrafzadeh M. and Terrafranca N. (2010).
HERMES - Mobile Balance and Instability Assessment System.
In Proceedings of the Third International Conference on Bio-inspired Systems and Signal Processing, pages 264-270
DOI: 10.5220/0002738202640270
Copyright
c
SciTePress
methods render highly quantitive and accurate re-
sults. With recent advances in embedded and wire-
less communication, a third class based on wearable
and mobile platforms for balance and gait analysis has
emerged. Low-cost, pressure-based systems like Her-
mes have been proposed for various health applica-
tions including foot ulcer prevention, fitness, and ex-
traction of basic gait parameters (S. Bamberg, 2007)
(F. Dabiri, 2008) (K. Maluf, 2001).
The aforementioned clinical techniques and com-
mercial systems lack quantitative and reproducible
measures (such as those acquired through an elec-
tronic device) or are limited to a controlled environ-
ment (such as a lab) and only support short duration
examinations. Even recent low-cost mobile alterna-
tives lack data modeling techniques to properly assess
instability and its progression.
Our system is motivated by (Maki, 1997) and re-
cent findings in (Hausdorff, 2007) that show gait vari-
ability to be an effective measure of fall risk. How-
ever, the discussion of which gait parameters and how
they vary is still an activediscussion in the medical lit-
erature. For this reason, we designed Hermes to pro-
vide a gait analysis model configurable by health care
professionals to meet their needs. This paper presents
the following research contributions: 1) A mobile
sensing platform (integrated within a shoe) that is
non-invasive,customizable, low-power, and low-cost;
(2) An instability assessment model that incorporates
temporal and spatiotemporal factors to assess balance
and instability; 3) Empirical study of Pedar (Novel.de,
2007) to model its behavior to be able to design such
a system that can operate in low-power environment
with lowcost components.
The remainder of this paper is organized as fol-
lows: In Section 2 we describe the systems architec-
ture that comprise Hermes. Section 3 demonstrates
our investigation on sensor selection and placement
to minimize hardware and energy costs. Section 4 de-
scribes the signal processing used to extract tempo-
ral and spatiotemporal parameters in order to assess
instability in human walk. Finally, we conclude the
paper with section 5 and 6 by illustrating the feasibil-
ity of instability analysis model and discussing future
work.
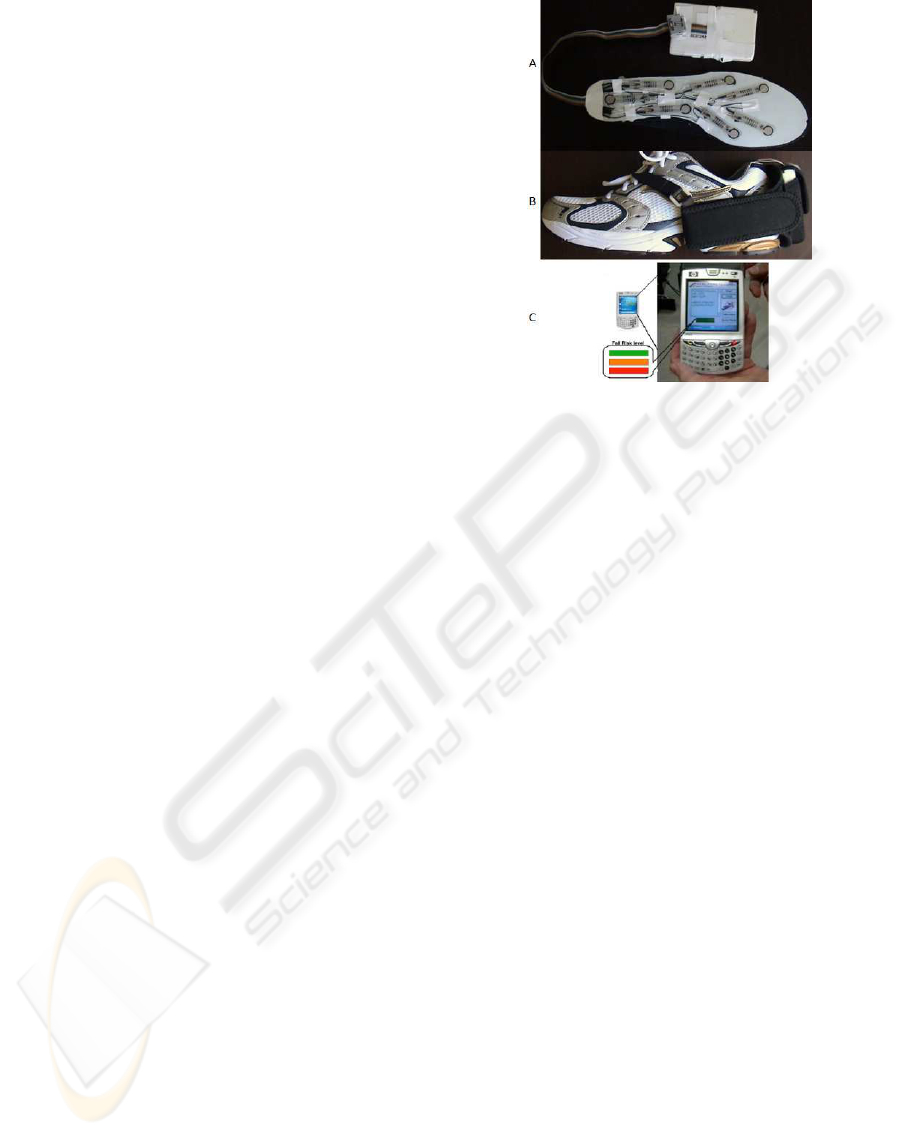
2 SYSTEMS ARCHITECTURE
Hermes is constructed with low-cost off the shelf sen-
sors integrated within a shoe. We’ve integrated an
Embedded computing platform to support data acqui-
sition, synchronization and low-power radio commu-
nications. A smartphone with bluetooth and GPRS
Figure 1: Hardware Architecture.
capabilities was used as a central aggregation and pro-
cessing unit. Data is sent from the embedded device
to the smartphone where its processed. Results are
displayed to the user as well as propagated to a cen-
tralized server for further analysis and long term stor-
age.
We used the MicroLEAP (L. Au, 2007) embed-
ded sensing platform with bluetooth capabilties. Mi-
croleap contains an onboard 3-axis accelerometer and
3-axis gyroscope and connects to 7 external pressure
sensors integrated within the shoe’s insole (identi-
cal setup on each shoe). The Microleap platform is
mounted to the shoe’s heel such that one axis of gyro
and acceleration is aligned with the subjects body. All
sensor data is collected with a 16-bit ADC.
3 SENSOR SELECTION
To get a better understanding of the signals resulting
from the exertion of pressure by the feet we turned to
Pedar (Novel.de, 2007). Pedar is an accurate and reli-
able pressure distribution measuring system for mon-
itoring local loads between the foot and the shoe. It
is comprised of insoles equipped with a grid of pres-
sure sensors and a data acquisition unit capable of lo-
cal storage and transmission to a PC over wireless or
wired connection.
We utilized Pedar data acquired from 6 subjects.
This data was analyzed to discern the variation of
pressure distributions across individuals. This vari-
ation along with sensor correlations were used to sig-
nificantly reduce the number of sensors, while still
producing accurate calculations of gait parameters.
This optimization lends itself to customizations at the
HERMES - Mobile Balance and Instability Assessment System
265
hardware layer that can help to reduce cost and power
of the mobile platform thereby making it more practi-
cal for day-to-day activity monitoring.
We make use of two key concepts from data mod-
eling: Variability to provide information about the
shape of the signal and how it is distributed and Cor-
relation to provide information about how similar the
shape (not amplitude) of the individual sensing chan-
nels are to one another. For our study we focused on
using correlation to combine sensor readings which
have similar shape and using variability to determine
which sensors contributed most to the underlyingphe-
nomenon.
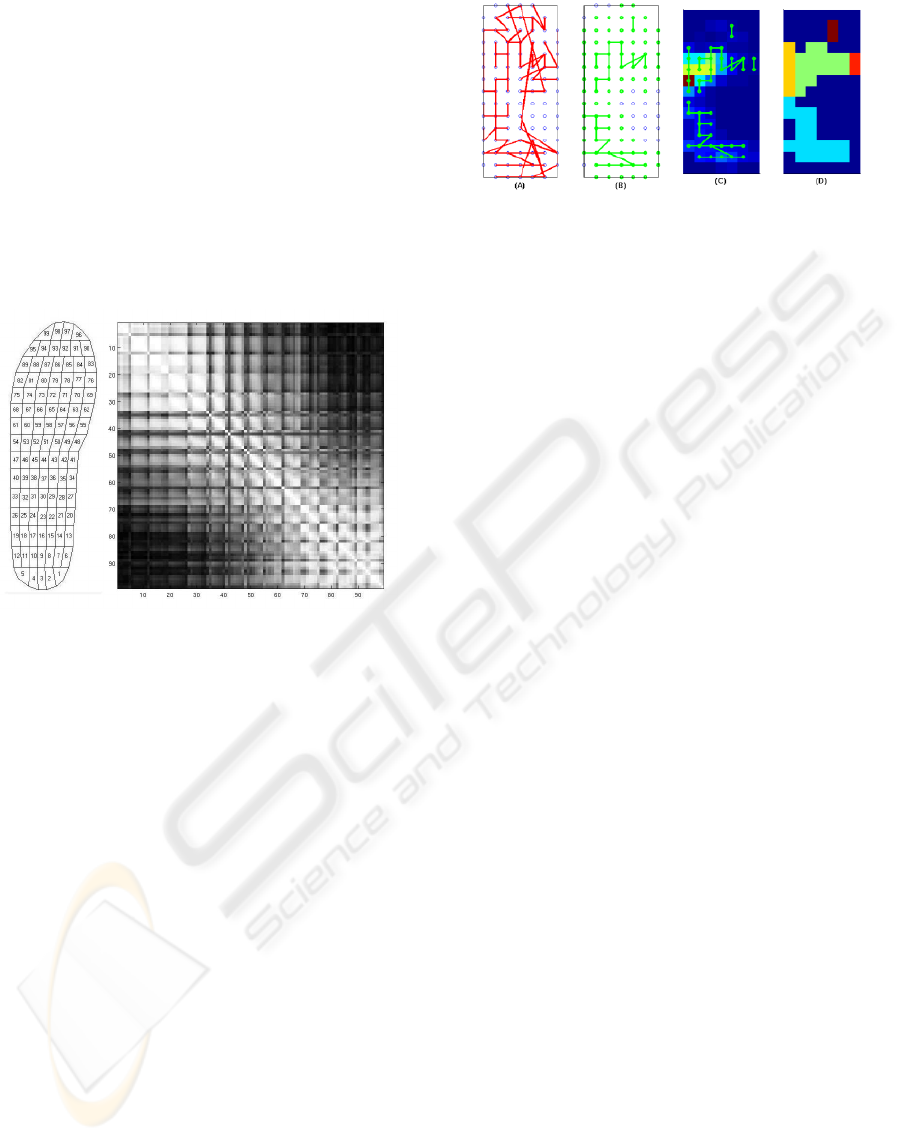
Figure 2: Correlation matrix of all 99 sensors in the insole
of Pedar; the higher the correlation the lighter the color. The
sensor mapping is shown on the left figure. The top left
hand corner of the matrix is the heel region and the bottom
right corner is the toe regions.
First we look into the correlation in the signals.
Fig. 2 shows the correlation matrix for all 99 sig-
nals captured by Pedar. Unfortunately the correla-
tion matrix is not useful by itself. To find the struc-
ture of the underlying data we turn to clustering. As
with any clustering a similarity measure is needed to
group the data points, for which we use correlation. In
particular we take a graph-theoretic approach known
as divisive (top-down) clustering to build a hierarchi-
cal structure which we then prune based on empirical
measurements.
The first step in our approach is building a simi-
larity graph, where nodes are sensors and edges are
the correlations between sensors. Next we derive the
minimal spanning tree similar to Fig. 3(A). We now
use the minimal spanning tree as the baseline struc-
ture for divisive pruning and clustering. Due to the
nature of spanning trees they most likely will have
a combination of strong and weak links. To remove
weak links we set an empirically derived threshold
to obtain a tree similar to Fig. 3(B). A side-effect
of such pruning is the creation of singleton clusters.
Figure 3: Clustering based on correlation and variance.
To determine if our clusters (singleton or not) con-
tribute significantly to the overall signal we use a sec-
ond measure called variability. In Fig. 3(C) we have
mapped the ”pruned” spanning tree on top of a vari-
ance heat-map with lighter colors indicating greater
variability in the sensing channel. Interesting enough
most of the derivedclusters fall within regions of high
variability while smaller and singleton clusters fall in
regions which contribute minimally to the overall sig-
nal. This finding was verified across all the subjects.
Finally using variability as a guide to prune unneces-
sary clusters we derive the final set of clusters as seen
in Fig. 3(D).
The spanning tree itself provides insight into the
structure of the data. As previously mentioned Fig.
3(A) shows the full minimum spanning tree. Some
noticeable features are the horizontal and vertical con-
nections. The horizontal connections indicate tempo-
ral consistency, meaning the shift of pressure from the
back (heels) to the front (toes) is highly synchronized
horizontally. The existence of vertical connections in-
dicates spatial consistency as a result of a flatter ap-
plication of pressure. Although many other factors
influence correlation of the signals, here we want to
show the higher-level inferences that can be derived
from quantitative measures such as correlation.
As mentioned earlier, clustering is application de-
pendent. The needs of the physician will dictate the
number of sensors needed to output the interested
statistics. In order to determine the correct number
of clusters for our application we develop a loss func-
tion (criterion) as the average intra-cluster error and
then empirically derived the cluster count, which min-
imized the criterion function.
Systems such as Pedar that have 99 sensors in the
insole can measure desired parameters in all individ-
uals since the sensors cover all the area under the
feet. This is not the case in Hermes and other systems
in wireless health since they have power and fidelity
constrains. Therefore sensors placement needs to be
customized for an individual user.
BIOSIGNALS 2010 - International Conference on Bio-inspired Systems and Signal Processing
266

4 SIGNAL PROCESSING
Signal processing stack in Hermes is composed of
pre-processing and processing stages. Signal con-
ditioning, filtering and segmentation is part of pre-
processing stage, while in processing stage temporal,
spatiotemporal and consistency features are extracted
based on which the measure for instability can be es-
tablished.
We define the spatial and temporal parameters ac-
cording to (Whittle, 2007) as following: Step length is
the distance from a point of contact with the ground
of one foot to the following occurrence of the same
point of contact with the other foot. This can gener-
ally be thought of as the distance one foot moves for-
ward in front of the other. Step time is the time taken
for each step. Cadence is the number of steps taken
per second. Stride length is defined as the distance
between successive points of initial contact point of
the same foot. It consists of two steps lengths, left
and right. Gait speed is the product of stride length
and cadence. Stance-to-swing ratio, where the stance
phase is the time from heel-down to toe-off, and the
swing phase is the time between toe-off and heel-
down. Dual stance is the time that both feet are in
contact with the ground. Pressure correlation is the
correlation of the pressures recorded in each step with
the previous steps.
Temporal parameters are extracted through pres-
sure signal analysis. The extraction of left and right
stance phase, left and right swing phase, and dual-
support phase features is done by by processing a
minimum of four signals, which are most closely as-
sociated to the point of pressure for the toe and heel.
We process discretized and sanitized signals that
represent the input pressure signals. These sig-
nals represent occurrences of pressure-contact-on and
pressure-contact-off. Given these occurrences, we
know exactly where the following occur: right heel
on, right toe off, left heel on, and left toe off. For
a single step cycle, these are the only events that we
need to detect in order to generate all temporal fea-
tures. Temporal features are calculated as follows:
Left/Right stance phase is the time between the heel
on and toe off, left/right swing phase is the time be-
tween toe off and heel on again, dual support is the
time between right heel on and left toe off. Any other
temporal parameter that is later decided to be useful,
can be added in a similar manner.
Spatial parameters are extracted through both
pressure and non pressure signal analysis. The sig-
nals acquired from pressure sensors are used to com-
pute step consistency by computing the correlation of
consecutive steps in real-time. We also use the sig-
nal reading from the accelerometer and gyroscope to
compute the stride and step length using techniques
described in (S. Bamberg, 2007).
Step consistency is calculated in real-time by
computing the difference of two consecutive signals
by taking the difference of their integral over the time
according to Equation 1, where k is the operation
window, S is the max number of steps taken, es and bs
are the beginning and end point of the step and P(x)
is the function of recorded sensor value over the time.
We keep track of the median difference over the win-
dow of 5 most recent steps (K = 5).
C = 1/k
S−1
∑
i=S−k
(
Z
es
i+1
bs
i+1
P(t)dt −
Z
es
i
bs
i
P(t)dt) (1)
The trend we define as the true behavior or activ-
ity that is observable. It is important to distinguish
between trend and variance, trend is the true tendency
of the variation, while the variance is deviation of the
data from the trend. To develop our trend for a given
data, we use a multi-pass interpolation with a prede-
fined window to determine the relative average path.
Trend analysis is important because it is an accu-
rate predictor of behavior. Accurate predictions of the
behavior of a patient at any given time is a key com-
ponent in the instability analysis model.
The next step in the data flow model is variance
analysis. After the features are computed for each
step cycle, and the trend function is computed for the
signal in each segment, we compute the variability of
each feature using equation 2, where p
i
is the value
of the features’ variance relative to the trend as de-
scribed in equation 3. γ is the trend function that is
constructed as specified. If a patient is attempting to
increase their speed, but are having difficulty doing
so consistently, they are generally at a higher risk of
falling. This is why the variance analysis is important
for the instability model. In general, stronger variance
in a feature implies a higher instability.
Var
feature
k
=
s
1/n− 1
t+k
∑
i=t
(p
i
− ¯p)
2
(2)
p
i
= s
i
− γ(s
i
) (3)
Once the trends and the variability of each fea-
ture relative to trend is computed, for each feature
the measure for instability can be established for each
segment of input signal based on equation4, where V
T
and V
ST
are the variance of temporal and spatiotem-
poral parameters in the segment. V
T
and V
ST
are com-
puted based on equation 4, where τ
i
is the variance of
temporal feature i and σ
j
is the variance of spatiotem-
poral feature j. α
i
and γ
j
are the coefficients which in-
dicate the importance of a particular feature and they
HERMES - Mobile Balance and Instability Assessment System
267
are constrained by equation 5. The coefficients can
be set by physicians and domain exports to tailor the
instability assessment to best fit an individual patient.
Instability = V
T
+V
ST
=
n
∑
i=1
α
i
V
τ
i
+
m
∑
j=1
γ
j
V
σ
j
(4)
n
∑
i=1
α
i
+
m
∑
j=1
γ
j
= 1 (5)
5 EXPERIMENTS
To determine the feasibility of our system to compute
gait parameters and instability measure, for this pa-
per we conducted experiments in both controlled and
non controlled environments. A total of 6 individuals
from our laboratory participated in the experiments.
The test subjects were diverse in terms of height and
weight and walking patterns; some were flat footed,
others normal or slightly limping.
The first set of experiments has been conducted
in the laboratory setting, while we placed our insole
on top of Pedar’s insole and asked our test subjects to
walk and we compared the extracted gait parameters
of Hermes and Pedar. For each parameter we compute
the value generated by Hermes vs Pedar and compute
the error. Figure 4 shows our performance vs pedar
based on aggregated error values of each feature for
all trials among test subjects.
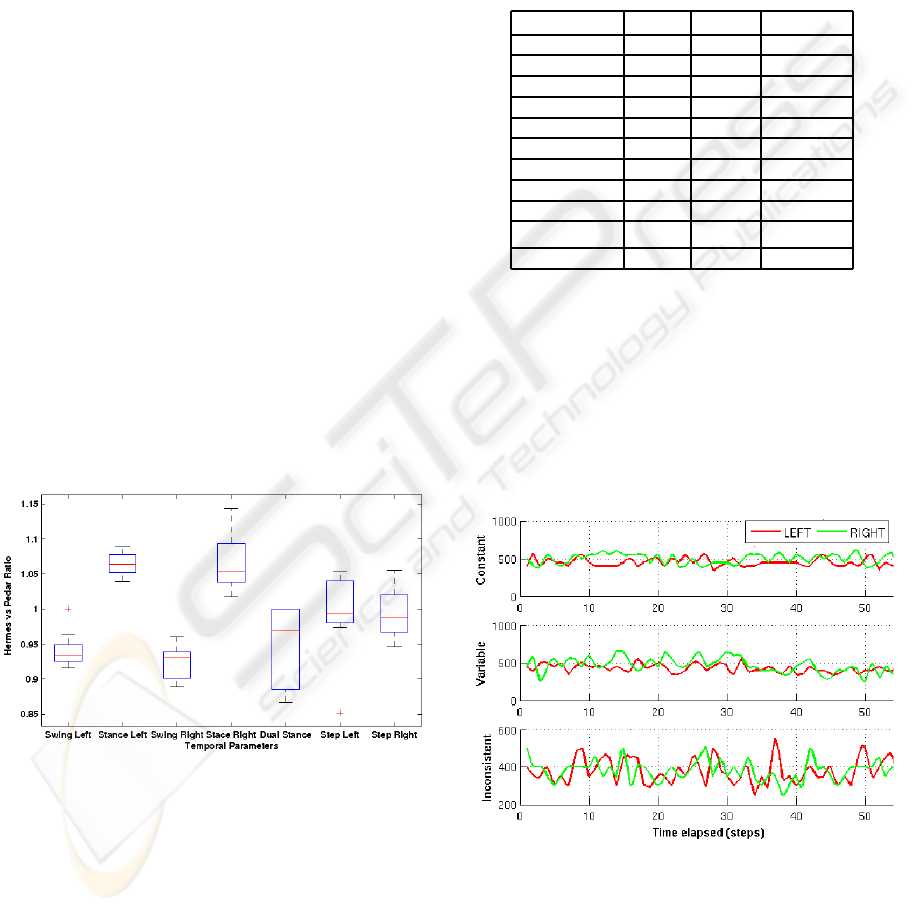
Figure 4: Accuracy of Hermes as compared to Pedar.
The second set of experiments was conducted in a
non-controlled setting. Test subjects were instructed
to take different paths and walk on different surfaces
(such as flat, uphill and downhill) on our campus over
12 min episodes while performing various ambulation
patterns in a one week period. Since feasibility was
the primary goals of our experiments, in this paper,
we focused on 3 patterns of normal walk (at constant
speed), variable speed walk, and inconsistent walk.
For each test subject, temporal and spatiotemporal pa-
rameters for each trial were extracted as explained in
Section 4. Table 1 contains the corresponding vari-
ability analysis of the temporal features for each of
the target ambulation patterns. The empirical distri-
butions derived for gait parameters at various speeds
indicates that Hermes is clearly sensitive enough to
pick up variations at sub-1.75 Km/h granularity.
Table 1: Variance of Spatio-temporal features.
Feature Normal Variable Inconsistent
Stance Left 1.472 1.7351 3.76
Stance Right 1.0031 2.3119 4.1383
Swing Left 0.9849 0.906 1.757
Swing Right 1.336 2.3319 1.2321
S/R Ratio Right 0.0038 0.0081 0.0285
S/R Ratio Left 0.0050 0.0235 0.0153
Stride Right 2.7384 2.6353 7.364
Stride Left 2.0641 2.4066 7.0620
Step Right 1.3953 0.8247 2.7647
Step Left 1.2414 2.0733 2.0300
Dual Stance 0.5503 0.8884 0.667
A total of six temporal features were extracted as
described in Section 4. Fig. 5 plots feature over time
for the three different cases. First thing to note is the
high variability between feature for the inconsistent
case relative to the two normal patterns. The variable
speed graph also shows the need to consider trend
in calculating the variance. The fact that the person
slows down should not affect their balance as can be
seen by the low variability around the trend.
Figure 5: Swing phase variability with constant, variable
and inconsistence speed. Variable speed shows a downward
linear trend compare to that of constant speed, while incon-
sistent shows a relatively high variance.
Trend and variances were also computed for the
temporal parameters across all three patterns. Her-
mes is able to compute the variance of each of the de-
BIOSIGNALS 2010 - International Conference on Bio-inspired Systems and Signal Processing
268
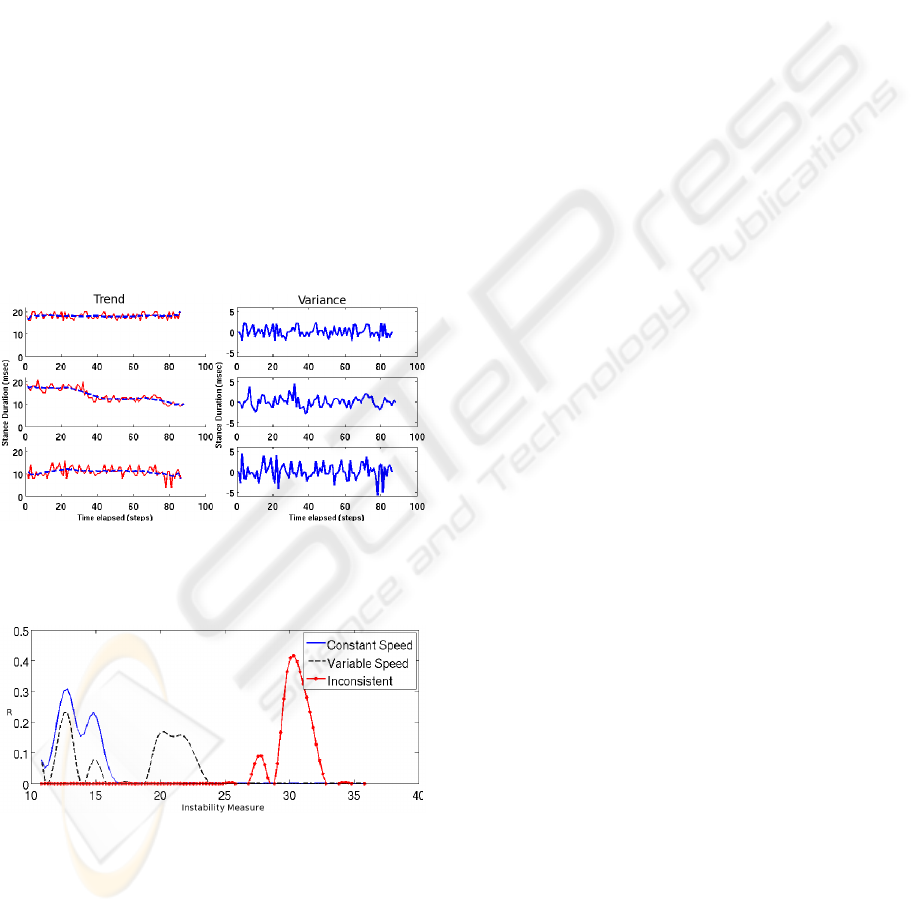
tected features by isolating the variability of the fea-
ture signal by taking the signals’ trend into consid-
eration. Fig. 6 illustrates how this is done for stance
time. First the trend line is determinedfor the segment
as shown in the top graphs. Then the trend is removed
from the signal, as shown by the bottom graphs from
which the variance is calculated. The resulting vari-
ances are shown in Table 1. To measure instability
we asked our test subjects to walk with the three pre-
defined ambulatory patterns. We then computed the
instability factor for each of the patterns in the sin-
gle set of activity. Fig. 7 shows the distribution of
the instability measure for each of the episodes. The
results verified the effectiveness of computed insta-
bility value. The instability factor for inconsistent
walk is always higher than constant speed and vari-
able speed walk, while the instability factor of vari-
able speed walk is sometimes larger than constant
speed and sometimes has the same value as constant
speed. This is due to the fact that a part of variable
speed also includes the speed of constant speed walk
in our experiments.
Figure 6: The trend and variance is calculated across three
patterns of walking: constant speed, gradual speed change,
and inconsistent walking.
Figure 7: Empirical distributions of instability measure for
one test subject performing the three walking patterns.
6 CONCLUSIONS AND FUTURE
WORK
In this paper we introduced Hermes, a low-cost, cus-
tomizable mobile platform capable of long-term in-
stability and balance analysis for individuals who are
prone to falling. This system aims to increase the
physicians insight of patient walking patterns and be-
havior, which has generally been limited to ambula-
tion analysis within hospitals and controlled environ-
ments such as gait labs. These day-to-day patterns
and the variabilities associated with them are what
our system is designed to detect. Through our system
physicians, clinicians and researchers will be able to
monitor and diagnose patient instability and balance
over a long period of time.
For the future we plan to work closely with the
medical community to get an approval for clinical
study. We would like to test Hermes on real patients
with various conditions and in different environments.
Finally, We plan to enable the active feedback sys-
tem on Hermes, both in hardware and software. We
are also working to take advantage of external signals
to provide a more sound instability measure, such as
GPS data from the mobile device.
REFERENCES
(1998). The timed up and go test is a useful predictor of falls
in community dweng older people. American Geri-
atrics Society, 83(46).
A. Behrman, K. Light, S. F. T. (2002). Is the functional
reach test useful for identifying falls risk among indi-
viduals with parkinson’s disease? Archives of Physi-
cal Medicine and Rehabilitation, 83(4):538 –542.
Bertec.com (2008). Force plates.
http://www.bertec.com/gaitbiomechanics.htm.
CDC (2009). Preventing falls among older adults.
http://www.cdc.gov/ncipc/duip/preventadultfalls.htm.
Comodore, B. (1995). Falls in the elderly population: a look
at incidence, risks, health care costs, and preventive
strategies. Rehabilitation Nursing, 20(2):84–92.
F. Dabiri, A. Vahdatpour, H. N. H. H. M. S. (2008). Ubiq-
uitous personal assistive system for neuropathy. In
Workshop on Systems and Networking Support for
Healthcare and Assisted Living Environments.
F. Englander, T.J. Hodson, R. T. (1996). Economic dimen-
sions of slip and fall injuries. Journal of Forensic Sci-
ence, 41(5):733–737.
Gaitrite.com (2008). Gaitrite systems.
http://www.gaitrite.com.
Hausdorff, J. M. (2007). Gait dynamics, fractals and falls:
Finding meaning in the stride-to-stride fluctuations of
human walking. Hum. Mov. Sci, 26(4):559–589.
HERMES - Mobile Balance and Instability Assessment System
269

J.A. Stevens, P.S. Corso, E. F. T. M. (2006). The costs of
fatal and nonfatal falls among older adults. Injury Pre-
vention, 12:290–295.
K. Maluf, R. Morley, E. R. J. K. M. M. (2001). Monitoring
in-shoe plantar pressures, temperature, and humidity.
Phys. Med.Rehabil, 82(8):1119–1127.
L. Au, W. Wu, M. B. D. M. W. K. (2007). Microleap:
Energy-aware wireless sensor platform for biomedical
sensing applications. In Proceedings of IEEE Biomed-
ical Circuits and Systems (BioCAS).
Maki, B. (1997). Gait changes in older adults: predictors of
falls or indicators of fear. Journal of American Geri-
atr., 45:313–233.
Monsell, E. (1997). Technology assessment: computerized
dynamic platform posturography. Otolarynogol Head
Neck Surg, 117:394–398.
Novel.de (2007). Pedar. http://www.novel.de/.
N.V. Carroll, J.C. Delafuente, F. M. C. S. N. (2008). Fall-
related hospitalization and facility costs among res-
idents of institutions providing long-term care. The
Gerontologist, 48:213–222.
S. Bamberg, A. Benbasat, D. S. D. K. J. P. (2007). Gait
analysis using a shoe-integrated wireless sensor sys-
tem. IEEE Transactions on Information Technology
in Biomedicine, 12(4):413.
Thorbahn, L. B. and Newton, R. (1996). Use of the berg
balance test to predict falls in elderly persons. Physi-
cal Therapy, 76(6):576–583.
Vicon.com (2008). Gait analysis + rehab.
http://www.vicon.com/applications/gait analysis.html.
Whittle, M. W. (2007). Gait Analysis: An Introduction.
Elsevier, London, 4th edition.
BIOSIGNALS 2010 - International Conference on Bio-inspired Systems and Signal Processing
270
