
HANDLING IDS’ RELIABILITY IN ALERT CORRELATION
A Bayesian Network-based Model for Handling IDS’s Reliability and Controlling
Prediction/False Alarm Rate Tradeoffs
Karim Tabia and Philippe Leray
COD/LINA CNRS UMR 6241, Ecole Polytechnique de Nantes, Nantes, France
Keywords:
Bayesian networks, Alert correlation, IDSs’ reliability, Pearl’s virtual evidence method, Reject option.
Abstract:
Probabilistic graphical models are very efficient modeling and reasoning tools. In this paper, we propose an
efficient and novel Bayesian network model for a major problem in alert correlation which plays a crucial
role in nowadays computer security. Indeed, the use of multiple intrusion detection systems (IDSs) and com-
plementary approaches is fundamental to improve the overall detection rates. This however inevitably rises
huge amounts of alerts most of which are redundant and false alarms making the manual analysis of all the
amounts of triggered alerts intractable. In this paper, we first propose a Bayesian network-based model allow-
ing to handle the reliability of IDSs when predicting severe attacks by correlating the alerts reported by the
IDSs monitoring the network. Then we propose a flexible and efficient approach especially designed to limit
the false alarm rates by controlling the confidence of the prediction model. Finally, we provide experimental
studies carried out on a real and representative alert corpus showing significant improvements regarding the
tradeoffs between the prediction rates and the corresponding false alarm ones.
1 INTRODUCTION
Intrusion detection consists in analyzing audit events
(log records, networks packets, etc.) (Patcha and
Park, 2007)(Axelsson, 2000) in order to detect ma-
licious actions whose aim is to compromise the in-
tegrity, confidentiality or availability of computer and
network resources or services. Practitioners often de-
ploy several security products and solutions in order
to increase the detection rates by exploiting their mu-
tual complementarities. However, all intrusion detec-
tion systems (IDSs) (even the de facto network IDS
Snort
1
) are well-known to trigger large amounts of
false alerts. This is due to several reasons such as
bad parameter setting and tuning, update problems,
etc. (Tjhai et al., 2008). As a result, huge amounts
of alerts are daily triggered making the manual anal-
ysis unbearably time-consuming. In order to cope
with these quantities of alerts, alert correlation ap-
proaches are used for i) reducing the number of trig-
gered alerts by eliminating redundant ones (Debar and
Wespi, 2001), ii) multi-step attack detection where
the different alerts may correspond to the execution of
an attack plan consisting in several steps (Ning et al.,
2002) and iii) prioritizing the triggered alerts accord-
1
www.snort.org
ing to the criteria and preferences of the security ad-
ministrators (Benferhat and Sedki, 2008).
Most existing alert correlation approaches use
alerts produced by IDSs without handling the relia-
bility of these IDSs. Then, it is questionable to ig-
nore the false alarm rates characterizing all the IDSs
in alert correlation tasks. For instance, if we know
that a given alert A is false in 95%, this information
should not be ignored if alert A is used as input of an
alert correlation engine. Note that there exist several
frameworks for handling the sources’ reliability that
can be used for handling IDSs’s reliability. For in-
stance, Pearl’s virtual evidence method (Pearl, 1988)
offers a natural way for handling and reasoning in the
presence of uncertain evidence
2
in the framework of
probabilistic graphical models.
In this paper, we propose a Bayesian network-
based model allowing to take into account the IDSs’
reliability assessed from past experience. This model
is based on Pearl’s virtual evidence method for rea-
soning with uncertain evidence (Pearl, 1988). How-
ever, taking into account the reliability of IDSs wors-
2
In this paper, the term uncertain or soft evidence de-
notes the outputs provided by unreliable sources. An infor-
mation piece provided by totally reliable sources is called
evidence or hard evidence.
14
Tabia K. and Leray P. (2010).
HANDLING IDS’ RELIABILITY IN ALERT CORRELATION - A Bayesian Network-based Model for Handling IDS’s Reliability and Controlling
Prediction/False Alarm Rate Tradeoffs.
In Proceedings of the Inter national Conference on Security and Cryptography, pages 14-24
DOI: 10.5220/0002949800140024
Copyright
c
SciTePress

ens the prediction of some severe attacks. In order
to solve this problem and control the prediction/false
alarm rate tradeoffs, we propose an approach allow-
ing to reject the alert sequences where the alert cor-
relation model’s confidence is not sufficient to make
a good prediction (make a good prediction). Our so-
lution allows the user to specify the confidence with
which the severe attack predictor works. As we will
see in our experimental studies, our approach allows
to significantly reduce the false alarm rates while en-
suring very interesting severe attack prediction rates.
The rest of this paper is organized as follows: Sec-
tion 2 provides the basic backgrounds on alert corre-
lation. In Section 3, we briefly present Bayesian net-
works and their use for classification tasks. Section
4 presents our model for the severe attack prediction
problem. In section 5, we deal with severe attack pre-
diction taking into account the IDSs’ reliability. In
section 6, we present our model for controlling the
prediction/false alarm rate tradeoffs. Section 7 pro-
vides our experimental studies and finally, Section 8
concludes this paper.
2 ALERT CORRELATION AND
IDSS’ RELIABILITY
This section briefly presents the alert correlation prob-
lem.
2.1 Alert Correlation
Alert correlation (Debar and Wespi, 2001)(Cuppens
and Mi
`
ege, 2002) consists in analyzing the alerts trig-
gered by one or multiple IDS sensors in order to pro-
vide a synthetic and high-level view of the interest-
ing malicious events targeting the information system.
The input data for alert correlation tools is gathered
from various sources such as IDSs, fire-walls, web
server logs, etc. Correlating alerts reported by multi-
ple analyzers and sources has several advantages. An
alert is a message generated by un IDS when an attack
is detected. It often contains an identification/name of
the detected activity, its class, a severity level, the IP
address of the attacker, the IP address of the victim,
etc. Most of IDSs can report alerts in IDMEF format
(Debar et al., 2007) which is the intrusion detection
message exchange format enabling inter-operability
among IDSs and other security tools.
The main goals of alert correlation approaches
are:
1. Alert Reduction and Redundant Alerts Elimi-
nation. The objective of alert correlation here is
to eliminate redundant alerts by aggregating or
fusing similar alerts (Debar and Wespi, 2001). In
fact, IDSs often trigger large amounts of redun-
dant alerts due to the multiplicity of IDSs and
the repetitiveness of some malicious events such
scans, floodings, etc.
2. Multi-step Attack Detection. Most IDSs report
only elementary malicious events while several at-
tacks perform through multiple steps where each
step can be reported by an alert. Detecting multi-
step attacks requires analyzing the relationships
and connections between alerts (Benferhat et al.,
2008b).
3. Alert Filtering and Prioritization. Among the
huge amount of triggered alerts, security adminis-
trators must select a subset of alerts according to
their dangerousness and the contexts. Alerts fil-
tering/prioritization aims at presenting to the ad-
ministrators only the alerts they want to analyze
(Benferhat and Sedki, 2008).
Alert correlation approaches can be grouped into sim-
ilarity based approaches (Debar and Wespi, 2001),
predefined attack scenarios (Ning et al., 2002), pre
and post-conditions of individual attacks (Cuppens
and Mi
`
ege, 2002) and statistical approaches (Valdes
and Skinner, 2001). It is important to note that most
works on multi-step attack detection heavily rely on
experts’ knowledge. For instance, the model pro-
posed in (Cuppens and Mi
`
ege, 2002) requires iden-
tifying for each elementary attack, the preceding at-
tacks and its consequences. In (Morin et al., 2009),
the authors propose a model for querying/asserting
the knowledge about security incidents and their con-
text and representing the information needed for rea-
soning in order to confirm or cancel the alerts trig-
gered by the IDSs.
In this paper, we are interested in severe attack de-
tection which can be viewed as a variant of multi-step
attack recognition. Note that there is to the best of our
knowledge no work addressing the handling of IDSs’
reliability for severe attack prediction.
2.2 IDSs’ Reliability: A Crucial Issue
The most important problem users of IDSs face is
the one of large amounts of false alerts which cor-
respond to legitimate activities that have been mistak-
enly reported as malicious by the IDS. Indeed, nowa-
days IDSs are well-known to trigger high false alarm
rates. For instance, the well-known Snort IDS indi-
cates for each attack, whether false alerts could be
triggered. In an experimental evaluation of Snort IDS
(Tjhai et al., 2008), the authors concluded that 96% of
HANDLING IDS' RELIABILITY IN ALERT CORRELATION - A Bayesian Network-based Model for Handling IDS's
Reliability and Controlling Prediction/False Alarm Rate Tradeoffs
15

the triggered alerts are false positives. Hence, taking
into account the reliability of IDSs is an interesting
issue for alert correlation tasks such as the prediction
of severe attacks which is the focus of this work. For
instance, if it is known that the 90% of alerts reporting
a malicious event triggered by a given IDS are false,
then this information should be taken into account if
such alerts should be exploited as inputs by the alert
correlation tool. In this paper, we present how IDSs’
reliability can naturally be handled using Pearl’s vir-
tual evidence method in the context of Bayesian net-
works.
3 BAYESIAN NETWORKS
This section briefly presents Bayesian networks and
their use as classifiers in prediction problems.
3.1 Bayesian Networks
Bayesian networks are powerful graphical models for
modeling and reasoning with uncertain and complex
information (Jensen and Nielsen, 2007). They are
specified by
1. a graphical component consisting in a DAG (Di-
rected Acyclic Graph) allowing an easy represen-
tation of the domain knowledge in the form of an
influence network (vertices represent events while
edges represent dependance relations between
these events), and
2. a probabilistic component allowing to specify the
uncertainty relative to relationships between do-
main variables using conditional probability ta-
bles (CPTs).
Bayesian networks are used for different types of in-
ference such as the maximum a posteriori (MAP),
most plausible explanation (MPE), etc. As for appli-
cations, they are used as expert systems for diagnosis,
simulation, etc.
3.2 Classification based on Bayesian
Networks
Classification is an important task in many real world
applications. For instance, in computer security, the
intrusion detection problem (Patcha and Park, 2007)
(Axelsson, 2000) can be viewed as a supervised clas-
sification problem where audit events are classified
into normal and malicious events. Classification con-
sists in predicting the value of a target variable given
the values of observed variables. Namely, given ob-
served variables A
1
,..,A
n
describing the objects to
classify, it is required to predict the right value of the
class variable C among a predefined set of class in-
stances. It is important to note that there are only few
works on classification techniques allowing to handle
some forms of inputs’ uncertainties such as sources’
reliability, imprecision, incompleteness, etc.
Bayesian network-based classification is a particular
kind of probabilistic inference ensured by computing
the greatest a posteriori probability of the class vari-
able given the instance to classify. Namely, having
an instance of the attribute vector a
1
a
2
..a
n
(observed
variables A
0
=a
0
, A
1
=a
1
,.., A
n
=a
n
), it is required to
find the most plausible class value c
k
(c
k
∈ C={c
1
,
c
2
,..,c
m
}) for this observation. The maximum a pos-
teriori classification rule can be written as follows:
Class = argmax
c
k
∈C
(p(c
i
/a
1
a
2
..a
n
)), (1)
where the term p(c
i
/a
1
a
2
..a
n
) denotes the posterior
probability of having the class instance c
i
given the
evidence a
1
a
2
..a
n
. This probability is computed using
Bayes rule as follows:
p(c
i
/a
1
a
2
..a
n
) =
p(a
1
a
2
..a
n
/c
i
) ∗ p(c
i
)
p(a
1
a
2
..a
n
)
(2)
In practice, the denominator of Equation 2 is ignored
because it does not depend on the different classes.
Equation 2 means that posterior probabilities are pro-
portional to likelihood of the evidence and class prior
probabilities while the evidence probability is just
a normalizing constant. Note that most works use
naive or semi-naive Bayesian network classifiers such
as TAN (Tree Augmented Naive Bayes) and BAN
(Bayesian Network Augmented Naive Bayes) (Cheng
and Greiner, 2001) which make strong assumptions
in order to simplify the classifier’s structure learning
from data. The other Bayesian network classifiers re-
quire more general structure learning and parameter
estimation (building the CPT tables).
Bayesian network-based approaches are widely
used in many areas of computer security. More
particularly, Bayesian classifiers are used in intru-
sion detection in several works such as (Wojciech,
2008)(Valdes and Skinner, 2000)(Staniford et al.,
2002). In alert correlation, a Bayesian approach
is used in (Valdes and Skinner, 2001) for alert fu-
sion. Bayesian classifiers are also used in (Benfer-
hat et al., 2008a)(Benferhat et al., 2008b)(Faour and
Leray, 2006) where the authors use naive, TAN and
other Bayesian network models for detecting attack
plans and severe alerts. Note that all the works on
detecting multi-step and severe attacks use naive or
semi-naive prediction models. Note also that to the
best of our knowledge, there is no work addressing
the IDSs’ reliability handling. In the following, we
propose a Bayesian network-based approach for se-
vere attack prediction.
SECRYPT 2010 - International Conference on Security and Cryptography
16

4 FROM ALERTS TO SEVERE
ATTACK PREDICTION
In this section, we propose a classification model for
predicting severe attacks.
4.1 Severe Attack Prediction as a
Classification Problem
Severe attack prediction consists in analyzing se-
quences of alerts or audit events in order to predict fu-
ture severe attacks. In IDMEF standard (Debar et al.,
2007), three dangerousness levels are defined: low,
medium and high. In our case, we analyze sequences
of low and medium severity level alerts in order to
predict high severity level attacks. In (Benferhat et al.,
2008b), the authors are the first to address the se-
vere attack prediction problem and proposed the first
model for predicting severe attacks as a classification
problem. However, in this work the authors use naive
models and neither address the IDSs’ reliability nor
controlling the prediction/false alarm rate tradeoffs is-
sues.
In this paper, severe attack prediction is viewed as
a classification problem stated as follows:
Given a sequence of alerts Alert
1
, Alert
2
,..,Alert
k
reported by one or multiple IDSs, we want to deter-
mine if this alert sequence will plausibly lead or be
followed by a severe attack Attack
i
. Here the attribute
variables are the alerts with low/medium severity lev-
els (often due to inoffensive attacks such as scans)
while the class variable C is composed of the differ-
ent severe attacks we want to predict.
1. Predictors (Attribute Variables). The set of pre-
dictors (observed variables) is composed of the
set of relevant alerts for predicting the severe at-
tacks. Namely, with each relevant alert Alert
i
, we
associate an attribute variable A
i
whose domain is
{0,1} where the value 0 means that alert Alert
i
was not observed in the analyzed sequence while
value 1 denotes the fact that the alert Alert
i
has
been reported. The duration of alert sequences can
be fixed experimentally or manually set by the ex-
pert. Note that in this paper, the predictors refer
to alerts with low or medium severity level corre-
sponding to inoffensive and benign events. The
relevant predictors can be selected according to
the experts knowledge or statistically by feature
selection methods (Verleysen et al., 2009).
2. Class Variable. The class variable C represents
the severe attacks variable whose domain involves
all the severe attacks Attack
1
,.., Attack
n
to predict
and another class instance NoSevereAttack repre-
senting alert sequences that are not followed by
severe attacks.
In the experimental studies section, we provide de-
tails on preprocessing alerts reported by the IDSs into
formatted data in the form of alert sequences. It is im-
portant to note that our procedure for raw alerts pre-
processing is inspired from the works of (Benferhat
et al., 2008a)(Benferhat et al., 2008b) also done in
the framework of the PLACID project. Note also that
the authors in (Bin and Ghorbani, 2006) use a similar
raw alerts preprocessing method but they use exten-
sion time windows when aggregating alerts while we
use fixed-length time windows.
5 A BAYESIAN
NETWORK-BASED MODEL
FOR HANDLING IDSS’
RELIABILITY
In this section, we first present Pearl’s virtual evi-
dence method then our model for handling IDSs’ re-
liability.
5.1 Handling Uncertain Inputs in
Probabilistic Graphical Models:
Pearl’s Virtual Evidence Method
Pearl’s virtual evidence method (Pearl, 1988) offers a
natural way for handling and reasoning with uncertain
evidence in the framework of probabilistic networks.
In this method, the uncertainty indicates the confi-
dence on the evidence: to what extent the evidence
is believed to be true. In our context, if an IDS trig-
gers an alert and we know (from past experience for
example) that this event is a false alarm in 95% of the
cases then we are in presence of uncertain evidence.
The main idea of Pearl’s virtual evidence method is
to recast the uncertainty relative to the uncertain evi-
dence E on some virtual sure event η: the uncertainty
regarding E is then specified as the likelihood of η in
the context of E.
Example. Let us illustrate Pearl’s virtual evidence
method on the simplified lung cancer problem pre-
sented by the network of Figure 1. Using the net-
work (a) of Figure 1, if a patient has lung cancer
(assume that the result of an infallible test is posi-
tive), then the probability that this patient is smoker
is p(S=True/C=True)=0.66. Assume now that the
used medical tests revealing whether a patient has
lung cancer or not are reliable at 96%. According to
HANDLING IDS' RELIABILITY IN ALERT CORRELATION - A Bayesian Network-based Model for Handling IDS's
Reliability and Controlling Prediction/False Alarm Rate Tradeoffs
17
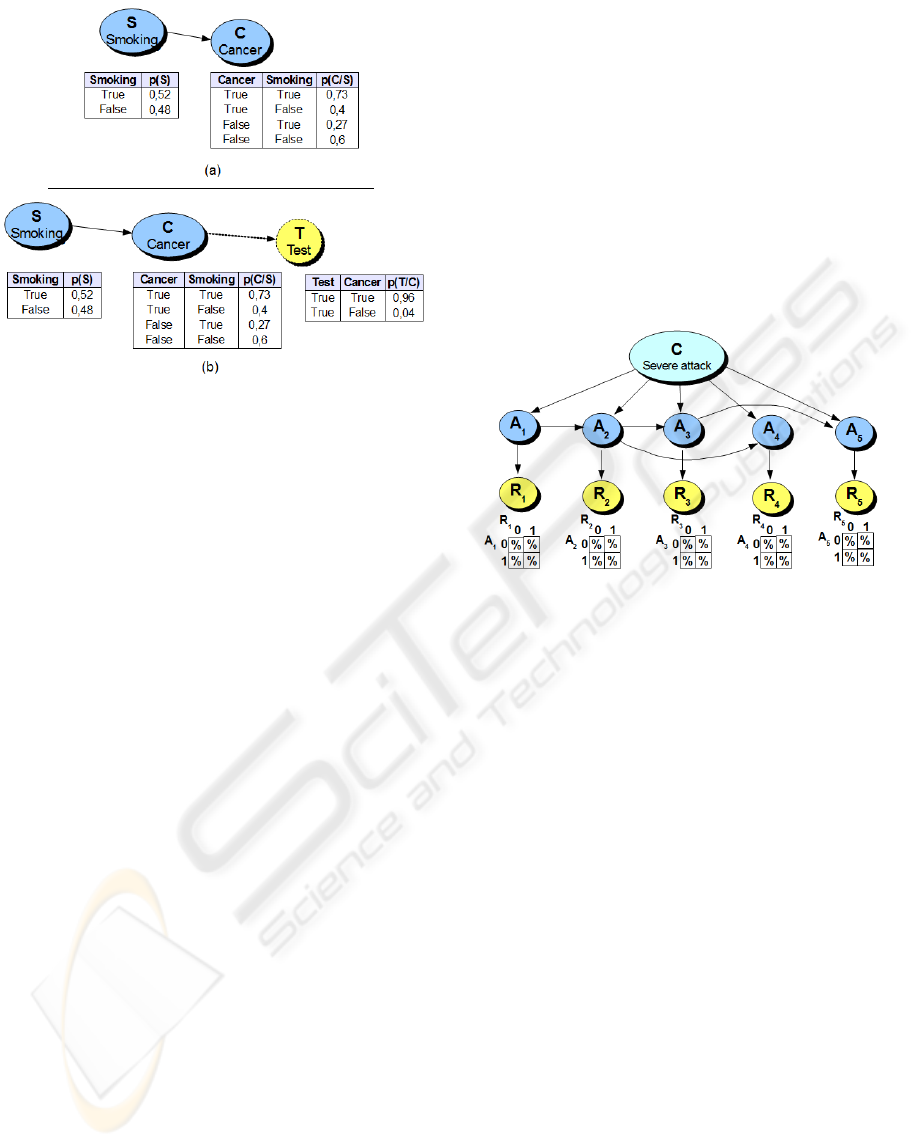
Figure 1: A Bayesian network modeling the lung can-
cer/smoking problem (a) and the Bayesian network with the
virtual evidence node Test (b).
Pearl’s virtual evidence method, this uncertainty will
be recasted on a virtual event (say Test) as illustrated
in network (b) of Figure 1. Now, given a positive test
saying that the considered individual has lung can-
cer, than the probability that this person smokes is
p(S=True/T =True)=0.65. In the following we pro-
vide our method for handling IDSs’ reliability for pre-
dicting severe attacks.
5.2 Pearl’s Virtual Evidence Method for
Handling IDSs’ Reliability
In order to apply this method for efficiently predict-
ing severe attacks, we must first assess the IDSs’ re-
liability by means of empirical evaluations (an expert
can examine for each alert type triggered by an IDS,
the proportion of true/false alerts). An expert can
also subjectively (by experience) fix the reliability of
the IDSs composing his intrusion detection infrastruc-
ture.
Now, after assessing the reliability of the IDSs in
triggering the alerts A
1
,..,A
n
, the handling of the un-
certainty regarding an alert sequence, proceeds as fol-
lows:
1. For each alert variable A
i
, add a child variable
R
i
as a virtual evidence node recasting the un-
certainty bearing on A
i
. The domain of R
i
is
D
R
i
={0,1} where the value 0 is used to recast the
uncertainty regarding the case A
i
=0 (alert A
i
was
not triggered) while the value 1 is used to take into
account the uncertainty in the case A
i
=1 (alert A
i
was triggered).
2. Each conditional probability distribution p(R
i
/A
i
)
encodes the reliability that the observed values
(triggered alerts) are actually true attacks. For ex-
ample, the probability p(R
i
=1/A
i
=1) denotes the
probability that the observation R
i
=1 is actually
due to a real attack.
The example of Figure 2 gives a tree-augmented
naive Bayes network augmented with five nodes
R
1
,R
2
,R
3
,R
4
,R
5
for handling the uncertainty relative
to variables A
1
,A
2
,A
3
,A
4
,A
5
respectively. Henceforth,
the observed variables are R
1
,R
2
,R
3
,R
4
,R
5
while vari-
ables A
1
,A
2
,A
3
,A
4
,A
5
are associated with the ac-
tual malicious/normal activities and they cannot be
directly observed. When analyzing an alert se-
Figure 2: Example of a Bayesian network classifier han-
dling the reliability of inputs.
quence r
1
r
2
..r
n
(an instance of observation variables
R
1
,..,R
n
), we compute argmax
c
i
(p(c
k
/r
1
..r
n
)) in or-
der to predict severe attacks. Note that in practice it is
less complicated to assess the false/true positive rates
than assessing the false/true negative rates which re-
quires analyzing the whole activities (for example, all
the network traffic) in order to evaluate the proportion
of attacks that were not detected by the IDSs.
6 CONTROLLING THE SEVERE
ATTACK PREDICTION/FALSE
ALARM RATE TRADEOFFS
This section presents our approach based on Bayesian
network classifiers for controlling the severe attack
prediction/false alarm rate tradeoffs.
6.1 Classification with Reject Option
Classification with reject option (Chow, 1970) is an
efficient solution allowing to identify and reject the
data objects that will be probably misclassified. In-
deed, in many application areas such medical diagno-
sis, military target identification, etc. it is better to re-
ject (not classify) an object than misclassifying it. The
SECRYPT 2010 - International Conference on Security and Cryptography
18

reject option is crucial in our application especially
for limiting false alarm rates because the reliability of
inputs directly impacts the predictive and discrimina-
tion power of our prediction models (the greater the
uncertainty in the input data, the more difficult will
be the prediction of the nature of the analyzed alert
sequence). Moreover, this approach allows the user
to control the tradeoffs between the severe attach pre-
diction and the underlying false alarm rates.
A classification model can be seen as a means of dis-
criminating the frontiers defined by the objects shar-
ing the same class (as shown on illustration (a) of Fig-
ure 3 where the classifier is represented by the line
separating classes c
1
, c
2
and c
3
). As shown on Figure
3, in the literature there are two kinds of classification
with reject option:
1. Ambiguity Reject. As shown in illustration (b) of
Figure 3, in ambiguity reject the object to classify
belongs to several classes simultaneously, which
makes the classifier confused. This may be caused
by the fact that the modeled classes are not com-
pletely disjoint. This type of rejection is imple-
mented by detecting data objects that are close
to several classes simultaneously. Several tech-
niques are used to implement this approach. In
(Chow, 1970), the author proposed using the a
posteriori probability of the instance to be classi-
fied in different classes. In our approach for con-
trolling the prediction/false alarm rate tradeoffs,
we will act on the width of the grey-colored region
of illustration (b) of Figure 3 separating the differ-
ent classes to specify the confidence with which
our prediction model is expected to make the good
prediction (see Equation 4).
2. Distance Reject. This situation occurs when the
instance to classify does not belong to any of the
classes represented by the classification model.
This may be due to the existence of a class which
is not represented or that the item to classify is
outlier. As shown in illustration (c) of Figure 3,
distance reject is used to define the classes mod-
eled by the classifier and can thus reject what is
beyond its frontiers. In the illustration (c) of Fig-
ure 3, the grey-colored region represents the mod-
eled classes and all the data instances that fall out-
side its frontier will be rejected and considered
as outliers. In practice, this solution is imple-
mented by measuring the degree of belonging or
distance from the object to classify with the differ-
ent classes. A threshold is often set below which
the objects to classify are rejected. In Bayesian
network-based classifiers, this reject option can
easily be implemented by fixing a threshold on the
likelihood or the a posteriori probability of the ob-
ject to classify with respect to the existing classes.
Figure 3: Geometric representation of classification (a) am-
biguity reject (b) and distance reject (c)
Note that the distance reject is not relevant for con-
trolling the severe attack prediction/false alarm rate
tradeoffs since alert sequences are either followed by
severe attacks or not (there is no other alternative to
be captured by the distance rejection). The reader
can refer to (Leray et al., 2000) for discussions on
classifiers’ confidence evaluation and reject option
rules interpretation. In the following, we present our
approach for controlling the attack prediction/false
alarm rate tradeoffs based on the ambiguity reject op-
tion.
6.2 Controlling the Attack
Prediction/False Alarm Rate
Tradeoffs
Bayesian network-based classifiers are naturally suit-
able for implementing the classification with reject
HANDLING IDS' RELIABILITY IN ALERT CORRELATION - A Bayesian Network-based Model for Handling IDS's
Reliability and Controlling Prediction/False Alarm Rate Tradeoffs
19

option as classification is ensured by computing a
posteriori probabilities of class instances given the
data to be classified. Each probability P(c
i
/a
1
..a
n
)
can be interpreted as the confidence of the classifier
that the instance to classify belongs to class instance
c
i
. In our application, we are interested in controlling
the attack prediction/false alarm rate tradeoffs accord-
ing to the contexts and needs of each final user. For
example, a user may want an alert correlation tool
with high confidence (with minimum false alerts).
This objective requires rejecting the alert sequences
where the tool is not very confident. Let us define
the confidence concept in our application as the un-
signed value of the difference of the probability that
the instance to classify a
1
a
2
..a
n
is not a severe attack
and the probability that a
1
a
2
..a
n
is actually a severe
attack. This measure is adapted from the works of
P. Leray et al (Leray et al., 2000) on classifiers con-
fidence evaluation. It is done by measuring the gap
between the probability that the alert sequence will
not be followed by a severe attack (namely p(c
i
=
0/a
1
..a
n
)) and the greatest probability that the event
will be followed by a severe attack. Namely,
ϕ(a
1
..a
n
) = |p(c
i
= 0/a
1
..a
n
) − max
c
i
6=0
p(c
i
/a
1
..a
n
)|,
(3)
where c
i
=0 denotes the class instance representing
alert sequences that are not followed by severe attacks
while class instance c
i
6=0 denote class instances asso-
ciated with the severe attacks to predict. The value of
ϕ(a
1
a
2
..a
n
) gives an estimate of the classifier’s con-
fidence that the analyzed alert sequence will/will not
be followed by a severe attack. Hence, a user want-
ing to reject all alert sequences where the probability
of not being an attack is not twice the probability that
they are severe attacks is done by setting the reject
threshold L to the value 1/3. Note that the a posteriori
probabilities of the classes given the alert sequence to
analyze must be normalized in order to be used for
implementing the reject option. Then, the Bayesian
decision rule of Equation 1 will be reformulated as
follows:
Class =
argmax
c
k
∈D
C
(p(c
i
/a
1
..a
n
)) i f ϕ(a
1
..a
n
) > L
/
0 otherwise
(4)
The value
/
0 denotes the reject decision, namely the
instance to be classified is rejected because the condi-
tion ϕ(a
1
..a
n
)>L is not satisfied. In the following, we
provide our experimental studies on real IDMEF alert
corpus.
7 EXPERIMENTAL STUDIES
In this section, we first describe our experimentation
setup (alert data preprocessing and training/testing
sets). Then, we compare a standard Bayesian clas-
sifier with the same variant but handling the IDS’ re-
liability on a real and representative alert corpus. Fi-
nally, we evaluate the reject option for controlling the
prediction/false alarm rate tradeoffs.
7.1 Experimentation Setup
Our experimental studies are carried on real and re-
cent alert log files produced by Snort IDS monitoring
a university campus network. These alert logs rep-
resent three months activity collected during summer
2007 within the framework of PLACID project
3
ded-
icated to probabilistic and logic approaches for alarm
correlation in intrusion detection. The input to our
system consists in alerts generated by Snort gathered
in IDMEF format (Debar et al., 2007). This latter is
an XML standard designed to allow inter-operability
of multiple security tools. In the following we briefly
present our alert preprocessing tool needed in both
the training phase (for preparing labeled training data)
and analysis phase for predicting severe attacks.
7.1.1 Alert Preprocessing Tool
In order to preprocess IDMEF alerts into CSV data
that can be used for training our models, we devel-
oped an alert preprocessor taking as input IDMEF
alert log files and preprocessing options and out-
putting alert sequences in CSV format. Among the
preprocessing options provided by the user in the pre-
processing option file, we find:
• Window Duration (in secs). the duration of the
alert windows can be defined by the user accord-
ing the traffic flow rates, the processing overload,
analysis periodicity, etc. Our prediction models
analyze alerts summarized in alert sequence vec-
tors. For instance, if the alert sequence duration is
set to 1 hour, than our preprocessing tool will rep-
resent all the alerts reported during the last hour
in one alert sequence vector.
• Predictors Set. This set provides the alert identi-
fiers (sid) that will be used as predictor variables.
• Severe Attacks Set. This set lists the set of severe
attack identifiers (sid) the user wants to predict.
Note that our preprocessing tool is used in off-line
mode to provide the labeled data for training the pre-
diction models. The labeling task is done automati-
3
http://placid.insa-rouen.fr
SECRYPT 2010 - International Conference on Security and Cryptography
20

cally following the attack identifiers listed in the se-
vere attacks set. In prediction mode, the tool prepro-
cesses in real-time sequences of alerts generated by
IDSs and submits the preprocessed alerts for analysis.
7.1.2 Training and Testing Sets
In order to evaluate the effectiveness of our predic-
tion model for handling IDSs’ reliability and control-
ling the prediction/false alarm rate tradeoffs, we car-
ried out experimentations on real IDMEF alerts. We
first preprocessed the first month of collected alerts
in order to build the training data set and prepro-
cessed the second month to build the testing set. Ta-
ble 1 provides details on the severe attacks we used
in our experimentations. Among the severe attacks
Table 1: Training and testing set distributions.
Training set Testing set
Sid Snort alert name # % # %
1091 WEB-MISC ICQ... 87 0,18% 6 0,01%
2002 WEB-PHP remote... 50 0,10% 231 0,47%
2229 WEB-PHP viewtopic..s 5169 10,42% 1580 3,20%
1012 WEB-IIS fpcount ... 3 0,01% 10 0,02%
1256 WEB-IIS CodeRed v2... 2 0,004% 3 0,01%
1497 WEB-MISC cross site... 5602 11,30% 7347 14,90%
2436 WEB-CLIENT Microsoft 145 0,29% 53 0,11%
1831 WEB-MISC jigsaw dos... 659 1,33% 153 0,31%
1054 WEB-MISC weblogic.. 3412 6,88 % 3885 7,88%
detected by Snort, we selected 9 Web-based severe
attacks to predict on the basis of the alerts that often
precede/prepare these severe attacks. All these attacks
are associated with a high severity level and are tar-
geting either Web servers or related web-based appli-
cations. Such attacks may result in arbitrary code ex-
ecution and full control of the targeted system. As for
selecting the set of relevant predictors for our severe
attacks, we first extracted all the existing alerts involv-
ing the same victims as the severe attacks then using
the information gain selection feature procedure, we
selected a subset of relevant features. Note that the
feature extraction process is similar to the works of
(Benferhat et al., 2008a)(Bin and Ghorbani, 2006). In
our experimentations, we used as predictors the Snort
alerts whose sid are 2, 3, 4, 7, 15, 16, 18, 839, 853,
882, 895, 1013, 1112, 1141, 1142, 1147, 1214, 1288,
1301, 1478, 1767, 1852, 2142, 2280, 2286, 2565 and
2566.
In the following, we report our experimental re-
sults on handling the IDS’ reliability especially for
reducing the false alarm rate.
7.2 Experimentation 1: Severe Attack
Prediction Taking into Account the
IDS’ Reliability
In this experimentation, we implemented the virtual
evidence method as follows:
• For each alert A
i
used as a predictor, we first
checked in Snort’s database whether the rule as-
sociated with this attack is known to produce
false positives. In the positive case, we com-
puted on a representative corpus of the training
data set the proportion of alerts A
i
which actu-
ally correspond to true attacks. Namely, we com-
puted two parameters p(A
i
=1/Attack=True) and
p(A
i
=1/Attack=False). Note that taking account
false negatives is in our case impossible because
we have not the original network traffic in order
to check whether there are attacks which were not
detected by Snort.
• When an alert sequence is submitted for analysis,
the prediction is performed on the Bayesian net-
work where the alert variables A
i
are augmented
by virtual evidence nodes (observed variables) R
i
to handle the reliability of inputs.
Table 2 gives the results of handling the reliability
of Snort IDS producing the alert sequences we ana-
lyze. In order to evaluate the effectiveness of handling
Table 2: Experimental results of MWST and VE-MWST
classifiers.
Sid Snort alert name MWST VE-MWST
1091 WEB-MISC ICQ Webfront... 0% 0%
2002 WEB-PHP remote... 26,84% 25,97%
2229 WEB-PHP viewtopic... 72,15% 74,30%
1012 WEB-IIS fpcount... 0% 0%
1256 WEB-IIS CodeRed v2 .. 0% 0%
1497 WEB-MISC cross site... 95,62% 93,32%
2436 WEB-CLIENT Microsoft 56,60% 56,60%
1831 WEB-MISC jigsaw dos... 56,41% 37,25%
1054 WEB-MISC weblogic... 47,77% 41,83%
Prediction rate 76,92% 73,88%
False alarm rate 1,58% 0,74%
IDSs’ reliability in Bayesian network-based classi-
fiers, we compare it with a Bayesian network-based
classifier built using MWST (Chow and Liu, 1968)
which is a scored based structure learning algorithm
that rapidly builds simple and efficient tree structures
(Francois and Leray, 2004) representing the correla-
tions between alert variables. The results of Table
2 show that the VE-MWST classifier implementing
the virtual evidence method for handling the reliabil-
ity of Snort IDS achieves comparable prediction rates
with respect to MWST classifier but significantly re-
duces the false alarm rate down to 0,74% (the false
HANDLING IDS' RELIABILITY IN ALERT CORRELATION - A Bayesian Network-based Model for Handling IDS's
Reliability and Controlling Prediction/False Alarm Rate Tradeoffs
21
alarm rate was decreased from 29 down to only 13
false alarms/day).
Note that this result is achieved by handling the
true/false positive reliability relative to only three
alerts (those having sid=882, sid=1288 and sid=1852)
constituting the majority of false alerts triggered by
Snort in our data sets (see (Tjhai et al., 2008) for
an analysis of these false alarms triggered by Snort).
Such results are very promising but require a rigor-
ous reliability assessment and handling false nega-
tives which are very time consuming tasks. Indeed, in
order to efficiently use our approach, one has to rigor-
ously assess both the true/false positive and negative
rates which is a very time consuming tasks. More
specifically, in order to assess the true/false positive
rates, one has to check for each alert A
i
the proportion
of A
i
instances which actually correspond to real at-
tacks. In order to assess the true/false negative rates,
all the network traffic should be analyzed in order to
evaluate the proportion of attacks that were not de-
tected by the IDSs. Clearly, assessing the true/false
positive and negative rates are very complicated and
time consuming tasks. Moreover, there is need to
reevaluate them more frequently in order to take into
account new menaces and attacks, etc.
7.3 Experimentation 2: Controlling the
Attack Prediction/False Alarm Rate
Tradeoffs
Table 3 provides the results of using the ambiguity re-
ject for controlling the attack prediction/false alarm
rate tradeoffs. In this experimentation, we defined
different confidence levels L and we used the same
Bayesian MWST classifier as in experimentation 1.
Table 3 provides detailed results on the effect of us-
Table 3: Experimental evaluation of controlling the attack
prediction/false alarm rate tradeoffs.
Sid Snort alert name MWST L=1/5 L=1/3
1091 WEB-MISC ICQ Webfront... 0% 0% 0%
2002 WEB-PHP remote... 25,97% 15,02% 15,02%
2229 WEB-PHP viewtopic... 74,30% 74,19% 73,89%
1012 WEB-IIS fpcount... 0% 0% 0%
1256 WEB-IIS CodeRed v2 .. 0% 0% 0%
1497 WEB-MISC cross site... 93,32% 93,32% 93,32%
2436 WEB-CLIENT Microsoft... 56,60% 37,50% 37,50%
1831 WEB-MISC jigsaw dos... 37,25% 25,97% 25,45%
1054 WEB-MISC weblogic... 41,83% 39,60% 39,60%
Prediction rate 73,88% 65,39% 65,21%
False alarm rate 0,74% 0,68% 0,65%
ing the reject option in order to control the attack pre-
diction/false alarm rate tradeoffs. As expected, the
false alarm rate decreases proportionally to the value
of the confidence level L. However, the prediction
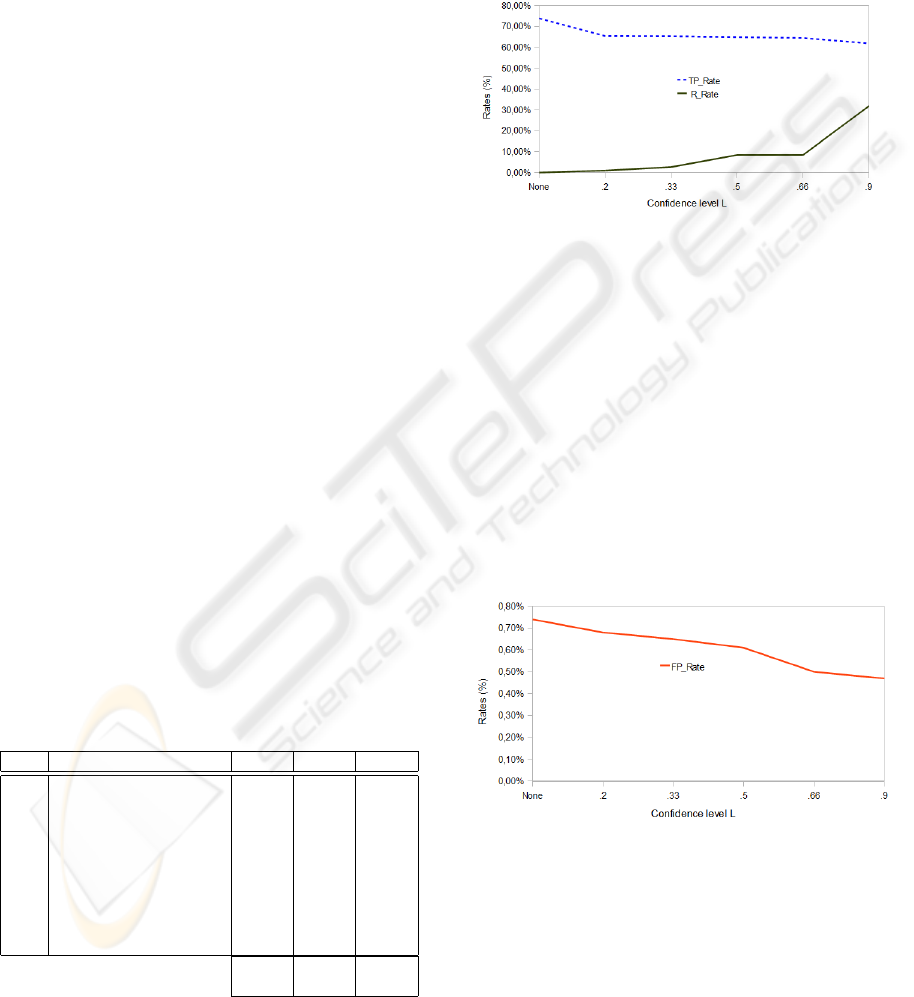
rates of some severe attacks also decrease. Figure 4
gives the variation of the prediction rate (FPRate) and
the rejection rate (RRate) at different confidence lev-
els L. The rejection rate gives the proportion of alert
sequences that were rejected by our severe attack pre-
dictor. Results of Figure 4 show that the T PRate de-
Figure 4: T PRate and RRate variation at different levels of
L.
creases slightly as we augment the value of the confi-
dence level L while the rejection rate RRate increases
significantly. Indeed, Figure 4 shows that it is possi-
ble to achieve a very high severe attack prediction rate
while rejecting only a small amount of the analyzed
alert sequences (see T PRate and RRate when L=.33).
However, when L is set to .9 (to force the model to
take decisions only when it is very confident) the pro-
portion of alert sequences which are rejected attains
31,92%. As for the evolution of the false alarm rate
(FPRate) at the different confidence levels, Figure 5
gives the FPRate of the same experimentation of Fig-
ure 4. Figure 5 shows that the false alarm rate can be
Figure 5: FPRate variation at different levels of L.
controlled by fixing the appropriate value for the con-
fidence level L. Clearly, our approach offers an effi-
cient, flexible and configurable model for predicting
severe attacks. Moreover, our approach requires min-
imum expert knowledge and the computational com-
plexity of handling IDSs’ reliability and implement-
ing the reject option is nearly the same as the standard
classification based on Bayesian networks.
Because of the class imbalance in our testing data
SECRYPT 2010 - International Conference on Security and Cryptography
22
set and the difference in misclassification costs, the
evaluation of our prediction model based only on the
prediction rate (T P Rate) is not sufficient. Indeed,
our testing data set is dominated by alerts sequences
which mostly are not followed by severe attacks while
the misclassification cost of a false alarm and the
cost of a missed attack (false negative) are clearly not
equivalent. Therefore, additional experimentations
are carried out in order to draw the ROC curve
4
of
our prediction model. A ROC curve (Fawcett, 2003)
allows to visualize the fluctuations existing between
the True Positive Rate (in our case, the true predic-
tion rate T P Rate) and the corresponding false pos-
itive rate (denoted in this paper FP Rate) which are
the two most important measurements of IDSs per-
formance. More precisely, a ROC curve is a two-
dimensional graph where the T P Rate is plotted on
the Y-axis while the FP Rate is plotted on the X-axis.
Each couple T P Rate and its corresponding FP Rate
is represented by a point in the ROC curve. Note
that in order to draw the ROC curves evaluating our
severe attack prediction model, we used the method
proposed in (Fawcett, 2003) and sorted testing data
instances after computing for each testing alert se-
quence a score measuring how much the instance in
hand is not likely a severe attack. This score is the a
posteriori probability of not being a severe attack.
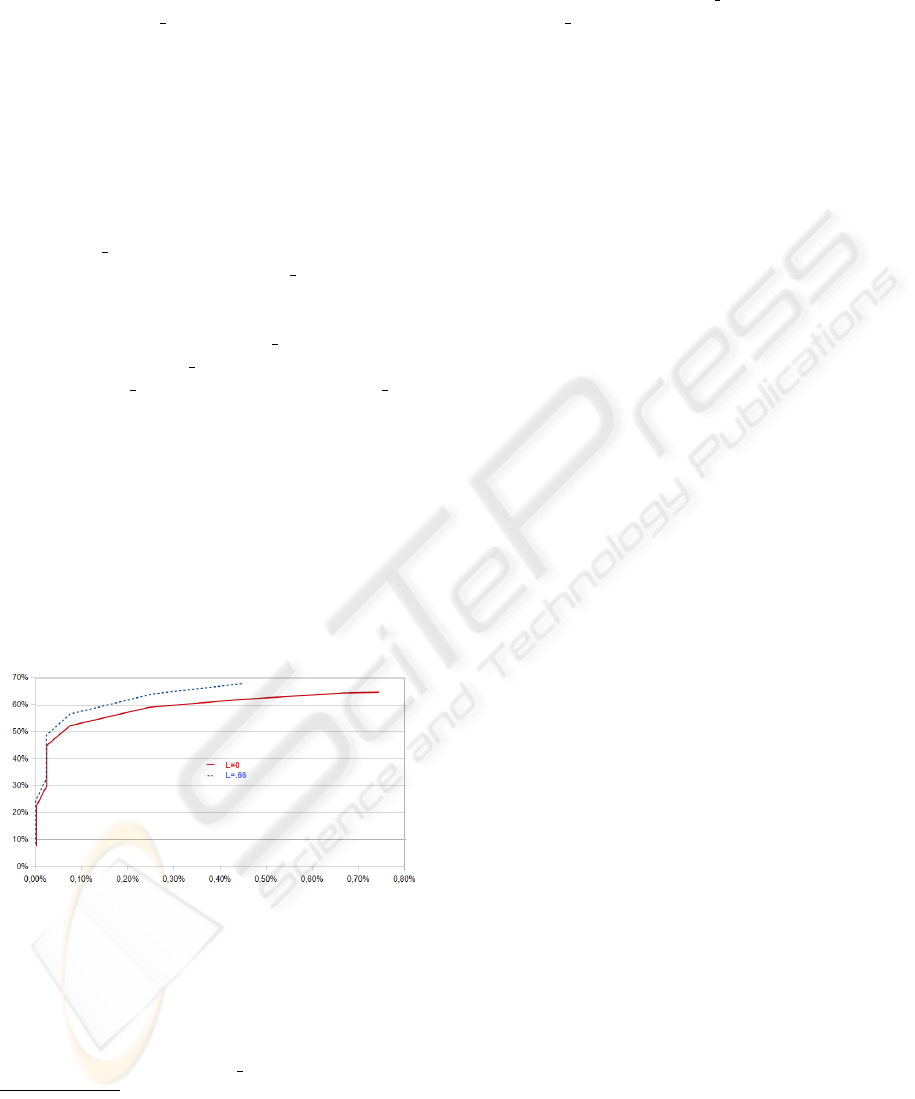
Figure 6 gives the ROC curves of our predic-
tion model evaluated on the testing data of Table 1.
Clearly, Figure 6 shows that our prediction model
Figure 6: ROC curve of the prediction model with confi-
dence levels of L=0 and L=.66.
with a confidence level L=.66 is more effective than
without using the prediction/false alarm tradeoffs
mechanism. In particular, when L=.66 the prediction
model attains better prediction rates at low false alarm
rates. For instance, when FP rate equals 0.25%, the
4
A Receiver Operating Characteristics (ROC) curve is a
technique originally used in the signal detection theory in
order to describe the relationships between the capacity of
detecting a signal and the underlying noise. For a detailed
tutorial on ROC curves for machine learning and data min-
ing techniques, see (Fawcett, 2003).
prediction model using the reject option with L=.66
achieves a prediction rate T P rate=63.84% while it
is about T P rate=59.18% without the reject option.
The experimental results provided in this section
clearly show the effectiveness of our prediction model
for predicting severe attacks and controlling the pre-
diction/false alarm rate tradeoffs.
8 CONCLUSIONS
This paper addressed a crucial issue in the field of
alert correlation consisting in handling IDS’s relia-
bility and controlling the prediction/false alarm rate
tradeoffs. More specifically, we proposed to take into
account the reliability of IDSs’ as it is a relevant infor-
mation on the inputs used by the alert correlation en-
gines. However, exploiting the IDSs’ reliability neg-
atively impacts the predictive power of our model. In
order to better control the prediction/false alarm rate
tradeoffs, we proposed an approach based on classi-
fication with reject option allowing to reject alert se-
quences where the prediction model has not enough
confidence to make a good prediction. Handling
IDS’s reliability and implementing the reject option
are naturally and easily implemented using Bayesian
network-based classifiers. Our experimental results
are very promising especially when one appropriately
assesses the reliability of the IDSs and the confidence
level.
As future directions, it would be very interesting
to take into account and exploit the IDSs reliability
not only during the prediction phase, but also when
building the prediction models from empirical data.
Indeed, while reasoning with unreliable information
(data provided by unreliable sources) has received
much interest, all the approaches for learning prob-
abilistic graphical models (and other prediction mod-
els) implicitly assume that training data is cleaned and
ignore the reliability of sources even if such informa-
tion is available.
ACKNOWLEDGEMENTS
This work is supported by the (ANR) SETIN 2006
PLACID project (Probabilistic graphical models and
Logics for Alarm Correlation in Intrusion Detection
http://placid.insa-rouen.fr/)
HANDLING IDS' RELIABILITY IN ALERT CORRELATION - A Bayesian Network-based Model for Handling IDS's
Reliability and Controlling Prediction/False Alarm Rate Tradeoffs
23

REFERENCES
Axelsson, S. (2000). Intrusion detection systems: A sur-
vey and taxonomy. Technical Report 99-15, Chalmers
Univ.
Benferhat, S., Kenaza, T., and Mokhtari, A. (2008a).
False alert filtering and detection of high severe alerts
using naive bayes. In Computer Security Confer-
ence(CSC’08), South Carolina.
Benferhat, S., Kenaza, T., and Mokhtari, A. (2008b). Tree-
augmented naive bayes for alert correlation. In 3rd
conference on Advances in Computer Security and
Forensics(ACSF’08), pages 45–52.
Benferhat, S. and Sedki, K. (2008). Alert correlation based
on a logical handling of administrator preferences and
knowledge. In International Conference on Secu-
rity and Cryptography(SECRYPT’08), pages 50–56,
Porto, Portugal.
Bin, Z. and Ghorbani, A. (2006). Alert correlation for
extracting attack strategies. I. J. Network Security,
3(3):244–258.
Cheng, J. and Greiner, R. (2001). Learning bayesian be-
lief network classifiers: Algorithms and system. In
14th Conference of the Canadian Society on Compu-
tational Studies of Intelligence, pages 141–151, Lon-
don, UK. Springer-Verlag.
Chow, C. (1970). On optimum recognition error and reject
tradeoff. IEEE Transactions on Information Theory,
16(1):41–46.
Chow, C. and Liu, C. (1968). Approximating discrete prob-
ability distributions with dependence trees. Informa-
tion Theory, IEEE Transactions on, 14(3):462–467.
Cuppens, F. and Mi
`
ege, A. (2002). Alert correlation in a
cooperative intrusion detection framework. In IEEE
Symposium on Security and Privacy, pages 187–200,
USA.
Debar, H., Curry, D., and Feinstein, B. (2007). The Intru-
sion Detection Message Exchange Format (IDMEF).
Debar, H. and Wespi, A. (2001). Aggregation and correla-
tion of intrusion-detection alerts. In Recent Advances
in Intrusion Detection, pages 85–103, London, UK.
Springer-Verlag.
Faour, A. and Leray, P. (2006). A som and bayesian network
architecture for alert filtering in network intrusion de-
tection systems. In RTS - Conference on Real-Time
and Embedded Systems, pages 1161–1166.
Fawcett, T. (2003). Roc graphs: Notes and practical consid-
erations for data mining researchers. Technical Report
HPL-2003-4, HP Laboratories, Palo Alto, CA, USA.
Francois, O. and Leray, P. (2004). Evaluation
d’algorithmes d’apprentissage de structure pour les
r
´
eseaux bay
´
esiens. In Proceedings of 14eme Congr
`
es
Francophone Reconnaissance des Formes et Intel-
ligence Artificielle, RFIA 2004, pages 1453–1460,
Toulouse, France.
Jensen, F. V. and Nielsen, T. D. (2007). Bayesian Networks
and Decision Graphs (Information Science and Statis-
tics). Springer.
Leray, P., Zaragoza, H., and d’Alch-Buc, F. (2000). Per-
tinence des mesures de confiance en classification.
In 12eme Congres Francophone AFRIF-AFIA Re-
connaissance des Formes et Intelligence Articifielle
(RFIA 2000), pages 267–276, Paris, France.
Morin, B., M, L., Debar, H., and Ducass, M. (2009). A
logic-based model to support alert correlation in intru-
sion detection. Information Fusion, 10(4):285–299.
Ning, P., Cui, Y., and Reeves, D. S. (2002). Constructing at-
tack scenarios through correlation of intrusion alerts.
In 9th ACM conference on Computer and communica-
tions security, pages 245–254, NY, USA. ACM.
Patcha, A. and Park, J. (2007). An overview of anomaly de-
tection techniques: Existing solutions and latest tech-
nological trends. Computer Networks, 51(12):3448–
3470.
Pearl, J. (1988). Probabilistic reasoning in intelligent sys-
tems: networks of plausible inference. Morgan Kauf-
mann Publishers Inc., San Francisco, CA, USA.
Staniford, S., Hoagland, J. A., and McAlerney, J. M. (2002).
Practical automated detection of stealthy portscans. J.
Comput. Secur., 10(1-2):105–136.
Tjhai, G. C., Papadaki, M., Furnell, S., and Clarke, N. L.
(2008). Investigating the problem of ids false alarms:
An experimental study using snort. In 23rd Inter-
national Information Security Conference SEC 2008,
pages 253–267.
Valdes, A. and Skinner, K. (2000). Adaptive, model-based
monitoring for cyber attack detection. In Recent Ad-
vances in Intrusion Detection, pages 80–92.
Valdes, A. and Skinner, K. (2001). Probabilistic alert cor-
relation. In Recent Advances in Intrusion Detection,
pages 54–68, London, UK. Springer-Verlag.
Verleysen, M., Rossi, F., and Franc¸ois, D. (2009). Ad-
vances in Feature Selection with Mutual Information.
In Villmann, T., Biehl, M., Hammer, B., and Verley-
sen, M., editors, Similarity-Based Clustering, Lecture
Notes in Computer Science, pages 52–69. Springer
Berlin / Heidelberg.
Wojciech, T. (2008). Anomaly-based intrusion detection us-
ing bayesian networks. depcos-relcomex, 0:211–218.
SECRYPT 2010 - International Conference on Security and Cryptography
24
