
PANHAA SYSTEMIC DESIGN OF REGULATION ENABLING
ONTOLOGY
Anshuman B. Saxena
1,2
and Alain Wegmann
1
1
Systemic Modeling Laboratory, School of Computer and Communication Sciences
EPFL Station 14, CH-1015 Lausanne, Switzerland
2
TATA Consultancy Services Innovation Labs, Bangalore
EPIP Industrial Area, Whitefield, Bangalore 560 066, India
Keywords: Industry Regulation, Systems Thinking, SEAM.
Abstract: The deregulation of economies has re-created the need for regulation. From a Systems perspective, the
unbundling of large monolithic industrial setups into smaller independent companies results in the
dissolution of high level management structures which, in the pre-deregulated era, had the overall control of
the end-to-end delivery process. In the absence of such holistic oversight mechanisms, deregulated
industries remain vulnerable to systemic failure. Industry regulators need to go beyond the usual concerns of
price, quality, and access, and invest in methods that capture the interactions between the different
stakeholders in an industry. It is the understanding of the individual interactions that can help piece together
a holistic view of the industry; thereby allowing the regulator to devise well informed interventions. In this
paper we model industry interactions as a multi-party value realization process and take a Systems approach
in analyzing them. Every value realization is analyzed both at the industry level and at the level of
stakeholders within the industry. The design patterns that emerge from this whole/composite view of value
realization form the basis for formalizing the concepts required to analyze the working of an industry. An
explicit specification of these concepts is presented as Regulation Enabling Ontology, REGENT.
1 INTRODUCTION
The deregulation of economies has led to the
unbundling of large, vertically integrated,
monolithic, industrial monopolies into lean, efficient
and more focused entities with the freedom to
develop upstream and downstream interconnections
(Baldwin & Cave, 1999). Network Industries (Shy,
2004), such as electricity, telecommunication,
transportation, posts, gas and water supply, are most
representative of such restructuring. From a
management perspective, such unbundling results in
the dissolution of the high level management
structures which, in the pre-deregulated era, were
responsible for the complete end-to-end delivery
process. A deregulated industry is, instead,
composed of multiple smaller management
structures, each restricted in scope to some specific
aspect of the overall industry. For instance, the
deregulation of Electricity Supply Industry
(Zaccour, 1998) led to its restructuring along
functional lines. Separate companies emerged for
generation, transmission and distribution of
electricity. These companies have independent
management structures, each responsible for their
part of the industry and interacting purely on an
economic basis. The absence of a holistic industry
wide management structure makes deregulated
industries vulnerable to systemic failure. Modern
regulatory systems need to go beyond the usual
concerns of price, quality, output and access, and
invest in schemes that capture the interactions
among the stakeholders of the industry.
Understanding these individual interactions help
piece together a holistic view of the industry,
thereby allowing the regulator to devise well
informed interventions that can ensure the
sustainable development of the overall industry.
Industries are composed of multiple stakeholder
groups: the companies that supply certain goods or
services, the individuals that consume them, the
government that facilitates these transactions and the
environment that provides the necessary backdrop
for these interactions. Any interaction within an
70
B. Saxena A. and Wegmann A..
A SYSTEMIC DESIGN OF REGULATION ENABLING ONTOLOGY.
DOI: 10.5220/0003097000700083
In Proceedings of the International Conference on Knowledge Engineering and Ontology Development (KEOD-2010), pages 70-83
ISBN: 978-989-8425-29-4
Copyright
c
2010 SCITEPRESS (Science and Technology Publications, Lda.)

industry can be reduced to an instance of the multi-
party relation that exists between these four
stakeholder groups. The plurality in relationship and
the diversity in stakeholder beliefs that underlie
these relationships make the effort of developing a
holistic understanding of an industry even more
challenging.
To address these challenges, we invoke the
notion of value and model every relationship in an
industry as a set of value realization processes.
Value is a qualitative concept and, thus, well suited
for an interdisciplinary discourse. Taking a Systems
perspective, we analyze the value realization process
both at the industry level and at the level of
individual stakeholders within the industry. Two
important design patterns emerge from this
whole/composite view of value exchange: any value
created in an industry has an associated supplier and
adopter, a supplier of one set of value is an adopter
of some other set of value. These design patterns
form the basis for formalizing the concepts required
to explain multi-party relationships in an industry.
This paper is an attempt to provide an explicit
specification of these concepts as ontology. The
ontology will provide regulators with a standard
representational vocabulary with which they can
document the material and information interplay
between the different stakeholders of an industry. It
is the abstraction of industry specific configuration
details as shared pan-industry concepts that will
facilitate the knowledge-level communication
among the community of regulators, thereby
enabling more effective and speedy sharing of
regulatory best practices. Section 2 provides a brief
overview of Systems thinking approach and presents
a Systems perspective of the de-regulated electricity
supply industry. Section 3 explores the notion of
value in greater detail and introduces the concepts of
resource and feature as building blocks of the value
realization process. Section 4 describes the
Regulation Enabling Ontology, REGENT, in detail,
highlighting the different design choices that were
made during the development of REGENT. Section
5 instantiates REGENT for the Urban Household
Electricity Industry and, as an example,
demonstrates its effectiveness in establishing
regulatory oversight. Section 6 presents some related
work in this field. The paper concludes with future
work directions in Section 7.
2 A SYSTEMS PERSPECTIVE OF
INDUSTRY
A Systems approach to understanding the
relationship between the stakeholders of an industry
allows taking a holistic view of the industry and
analyzing how these relationships influence one
another in the context of the overall well being of
the industry. This is particularly useful for
deregulated industries where management structures
only exhibit knowledge about local relationships and
the relevance of these relationships to the entire
system remains largely unexplored. For a regulator
to act as a true custodian of the industry, it is
important that it has the complete knowledge about
the different interactions that occur in an industry
and the bearing these relationships may have on the
overall working of the industry. To further illustrate
the affect of deregulation on the overall management
of the industry, we use the visual semantics of
SEAM to analyze the evolution of Electricity Supply
Industry.
SEAM is a set of Systemic Enterprise
Architecture Methods (Wegmann, Julia, Regev, &
Rychkova, 2007) that exploit the principles of
General Systems Thinking (GST) (Weinberg, 1975).
GST advocates that the component parts of a system
can be best understood in the context of
relationships with each other and with other systems,
rather than in isolation. An important way to fully
analyze a system is to understand the part in relation
to the whole. SEAM represents any perceived reality
as a hierarchy of systems. Each system can be
analyzed as a whole [W] - showing its externally
visible characteristics or as a composite [C] –
showing its’ constituents as a set of interrelated
parts. When applying SEAM to an industry, two
main aspects are analyzed: (1) How different
stakeholders cooperate together to achieve some
common objective; these groups of stakeholders are
referred to as value network, VN. (2) How these
value networks interact within an industry; these
interactions are referred to as Multi-Party
Relationship, MPR. The visual syntax of SEAM
includes block arrows for systems, annotated ovals
for externally visible properties, diamonds for
relations, simple lines for active participation to a
relation, dashed lines for pseudo participation to a
relation and rounded end-point lines for emphasizing
the identical nature of modelling elements.
Figure 1 presents a SEAM depiction of a pre-
deregulated Electricity Supply industry. The four
prominent entities that engage in the activities of this
industry are the Electricity Supply Company (ESC),
Electricity Consumer VN, Government VN and the
Environment VN. When viewed as a whole, the ESC
[W] exhibits the overall responsibility of
maintaining an end-to-end supply of electricity –
PANHAA SYSTEMIC DESIGN OF REGULATION ENABLING ONTOLOGY
71
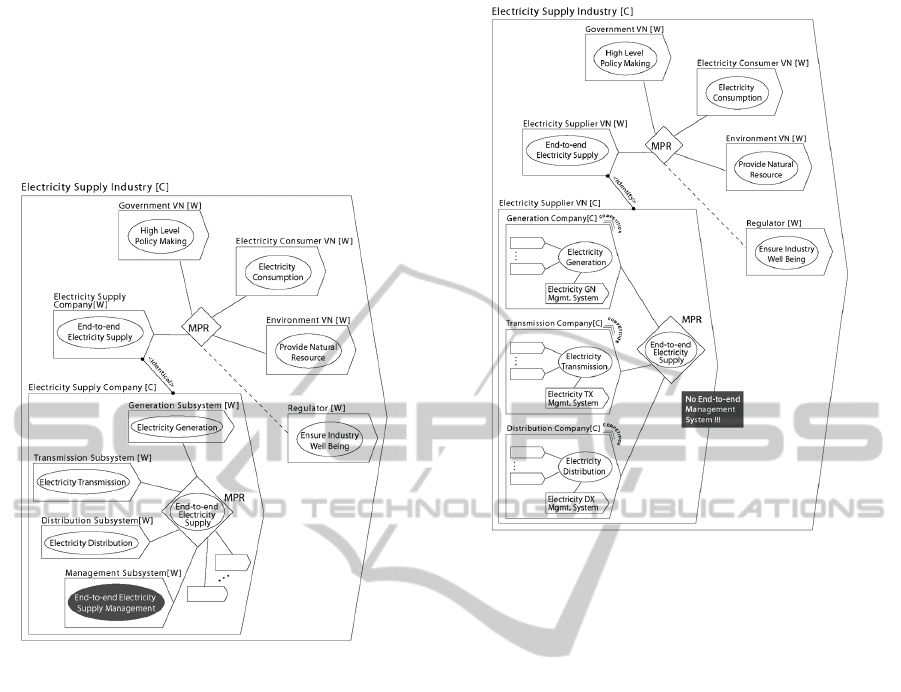
from generation to distribution. When viewed as a
composite, the ESC [C] reveals its’ constituent
subsystems. ESCs can have different architectures.
Nevertheless, for these subsystems to work as a
viable whole, each ESC has some form of
management subsystem (Beer, 1985) that oversees
the end-to-end delivery process.
Figure 1: Pre-deregulated Electricity Supply Industry.
Figure 2 presents a SEAM depiction of a
deregulated Electricity Supply Industry. The
vertically integrated ESC of the pre-deregulated era
stands unbundled into independent Generation,
Transmission and Distribution Companies. The
presence of multiple such companies constitutes
competition, and provides the Electricity Consumer
VN the choice to buy electricity from one
Generation Company, get it transmitted through
some other Transmission Company and receive the
end supply service from yet another Distribution
Company. These three companies when put together
represent the Electricity Supplier VN. From a
management perspective, each of these companies is
controlled by an independent management sub-
system which is strictly limited to its’ part of
industry operations, e.g. generation, transmission or
distribution. Unlike the pre-deregulated era, there
exists no end-to-end electricity supply management
system that can be held responsible for the overall
delivery of the supply.
Figure 2: Deregulated Electricity Supply Industry.
3 THE
RESOURCE-FEATURE-VALUE
TRIUNE
An industry is a complex composition of diverse
stakeholder groups. Suppliers are primarily
concerned about issues related to market share,
profit and return-on-investment; consumers are
concerned about cost, availability, reliability and
ease-of-use; governments are concerned about
collective welfare, institutional relevance and
political indispensability; and the issues of interest
from an environment point of view include habitat
and climate related ecological concerns. To realize
the benefits of Systems approach in analyzing the
different facets of an industry, it is important to first
identify a unifying concept that can act as a generic
platform for the interdisciplinary discourse required
in an industry. In this paper we exploit the notion of
value as the unifying concept and treat the above
mentioned stakeholder concerns as context specific
manifestations of the value concept.
Based on the analysis presented in (Ramsay,
2005), we define value as the tangible or intangible
effect accrued by a stakeholder through the
consumption or trade of a service or good. The
notion of value is at the heart of MPR modeling.
KEOD 2010 - International Conference on Knowledge Engineering and Ontology Development
72
Stakeholders aspiring for a common set of value are
grouped together as a VN. MPR models industry
interactions as a value realization process between
VNs. VNs exchange resources, material and
information. Any resource addition to the VN affects
the stakeholders of the VN either in a favorable way,
realizing positive value, or in an unfavorable way,
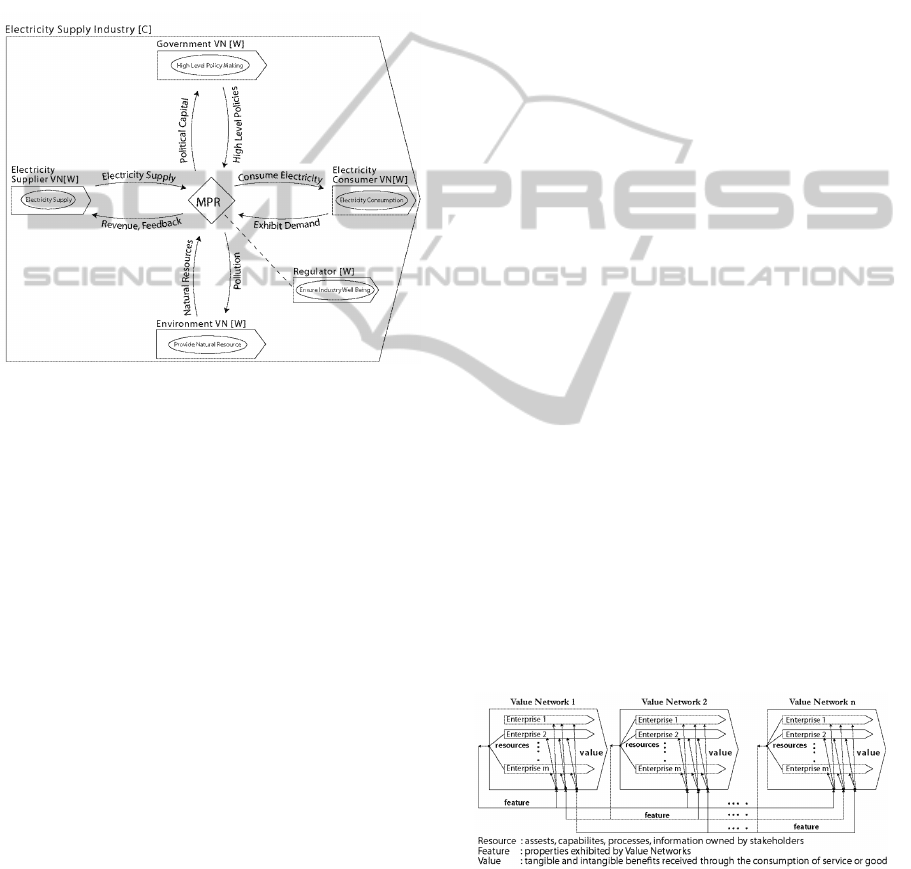
realizing negative value. Figure 3 depicts MPR as a
bi-directional value realization process between the
different VNs in an Electricity Supply Industry.
Figure 3: Bi-directional value realization in MPR.
Value is a subjective notion, dependent exclusively
on stakeholder perceptions. An effect welcome by
some stakeholders may be completely rejected by
others. For example, time based electricity pricing
schemes where a consumer can pay less for off peak
electricity usage is perceived by many as a positive
value as it provides an opportunity to reduce
electricity bills by shifting workloads to low cost off
peak durations. For others this may not be a
welcome change as it results in increased night time
activity in the neighbourhood. As a result it is
desirable to explicitly specify the context in which a
value is created, delivered or consumed. We
accomplish this by introducing the concepts of
resource and feature.
We follow the definition given in (Barney, 1991),
where resources are defined as “... assets,
capabilities, processes, and information” in control
of the stakeholder. Thus resource can be considered
as the contribution an individual stakeholder can
bring to a VN. Feature on the other hand is a
composite attribute which exists only at the VN
level. Based on the resources available with the
different stakeholders of a VN, the VN may exhibit
different properties. These properties emerge from
the different combinations between these resources,
and are known as the features of the VN. For a given
industry, an MPR identifies the different resources
available with each VN, the set of possible features
that may emerge from them and the value these
features may bring to the other VNs. The same is
presented in Figure 4. The use of the term enterprise
in the figure is a more formal way of referring to
stakeholders constituting a VN. The resource,
feature and value concepts coupled with the GST
inspired whole-composite view of value exchange
guides our ontology design activity. Two important
design patters emerge from this combination.
D1. For every value created in an industry there
exists a supplier VN and an adopter VN
D2. Each VN in an industry acts as a supplier of one
set of value and an adopter of another set of value
Supplier and adopter are roles assigned to VNs
while analyzing MPRs. The supplier role signifies
ownership of resources required to create/produce
and deliver the services or goods. The adopter role
signifies ownership of resources required to
consume the service or good thereby realizing the
value advertised through the features of the service
or good.
Design Patterns have their genesis in the field of
architecture where they were first proposed as an
architectural concept by Christopher Alexander
(Alexander, 1979). These were later adopted in
software engineering, and are defined as an artifact
in the form of a construct, a model, a method or an
instantiation, which is general enough to be reusable
in solving commonly occurring problems (Gamma,
Helm, Johnson, Vlissides, & John, 1995). In this
paper we use these two design patterns as the basic
constructs for formally specifying the knowledge
required to formulate an overall understanding of
any industry.
Figure 4: The Resource-Feature-Value triune in MPR.
PANHAA SYSTEMIC DESIGN OF REGULATION ENABLING ONTOLOGY
73

4 REGENT: A REGULATION
ENABLING ONTOLOGY
As defined in (Gruber, 1993), ontology is an explicit
specification of a shared conceptualization. It is
aimed at formalizing a specific view point that
enables/enriches the discourse on some aspect of
interest in the real world. The purpose of REGENT
is to enable the discourse on industry regulation.
Formalization of the concepts that constitute an
industry and the relationships that hold among these
concepts provides a common vocabulary with which
regulators can represent their understanding of the
industry. Such a standardized way of documenting
information is particularly useful in promoting
knowledge-level communication between the
different industry regulators.
Various ontology languages exist to represent
these concepts and relationships. The most
prominent of these is OWL (W3C, 2004). It is
developed by the World Wide Web Consortium and
consists of individuals, properties, and classes.
Individuals represent the objects in the domain of
interest, properties are binary relations
on these
individuals, and classes are interpreted as sets that
contain these individuals. Our reference to concept
and relationship maps to the notion of class and
property in OWL. Individuals are instantiation of
concept. OWL has three sub-languages: OWL-Lite,
OWL-DL and OWL-Full. The expressiveness of
OWL-DL falls between that of OWL-Lite and
OWL-Full. It is based on Description Logics
(Baader, Calvanese, McGuinness, Nardi, & Patel-
Schneider, 2003) which are a decidable fragment of
First Order Logic and are thus conducive for
automated reasoning. For this purpose we use OWL-
DL as the language for specifying REGENT. The
development of REGENT was done using the
ontology development tool, Protégé (Stanford
Center for Biomedical Informatics Research, 2010).
The visualizations presented in this paper have been
created using the OntoViz graphical plug-in in
Protégé. In the following, we present our design
choices for REGENT.
REGENT has two top level classes:
IndustryConcept class and
ConceptSpacePartition class.
IndustryConcept
is the foundational class for all
the concepts in an industry. It is based on the
Resource-Feature-Value triune detailed in sub-
section 2.3.
ConceptSpacePartition is the class
which subsumes the different viewpoints that can be
useful in analyzing the set of concepts detailed in the
IndustryConcept class.
4.1 The IndustryConcept Class
The IndustryConcept class formalizes the
concepts of resource, feature and value. Figure 5
presents the taxonomy of the
Resource class. The
Resource class has two subclasses: Commercial
and
Operational. This refinement of the
Resource class is a manifestation of the design
pattern D2. As depicted in Figure 3, every value
realization is a bi-directional process. We exploit the
dual nature of VN, i.e. the simultaneous role of a
supplier of one value and an adopter of some other
value, to classify the resources available with a VN.
From an industry perspective, a product or service
creation process has two parts – the operational
process of bringing the service or good into
existence and the commercial process of making it
tradable (Smith, 1904). The operational process is
related to the supplier role of VN; the supplier has
complete control over this process. On the other
hand, the commercial process is related to the
adopter role of VN. It is aimed at making the service
or good conducive for consumption and, thus,
requires taking an adopter perspective. Accordingly,
the set of resources in an industry can be divided
into two – the ones required to realize the
operational process, the
RS_Operational class,
and the others required to realize the commercial
process, defined as the
RS_Commercial class.
We can further refine this classification by
exploiting the insights of the supplier and adopter
process. At the supplier end, bringing a service or
good into existence entails two aspects – production
and delivery. For instance, in the Electricity Supply
Industry it is not sufficient for the electricity to be
generated at the generation units, it is equally
important that it is available at the prospective
location of consumption. Operational resources that
contribute towards the production of the industry
offering are categorized as the
RS_OP_Production
class while the ones that contribute towards the
delivery of the industry offering are categorized as
the
RS_OP_Delivery class. At the adopter end,
realizing the benefits of the offering entails two
aspects – reception and consumption. For instance,
the complementary nature of electricity requires the
availability of electrical appliances to consume
electricity. Commercial resources that contribute
towards the consumption of the industry offering are
categorized as the
RS_CM_Consumption class while
the ones that contribute towards the reception of the
KEOD 2010 - International Conference on Knowledge Engineering and Ontology Development
74
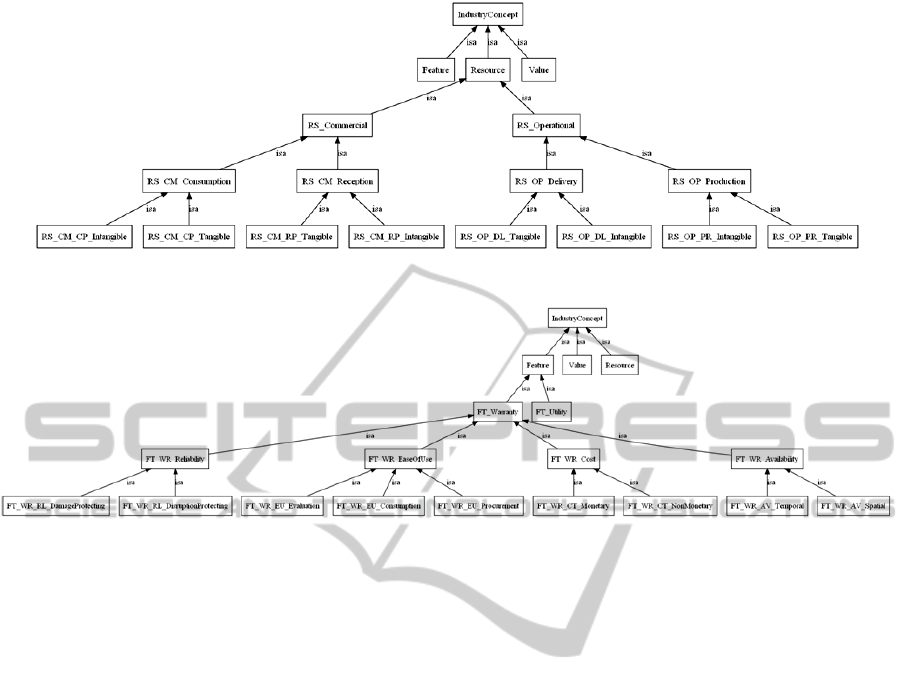
Figure 5: Taxonomy of the Resource class.
Figure 6: Taxonomy of the Feature class.
industry offering are categorized as the
RS_CM_Reception
class. Finally, based on their
cognitive orientation a resource can be further
classified as tangible and intangible. The leaf nodes
of the taxonomy presented in Figure 6 refine the
higher level
RS_CM_*
and
RS_OP_*
classes as
RS_*_*_Tangible
and
RS_*_*_Intangible
subclasses.
Figure 6 presents the taxonomy of the
Feature
class. The
Feature
class is a manifestation of the
design pattern D1. As argued in (Ramsay, 2005), we
do not treat value as an intrinsic characteristic of a
product or service, and hence do not subscribe to the
value chain metaphor (Porter, 1985) which is often
interpreted to suggest that a value can be moved
from the supplier to the adopter. The notion of
supplier and adopter in D1 is to highlight the role of
VNs in supplying resources that lead to the
realization of some value at the adopter VN.
Nevertheless, connecting resources directly to value
will bypass an intermediate composition level where
resources from different enterprises within a VN
come together to define artifacts with some potential
value content. This concept of composition is
concretized in the
Feature
class. Features can,
thus, be viewed as the potential value of a
combination of one or more resources of a supplier
VN. This potential value gets transformed into
realized value when the adopter VN consumes the
underlying artifact i.e. the industry offering. Thus
feature and value differ only in the context of the
observer. Feature expresses the view of the supplier
of his product or service and value is the view of the
adopter of the consumed product or service. This
difference is captured as property constraints and is
further detailed in Section 4.3.
From a taxonomy point of view, interpretation of
features as potential value results in similar
refinements of the
Feature
and
Value
classes. The
taxonomy of the
Feature
class is presented in
Figure 6. We posit that the
Value
class has a similar
taxonomy tree hence do not present it separately.
The following discussion on the specificities of
feature refinement applies equally to the value
concept.
The
Feature
class has two subclasses:
FT_Utility
and
FT_Warranty
. Utility and
warranty are two concepts publicized as part of the
Information Technology Infrastructure
Library (ITIL) (OGC, 2007), developed by the
UK's Office of Government Commerce (OGC)
for Information Technology Services Management.
Utility captures the functionality offered by a
product or service and is informally interpreted as
‘what the industry offering does’. On the other hand,
warranty is the promise that a product or service will
meet its’ agreed requirements, informally interpreted
as ‘how the industry offering is done’. In the
PANHAA SYSTEMIC DESIGN OF REGULATION ENABLING ONTOLOGY
75
Requirements Engineering field, these are often
termed as the function and non-functional
requirements (Gause & Weinberg, 1989).
The utility of a service or good is usually well
understood. It is the warranty aspect that is open to
interpretation and is hence further refined. A
warranty can be related to the availability, reliability,
ease of use and cost of the service or good. The
FT_WR_Availability
class represents the
attributes that capture the readiness of the service or
good to be consumed by the adopter. The readiness
can be both temporal
, FT_WR_AV_Temporal
class,
and spatial,
FT_WR_AV_Spatial
class. The
presence of electricity supply at the time and place
of consumption will constitute the temporal and
spatial availability of the service provided by the
ECN. The objects of the
FT_WR_Reliability
class represent the appropriateness of the service or
good for consumption. Appropriateness can be
achieved by ensuring safeguards against disruptive
failures, the
FT_WR_RL_DisruptionProtecting
class, and damaging failures, the
FT_WR_RL_DamageProtecting
class. For
instance, the use of surge protector equipment can
protect against slight variations in electricity supply
but a line breaker would be required to stop the
supply in the event of very high variations in supply.
The
FT_WR_EaseOfUse
class represents the (in)
convenience of evaluating –
FT_WR_EU_Evaluation
, procuring -
FT_WR_EU_Procurement
, and consuming -
FT_WR_EU_Consumption
, a product or service.
The
FT_WR_Cost
class captures the attributes that
define the cost of the service or good. The cost can
be interpreted both in monetary,
FT_WR_CT_Monetary
, and in non-monetary terms,
FT_WR_CT_NonMonetary
.
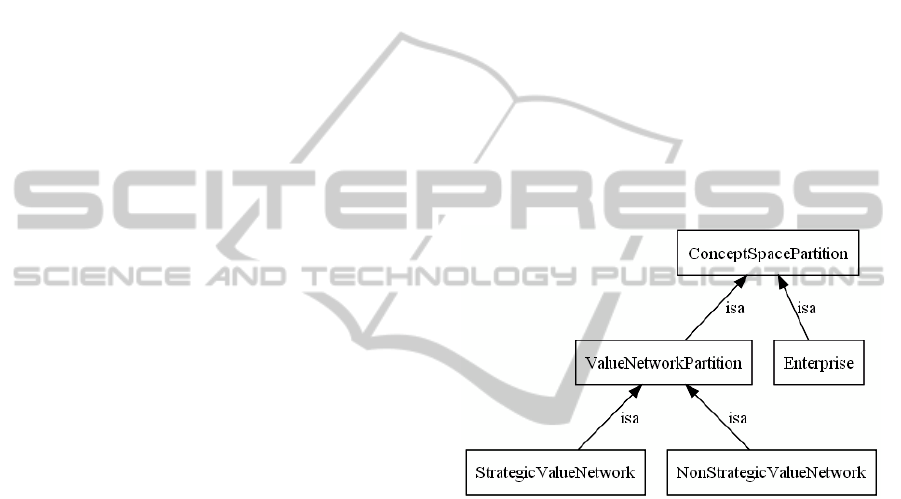
4.2 The ConceptSpacePartition Class
The taxonomy of the
ConceptSpacePartition
class is presented in Figure 7. As the name suggests,
this class creates a partition on the set of concepts
represented in the
IndustryConcept
Class. A
partition imposes a certain view of the industry. The
Enterprise
subclass partitions the various
concepts in an Industry along the well established
boundaries of legal ownership and undertaking. For
instance every resource in an industry is owned by
some enterprise.
Enterprise
subclass is the default
partition of the objects represented by
IndustryConcept
class.
The
ValueNetworkPartition
subclass is a
manifestation of the Value Network concept in
SEAM. It relies on the default
Enterprise
class
imposed partition on industry concepts. More
specifically, the
ValueNetworkPartition
subclass partitions the various concepts in an
industry along the common intent of the enterprises
where these concepts originate. It is important to
note that the absence of an explicit intent is also a
commonality and, hence, can form a valid partition
of the Industry concepts. As a result, the
ValueNetworkPartition
class is further sub-
divided into
VNP_Strategic
and
VNP_NonStrategic.
The strategic subclass refers
to a partition that is based on some maximizing
something – profit, welfare, power, etc. By contrast,
the non-strategic subclass is blind and has no
objective, no preferences, and no foresight, for
instance the Environment (Birchler & Bütler, 2007).
Figure 7: The Taxonomy for ConceptSpacePartition Class.
4.3 Property Constraints
The properties that bind the different concepts in
REGENT are depicted in Figure 8. Properties in
OWL are binary relations constraining the
interaction between any two classes. For any
property connecting an object o1 to object o2 an
inverse property can also be specified which
connects object o2 with o1. In the following, we
discuss these properties on a class by class basis. For
the sake of clarity, words starting with upper case
alphabet are class names and the same when written
in lowercase represent objects of that class.
The objects in the Resource class are constrained
through two properties. 1) The hasOwner property
mandates that each resource is connected to some
enterprise. To ensure the uniqueness of this relation
we limit the property to have a single value i.e. each
resource has only one owner. In OWL this is
accomplished by setting the property characteristics
KEOD 2010 - International Conference on Knowledge Engineering and Ontology Development
76
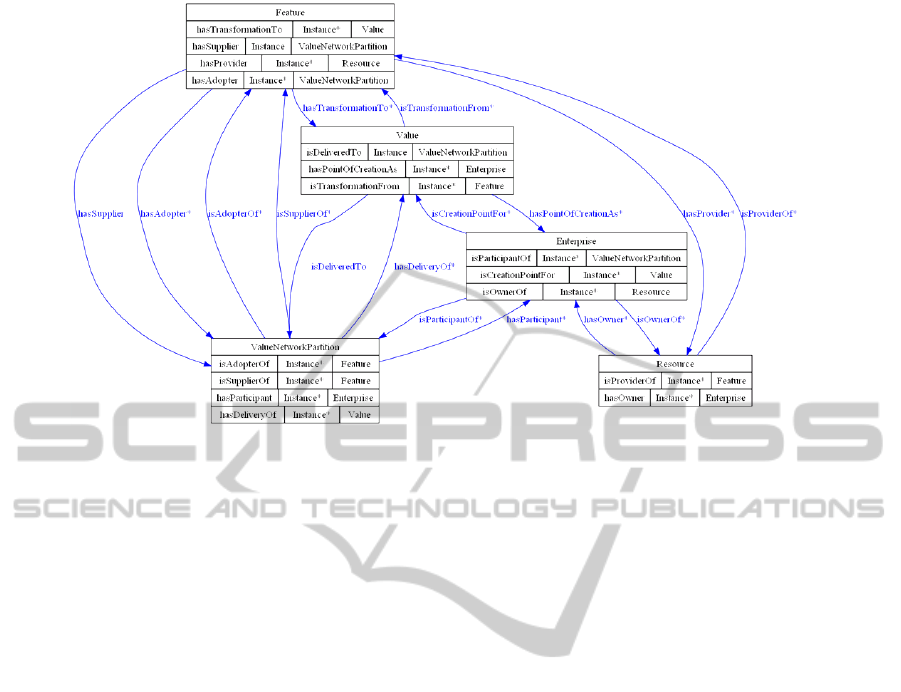
Figure 8: A visual representation of properties constraining REGENT concepts.
as functional. The corresponding inverse property
that connects an enterprise to its resources is the
isOwnerOf property. The one-to-many nature of this
relation is visually represented with an asterisk (*).
An enterprise can own more than one resource. 2)
The isProviderOf property links a resource to the
feature it contributes. The corresponding inverse
property that connects a feature to its constituent
resources is the hasProvider property. Both of these
properties represent a one-to-many relation – a
resource can enable more than one feature and a
feature can be enabled by more than one resource.
The objects in the Feature class are constrained
through four properties. 1) The
hasTransformationTo relation specifies the values
that are realization of the features. The
corresponding inverse property
isTransformationFrom specifies the features that
constitute the value. Both of these relations exhibit
multiplicity – multiple features can aid a value
creation and multiple values can be enabled by a
feature. 2) The hasSupplier relation specifies the
supplier value network for a feature. This is a single
value relation which restricts each feature to have a
unique supplier. The same is imposed by setting the
functional characteristic of this property. The
corresponding inverse property, isSupplierOf, is a
multi-valued relation. A value network can be a
supplier of more than one feature. 3) The
hasProvider relation is already discussed above. 4)
The hasAdopter relation specifies the adopter value
network for a feature. The corresponding inverse
property, isAdopterOf, specifies the set of features
that a value network adopts. Both of these are multi-
valued properties – a value network can adopt
multiple features and a feature can be adopted by
multiple VNs.
The objects in the
Value
class are constrained
through three properties. 1) The isDeliveredTo
property specifies the value network where a value
is realized. This is a single value property; a value is
closely associated to the perception of the consumer
and, is hence, unique to the value network. We do
this by setting the functional characteristic of the
property. The corresponding inverse property,
hasDeliveryO, specifies the value that a value
network consumes. 2) The hasPointOfCreationAs
property specifies the precise enterprise which
consumes this value. Again, consumption is unique
to an enterprise; hence, this property is a single-
valued function. The corresponding inverse
property, isCreationPointFor, identifies all the
values that are consumed by an enterprise. This is a
multi-valued property. 3) The
isTransformationFrom property has been detailed
earlier.
In addition to the properties exhibited by the
Feature, Resource and Value class. There exists an
additional relation between the objects of the
Enterprise class and the objects of the
ValueNetworkPartition class. The property
isParticipantOf identifies the value network to
which the enterprise participates. To highlight the
fact that an enterprise when part of two value
networks does so in different roles, we model this
relation as a single-value property – setting its
PANHAA SYSTEMIC DESIGN OF REGULATION ENABLING ONTOLOGY
77

functional characteristic. The corresponding inverse
property, hasParticipant, is a multi-valued property
and identifies all the enterprises that are members of
a VN.
5 THE CASE OF URBAN
RESIDENTIAL ELECTRICITY
SUPPLY
In this section, we use REGENT to provide a
systematic view of the Urban Residential Electricity
Supply Industry (URESI). Details about the URESI
were gathered from various reports (US Aid, 2007)
(Malaman, April, 2001), best practices (OECD,
1997), guidelines (Queensland Competition
Authority, 2001), national regulations (GOI, 2002)
and personal communication with Industry
representatives. The later was done through a
consultation meeting, ‘The Role of IT in Regulatory
Governance’, held on December 05, 2009 at TATA
Consultancy Services Ltd., Lucknow India.
We begin by identifying the different
stakeholders in a URESI. Stakeholders with
common objectives, or lack of objective, are
grouped into same Value Network. Four VNs
emerge from this exercise: The Economic Value
Network (ECN) that represents enterprises with
primarily economic motivation, Social Value
Network (SCN) that represents enterprises with
primarily social motivation, Environmental Value
Network (EVN) that represents non strategic
enterprises and Government Value Network (GVN)
that represents the collective welfare as the
overriding motivation. The enterprises constituting
the ECN are Generation Company, Transmission
Company and the Distribution Company. The
enterprise constituting the SCN is the Urban
Household. The enterprises constituting the ENV are
Climate and Habitat. Climate represents the macro
level aspects of the environment while habitat
represents the micro level aspects of our immediate
surroundings. ECN and SCN are generalizations of
the Electricity Supplier Value Network and the
Electricity Consumer Value Network mentioned in
the Sections 2 and 4.
5.1 Resource Identification
For each of these VN, we take a commercial and
operational view of the value exchange and identify
the tangible/intangible resources that aid the
production/delivery of the VN offering and the
reception/consumption of the counter offering from
other VNs. These resources along with the related
Enterprise and Value Network are listed in Table 1.
In the case of ECN, the Generation Company
provides fuel specific generation plants (r73-83) as
tangible resources for the production process. The
Distribution and Transmission Companies provide
the necessary network, both large area and local
area, to transport the generated electricity to the
prospective place of consumption. The elements of
these networks (r51-63) represent the tangible,
delivery related operational resources in ECN. To
enable the return path, the Distribution Company
makes available different Billing plans (r27-31),
Collection modes (r32-35), Communication
channels (r38-40) and Maintenance Equipments
(r36, 37) as tangible resources for receiving the
revenue and information (feedback) flow. The
accompanying intangible resources for this purpose
include billing, repair and support related
capabilities (r21-25). The information resulting from
this feedback is consumed by Generation Companies
in fine tuning their generation strategies, for instance
operate the generation units in the increasing order
of marginal production cost or in the increasing
order of marginal emission (r1, 2).
In the case of EVN, the Habitat provides the
different kind of fuels such as Gas, Coal, Nuclear,
etc. (r88-96), as tangible resources for the
production process. On the delivery front, EVN
provides an intangible resource in the form of ease
of procurement of natural resources. It is the
procurement feasibility (r47) that allows a natural
resource to be available as a fuel in the electricity
production process. To enable the return path, the
Climate makes available air, land and water (r41-43)
as tangible resources for receiving the pollution that
results from the electricity production process. The
pollution is finally consumed as a displeasing benefit
through the five human senses (r3-7), which act as
the intangible consumption resource.
In the case of GVN, policy making exploits the
following four resources available with any
government institution: information (Nodal), power
(Authority), money (Treasure) and management
(Organization). The NATO concept was introduced
by (Hood & Margetts, 2007) and has since been
widely used to study the working of governments.
The information, power and management (r68-70)
represent intangible and money (r97) represents
tangible, operational resources for producing high
level policies.
KEOD 2010 - International Conference on Knowledge Engineering and Ontology Development
78
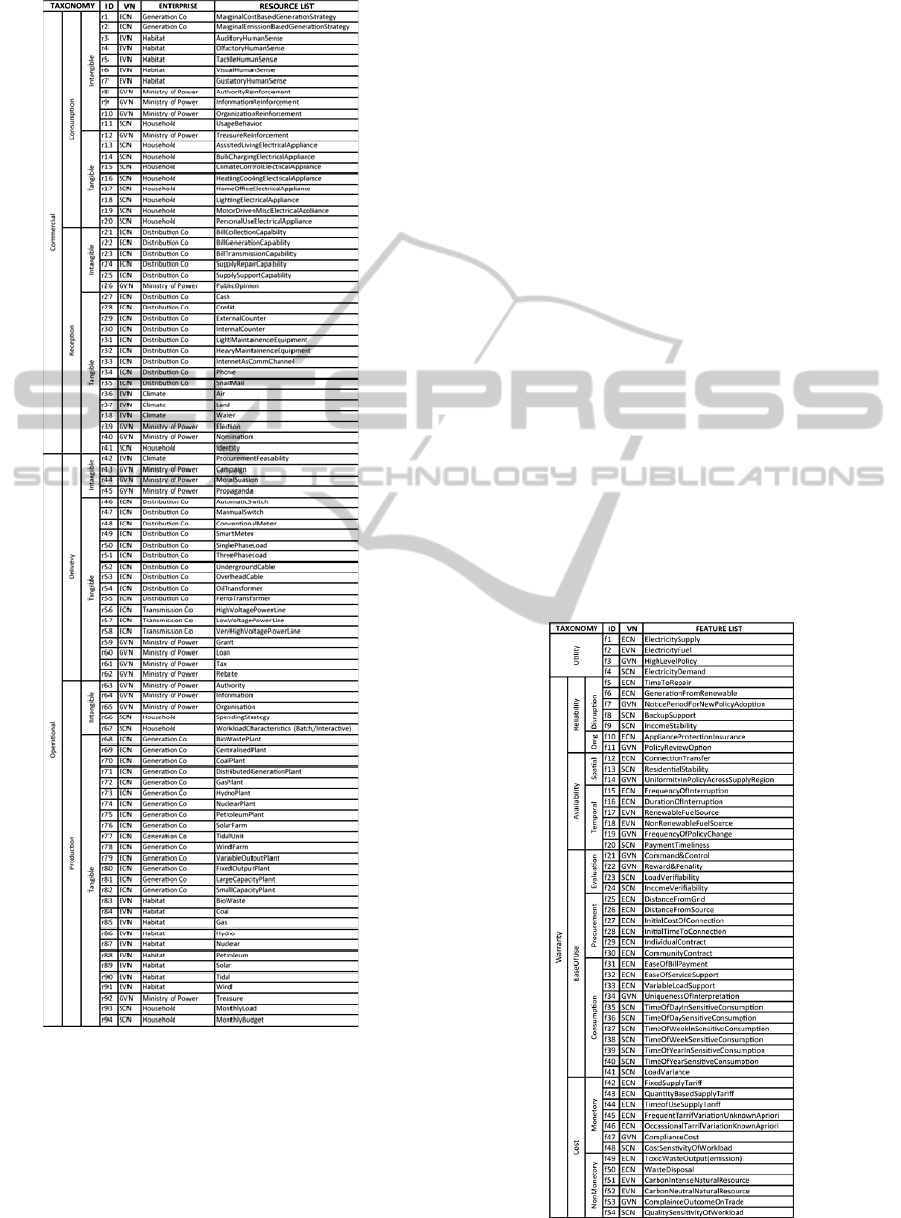
Table 1: List of Resource identified in URESI.
To deliver its policies the government uses various
social and economic instruments (r48-50, 64-67). It
receives the benefits of policy making through
election, nominations and public opinion formation
(r26, 44, 45). Any political capital thus accrued is
encashed by reinforcing (r8-10, 12) it resources for
further policy making.
In the case of SCN, the demand for electricity at an
Urban Household is a combination of its load
requirements and the willingness/capability to pay.
The tangible resources that produce this demand
include the household monthly budget and monthly
load (r98, 99). The corresponding intangible
resources include the spending strategy and the
consumption characteristic (r71, 72). In an urban
setting, there are no extra resources required to make
this demand visible to the ECN, as a result there are
no delivery related resources listed for SCN.
Nevertheless, this is not always the case. In a rural
setting, the economic prospects of serving an
isolated demand may not be too attractive. Very
often, in these situations, the GVN lends its
resources to deliver such demands, aka Universal
Service Obligation. On the commercial front, the
SCN obtains a connection using its identity as the
resource to guarantee the intent of upholding the
terms and conditions. The household identity (r46) is
thus the tangible, reception oriented commercial
resource of SCN. Finally, the different kind of
electrical appliances (r13-20) in the household and
the usage behaviour (r11) of household members act
as the tangible and the intangible resources required
to consume electricity.
Table 2: List of Feature identified in URESI.
PANHAA SYSTEMIC DESIGN OF REGULATION ENABLING ONTOLOGY
79

5.2 Feature Identification
Every VN in an industry contributes some service or
good to other VNs in the industry. As described in
Section 2.4.1, a VN offering can be detailed along
the utility and warranty dimensions. Table 2 lists the
utility and warranty details of the VN offerings in
the Urban Residential Electricity Industry.
The utility of ECN is to provide electricity (f1)
for residential purposes. For the electricity supply to
be useful, it provides a set of warranties related to
temporal (f15, 16) and spatial availability (f12),
dollar (f42-46) and non-dollar cost (f49, 50), ease of
use (f25-33) and reliability (f5, 6, 10).
The utility of ENV offering is to provide natural-
resources (f2) required for electricity generation.
These natural-resources can either be provided in
perpetuity (f17) or only for a limited period of time
(f18), with little (f52) or significant (f51) ecological
impact, thereby constituting the warranty of the
ENV offering.
The utility of SCN is to exhibit demand (f4) for
electricity. Demand includes both the expected load
and the willingness/ability to pay. The temporal
sensitivity of consumption (f35-40, 48), the
specificities of the expected electrical load (f23, 41),
tolerance to qualitative variance (f54) and the
payment guarantees (f9, 13, 20, 24) are the
warranties that detail the utility offered by the SCN
to other VNs in the industry.
The utility of GVN is to provide the high level
policy (f3) framework that guides the industry in the
desired direction. These policies can be evaluated
for their suitability of implementation - command &
control (f21) or reward & penalty (f22). A simplified
(f34), sensitive (f7, 11), stable (f19) and uniform
policy regime (f14) limits the industries’ cost of
compliance (f47) and results in the industry growth
(f53).
5.3 Value Identification
Every VN in an industry receives some value in
return to his contribution to the Industry. Value can
either be positive or negative, solicited in the case of
strategic VNs or unsolicited in the case of non-
strategic players. Table 3 lists the utility and
warranty of the different value created in the Urban
Residential Electricity Supply Industry, the VNs that
adopt these value and the enterprises in the adopter
VN where these value are realized.
The utility of the positive value realized at the ECN
is profit (v1-3). To accomplish this, the Distribution
Company tries to forecast demand (v8), inform
policy makers about its requirements (v12), exploit
the need of consumers for electricity (v18) and
ensure continued flow of revenue (v19). On the
transmission front, the spatial diversity of demand
(v14) creates more business opportunities for the
Transmission Company. Continued availability of
fuel (v17) for electricity generation is the primary
warranty for a Generation Company. All the ECN
enterprises bear the transaction cost (v29-31) of
doing business under some policy regime.
The utility of the negative value realized at the EVN
is pollution (v4, 5). At the micro level the pollution
can lead to a variety of displeasures (v34-38) to the
inhabitants of a certain geographical area. At the
macro level pollution can manifest itself as
undesired alterations to climate (v39-41).
The utility of the positive value realized at the
SCN is the comfortable living (v7) of household
members. The household convenience is maximised
by ensuring safe & continued operation of electrical
appliances (v13, 21) and giving the household
complete freedom of the financial (v33) and social
aspect (v16, 23) of electricity supply. Simplifying
the interactions between the household and the
service provider (v28) also brings added comfort to
the household. In certain situations, specificities of
the supply network may impose restrictions on the
use of some types of appliances (v10), for instance
heavy load motors on single phase connections.
The utility of the positive value realized at the
GVN is to ensure collective welfare of the society by
accumulating political capital (v6). Achieving
independence in electricity supply (v9) through
increased investments (v15, 20, 26), making
electricity available for every one (v24), ensuring
minimum quality standard of supply (v27) at a fair
price (v32) are important warranties of electricity
supply that affect the consumers at large.
KEOD 2010 - International Conference on Knowledge Engineering and Ontology Development
80
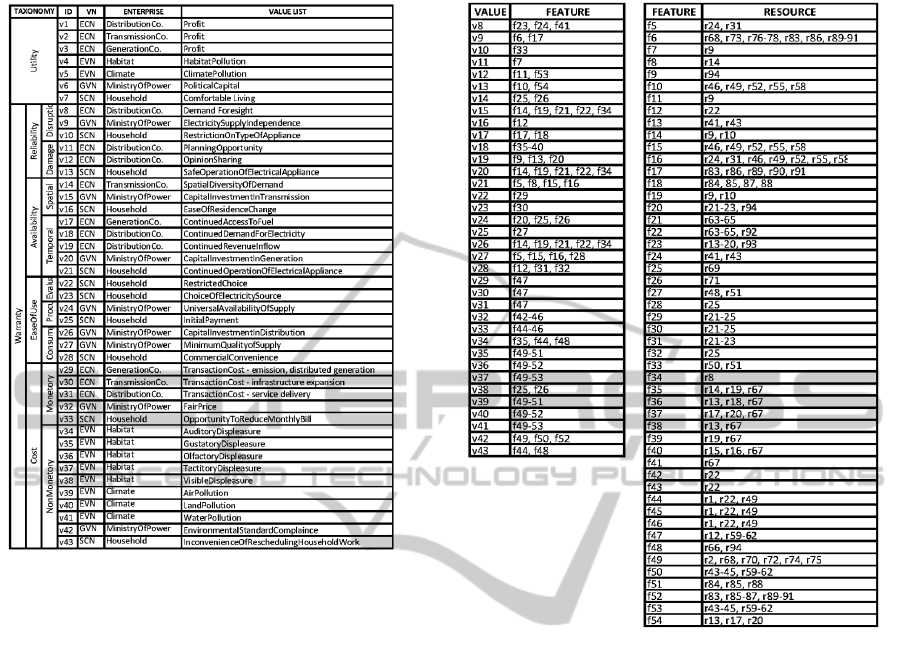
Table 3: List of Value identified in URESI.
5.4 Establishing Regulatory Oversight
Table 4 presents the mapping between the different
members of the Resource, Feature and Value set.
This mapping exploits the property constraints
detailed in 2.4.4. In the interest of space, here we
only elaborate the realization of auditory displeasure
(v34) as a negative value created at the Habitat by
the introduction of time based pricing scheme in the
electricity supply industry.
Balancing the supply and demand for electricity
is central to the proper functioning of an electricity
grid. The demand, however, tends to exhibit time
sensitivities with more electricity required during
specific times of the day or year, for example
increased lighting requirements during the night and
higher climate control needs during peak
winter/summer season. In the absence of efficient
large scale electricity storage techniques such
variability in demand can only be met through
flexible generation capabilities. Not all generation
units support variable output. For example, nuclear
power plants must be run at close to-full capacity at
all times whereas production from other sources
such as wind and solar, though inherently variable in
nature, remains hard to predict.
Table 4: Resource-Feature-Value mapping in URESI.
Further, the cost of electricity production varies
from one type of generation unit to another.
Generation Company operates these units in an
increasing order of marginal costs (r1). Thus
increased generation required to meet higher
demands (peak hours) results in a higher per-unit
cost of electricity. Similarly, during periods of low
demand (off-peak hours) generation units with high
marginal costs are cycled down resulting in a lower
per-unit cost of electricity. Installation of smart
meters (r49) allows the Distribution Co. to extend its
billing capability (r22) and help the ECN introduce
time of use (ToU) electricity pricing tariffs (f44).
ToU presents economic incentives to enterprises in
ECN and SCN alike. Electricity suppliers can
increase profits by charging a higher per-unit cost
during peak hours and consumers can minimize their
bill (f48) by moving their time insensitive workloads
(f35) to off-peak hours when the per-unit cost is low.
The sensitivity of households to electricity bill is a
function of their monthly budget (r94) and spending
strategy (r66). Any attempt by households to move
electricity workloads to off-peak hours is limited to
the rescheduling of time insensitive workloads (f35)
which in turn depends on the availability of requisite
PANHAA SYSTEMIC DESIGN OF REGULATION ENABLING ONTOLOGY
81
electrical appliances (r14, 19) and batch oriented
workload characteristics (r67).
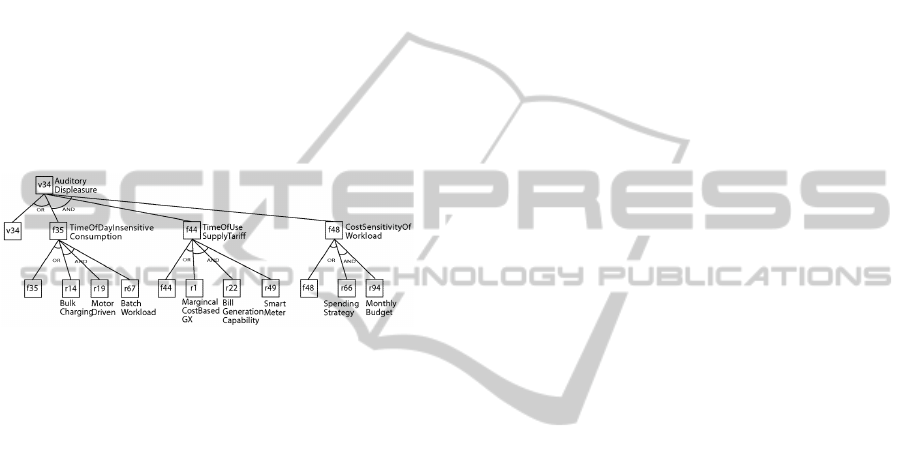
The temptation to move workloads to hours of
low overall activity, e.g. night time, may result in
increased noise levels during odd hours leading to
the realization of a negative value of auditory
displeasure (v34) to surrounding neighborhoods, the
habitat. Use of REGENT to formally represent the
value realization process exposes the industry
concepts that enable it and the relationship these
concepts have with the real world. Industry
regulators can use this knowledge, for instance, to
clearly identify the different industry elements that
need to be monitored so as to track the realization of
a given value of interest. An AND/OR graph
depicting the value realization process for auditory
displeasure (v34) is depicted in Figure 9.
Figure 9: Monitoring auditory displeasure.
6 RELATED WORK
The role of ontology in formalizing the concepts in a
knowledge system is well established. In the context
of industry, ontology development has primarily
focused on formalizing the domain specificities. The
concepts and relationships that occur between
entities from different domains have not attracted
much ontological attention. E3 value (Gordijn &
Akkermans, 2003) is one of the few attempts to
study the value exchange between the stakeholders
in an industry. It is, however, restricted to analyzing
the economic exchange between companies active in
an e-commerce business. Some ontology
development has also been recently noticed in
understanding regulation, for example IPROnto
(Delgado, Gallego, Llorente, & García, 2003) which
presents a formalization of the concepts in digital
rights management. In the Electricity industry power
quality measurement related ontology has been
presented in PQONT (Küçük, Salor, Inan, Çadırcı,
& Ermis, 2010).
7 CONCLUSIONS
REGENT enables an explicit specification of multi-
party relationships in an industry by formalizing the
concepts that influence the realization of stakeholder
value. A systematic representation of industry
knowledge will expose any deficiencies in
regulators’ understanding of the industry, thereby
assisting the regulator in developing a holistic view
of the industry. REGENT is an important first step
in our larger effort of developing a knowledge
system for the regulation of utilities.
REFERENCES
Alexander, C. (1979). The Timeless Way of Building. New
York: Oxford University Press.
Baader, F., Calvanese, D., McGuinness, D. L., Nardi, D.,
& Patel-Schneider, P. F. (2003). The Description
Logic Handbook: Theory, Implementation,
Applications. Cambridge, UK: Cambridge University
Press.
Baldwin, R., & Cave, M. (1999). Understanding
Regulation: Theory, Strategy and Practice. Oxford,
UK: Oxford University Press.
Barney, J. B. (1991). Firm Resources and Sustained
Competitive Advantage. Journal of Management , 99-
120.
Beer, S. (1985). Diagnosing the System for Organizations.
London: John Wiley.
Birchler, U., & Bütler, M. (2007). Information Economics.
London: Routledge.
Clark & Parsia. (2010, May 3). Pellet: OWL 2 Reasoner
for Java. Retrieved May 20, 2010, from Clark&Parsia:
http://clarkparsia.com/pellet
Delgado, J., Gallego, I., Llorente, S., & García, R. (2003).
Workshop on Regulatory Ontologies and the
Modelling of Complaint Regulations. On The Move to
Meaningful Internet Systems 2003: OTM
2003Workshops (pp. 621-634). Catania, Sicily, Italy:
Springer LNCS.
Gamma, E., Helm, R., Johnson, R., Vlissides, & John.
(1995). Design Patterns: Elements of Reusable
Object-Oriented Software. Holland: Addison-Wesley.
Gause, D., & Weinberg, G. (1989). Exploring
Requirements: Quality Before Design. New York:
Dorset House Publishing.
GOI. (2002). Annual Report on The Working of State
Electricity Boards & Electricity Departments. New
Delhi: Planning Commission (Power & Energy
Division), Government of India.
Gordijn, J., & Akkermans, J. (2003). Value-based
requirements engineering: exploring innovative e-
commerce ideas. Requirement Engineering Journal,
Springer, Heidelberg , 114-134.
Gruber, T. (1993). Toward Principles for the Design of
Ontologies Used for Knowledge Sharing .
KEOD 2010 - International Conference on Knowledge Engineering and Ontology Development
82

International Journal Human-Computer Studies , 907-
928.
Hood, C., & Margetts, H. (2007). The Tools of
Government in the Digital Age. London: Palgrave
Macmillan.
Küçük, D., Salor, O., Inan, T., Çadırcı, I., & Ermis, M.
(2010). PQONT: A domain ontology for electrical
power quality. Advanced Engineering Informatics ,
84-95.
Malaman, R. (April, 2001). Quality of Electricity Supply :
Initial Benchmarking on Actual Levels, Standards and
Regulatory Strategies. Milano: Working Group on
Quality of Electricity Supply, Council of European
Energy Regulators.
OECD. (1997). Regulatory Impact Analysis: Best Practice
in OECD Countries. Paris: OECD.
OGC. (2007). ITIL, Version 3. London: The Stationery
Office, Office of Government Commerce.
Porter, M. E. (1985). Competitive Advantage: Creating
and Sustaining Superior Performance. New York:
Free Press.
Queensland Competition Authority. (2001). Electricity
Distribution: Service Quality Guidelines. Australia:
Queensland Competition Authority.
Ramsay, J. (2005). The Real Meaning of Value in Trading
Relationships. International Journal of Operations &
Production Management , 549-565.
Shy, O. (2004). The Economics of Network Industries.
Cambridge: Cambridge University Press.
Smith, A. (1904). Wealth of Nations. London, UK:
Methuen.
Stanford Center for Biomedical Informatics Research.
(2010, March 8). Ontology Editor and Knowledge
Acquisition System. Retrieved May 20, 2010, from
Protege: http://protege.stanford.edu/
US Aid. (2007). Measuring the Quality of Electricity
Supply in India. India: US Aid.
W3C. (2004, February 10). OWL Web Ontology
Language. Retrieved May 20, 2010, from World Wide
Web Consortium: http://www.w3.org/TR/owl-guide/
Wegmann, A., Julia, P., Regev, G., & Rychkova, I.
(2007). Early Requirements and Business-IT
Alignment with SEAM for Business. 14th IEEE
International Requirements Engineering Conference
(pp. 111-114). Delhi, India: IEEE.
Weinberg, G. (1975). An Introduction to General System
Thinking. New Jersey: Wiley & Sons.
Zaccour, G. &. (1998). Deregulation of electric utilities.
Boston, Massachusetts: Kluwer Academic.
PANHAA SYSTEMIC DESIGN OF REGULATION ENABLING ONTOLOGY
83
