
UNDERSTANDING MEDICINE 2.0
Social Network Analysis and the VECoN System
Sam Stewart and Syed Sibte Raza Abidi
NICHE Research Group, Dalhousie University, 6050 University Ave., Halifax, NS, Canada
Keywords:
Web 2.0, Social network analysis, Data visualization, Knowledge translation.
Abstract:
Web 2.0 provides new and valuable tools to the world of medicine, and Social Network Analysis (SNA)
can provide insight into how these communication networks function. This paper explores the potential for
SNA methods to explain the communication patterns in the Pediatric Pain Mailing List, including identifying
content experts and isolating potential subgroups of interest. These results are incorporated into VECoN, a
novel network visualization designed to improve the standard network exploration process by presenting the
network graphically and incorporating SNA statistics into the presentation.
1 INTRODUCTION
Experiential healthcare knowledge manifests in a va-
riety of modalities: clinical case studies, problem-
based discussions between clinicians, experience-
based insights, diagnostic heuristics et cetera. This
knowledge accounts for the intrinsic experiential
know-how, insights, judgements and problem-solving
strategies of healthcare practitioners. Such knowl-
edge is not ‘published’ as evidence-based, yet it
holds vital insights into solving atypical clinical prob-
lems. The key issues related to experiential healthcare
knowledge are: (a) how to formulate a community
of healthcare practitioners; (b) how to explicate and
share their experiential healthcare knowledge; and (c)
how to put value on experiential healthcare knowl-
edge, especially for clinical decision making, since it
is not systematically evaluated in the same manner as
evidence-based studies.
In the realm of Web 2.0, the emergence of
Medicine/Health 2.0 presents ‘virtual’ community-
driven environments to create and share healthcare
knowledge. The key idea is that the community cre-
ates and validates experiential knowledge in an or-
ganic manner, and applies it to provide feedback to
its effectiveness. Web 2.0 based knowledge sharing
mediums include online discussion forums, email-
based mailing lists, web blogs, et cetera. Through
these mediums, healthcare practitioners are able to
articulate and share clinical, operational and even
psycho-social experiences, along with insights and
know-how about particular healthcare topics. The ef-
ficacy of this approach is that healthcare practitioners,
originating from different backgrounds and expertise
levels, can engage, collaborate and share their experi-
ential knowledge for the benefit of the entire commu-
nity.
Given the virtual nature of the community it is
of interest to get insights about the knowledge shar-
ing dynamics (active participants, key contributors
of knowledge, topics of interest, influential mem-
bers, et cetera) of the virtual community, as it helps
to put a value on the knowledge created and shared
there. We argue that a study of the community’s
communication patterns and of the knowledge con-
tent being shared can provide insights into experi-
ential knowledge sharing dynamics of a specialized
healthcare practitioner community. Social Network
Analysis (SNA) allows us to analyze the communi-
cation networks within a socially-connected commu-
nity (such as an online healthcare practitioner com-
munity) and highlight the key actors, interest groups,
sub-networks, content seekers and experts, collabora-
tion opportunities, communication barriers, and other
network attributes. SNA focuses on analyzing the at-
tributes that arise out of the structural properties of a
social network, rather than the properties of the actors
themselves, providing an overview of the community
and how people communicate within it.
In order to make the results of the SNA useful
to the PPML community at large, a visualization tool
has been developed to allow the members to visually
navigate the network and explore both the conversa-
tions on the mailing list and the social connections
70
Stewart S. and Sibte Raza Abidi S..
UNDERSTANDING MEDICINE 2.0 - Social Network Analysis and the VECoN System.
DOI: 10.5220/0003167100700079
In Proceedings of the International Conference on Health Informatics (HEALTHINF-2011), pages 70-79
ISBN: 978-989-8425-34-8
Copyright
c
2011 SCITEPRESS (Science and Technology Publications, Lda.)
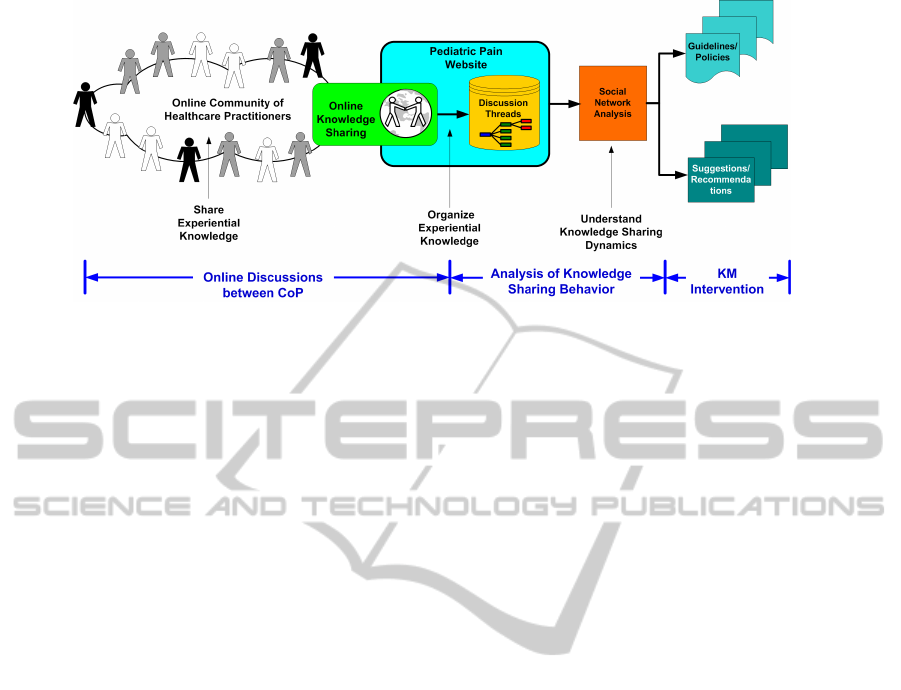
Figure 1: Depiction of the experiential knowledge sharing framework and how SNA can leverage the knowledge sharing to
inform knowledge creation.
that have arisen out of it. VECoN (Visual Exploration
of Communication Networks) is a tool that provides
the means to visualize the social aspects of the net-
work, along with functions to navigate to individual
threads on the mailing list. A beta release of VECoN
has been produced as a proof of concept of how we
can provide further insights into the different uses of
Web 2.0 technologies in healthcare.
2 EXPERIENTIAL HEALTHCARE
KNOWLEDGE SHARING
FRAMEWORK
From a health knowledge management perspective,
an online mailing list or discussion forum provides a
collaborative learning environment in which domain
experts can disseminate their wealth of knowledge
and experience, and junior health practitioners can
learn by leveraging the explicated experiential knowl-
edge. This brings into relief an experiential knowl-
edge sharing framework (Figure 1) that allows a com-
munity of healthcare practitioners to interact and col-
laborate to create and share experiential knowledge,
while organizing the knowledge in terms of domain
specific topics. Each topic is pursed by a group of
practitioners who interact through online tools, such
as email or discussion forums. The discussion around
a topic can be organized in terms of a ‘discussion
thread’: a series of emails/posts by healthcare practi-
tioners around a specific topic. Using this framework
analysis of emergent social networks within the com-
munity can be performed (where the social network
depicts the collaboration/communication dynamics of
the community) and analysis of the content of the dis-
cussions can be done through the use of intelligent
text analytics and text/knowledge creation methods.
It is anticipated that subsequent SNA of the knowl-
edge sharing behaviour of the virtual community will
provide useful insights into the patterns of knowl-
edge flow amongst healthcare practitioners. The re-
sultant social network will provide an objective mea-
sure of the effectiveness of the online knowledge shar-
ing medium to support collaborative learning.
The objective of the SNA is to provide meaning-
ful insight into the flow of communication within the
network. This will be provided at both the micro and
macro level. Centrality measures provide insight into
the roles individuals play within the network, and will
help identify content experts, those members that are
actively communicating with their peers and facilitat-
ing knowledge transfer. Clique and structural equiv-
alence analysis is performed at the macro level, iden-
tifying subgroups of actors that are tightly connected.
The presence of subgroups may represent particular
sub-topics of interest, or groups of clinicians that are
not fully communicating with the rest of the network.
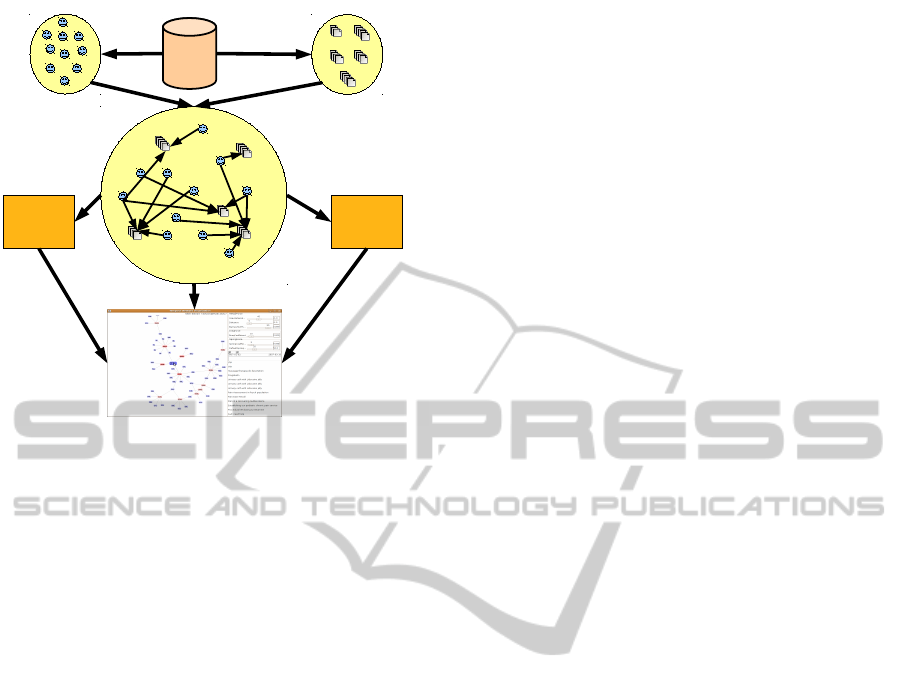
The social network analysis and visualization
framework is outlined in Figure 2. The following sec-
tions will outlined the process in detail.
3 BACKGROUND
3.1 Social Network Analysis
Social Network Analysis (SNA) is the analysis of
the relations between actors, i.e. understanding the
underlying social structure of a community of prac-
tice. SNA utilizes the principles of graph theory from
the world of mathematics to represent communication
networks in terms of actors (nodes) and ties between
actors (edges) (Wasserman and Faust, 1994) (Hanne-
man and Riddle., 2005). Traditional statistical anal-
UNDERSTANDING MEDICINE 2.0 - Social Network Analysis and the VECoN System
71
PPML
Archives
ThreadsActors
Social
Network
Group
Level
SNA
Information
User
Level
SNA
Information
Social
Network
Visualization
(VECoN)
Figure 2: SNA and visualization process. The network in-
formation is extracted from the PPML database, where it
is processed to produce the network. The network is used
to general social networking information, which is incorpo-
rated with the network to produce the VECoN system.
ysis focuses on actors as independent units, and ana-
lyzes them in terms of their personal attributes. SNA
instead focuses on the structures that emerge out of
the relations between actors, and not on the actors
themselves.
One aspect of SNA that is important to this project
is the difference between one and 2 mode networks.
In one-mode networks the nodes in the network are
homogeneous, i.e., they all belong to the same class.
This is the traditional network layout, in which nodes
represent people and ties represent some sort of so-
cial construct that connects them: friendship, advice,
work, et cetera. Two-mode networks contain two dif-
ferent classes of network, and ties exist only from one
mode to another. These most commonly occur when
one set of nodes represents people, and the second set
represents events, and ties go strictly from one mode
to another (indicating that a person has attended an
event). A two-mode network that represents people
and the events they attend is sometimes called an affil-
iation network, and is the structure of the VECoN sys-
tem. The network represented in this project presents
both healthcare practitioners and discussion topics as
two independent classes of nodes, and the ties from a
practitioner to a topic indicates that that user has com-
municated on the connected topic.
Because the majority of SNA methods involve
one-mode networks, a common component of two-
mode network analysis is to transform the data into a
one-mode network. A new network is created of the
members of the network, and a tie is created between
them if they both communicate on the same thread. It
is preferable to analyze the two-mode network when
possible, as some information is lost in the transfor-
mation, but due to the existing body of literature for
SNA it is necessary to perform much of the analysis
on the one-mode network. Future research will be di-
rected at adapting methods to two-mode networks.
This paper will begin by analyzing the network at
the micro level, using centrality measures to identify
the active members of the network. It will then move
on to identifying potential subgroups of actors within
the network using clique and structural equivalence
analysis.
3.1.1 Centrality
The goal of centrality analysis is to recognize the most
important actors in the network; those actors that are
at the centre of the action in terms of communication
between individuals. Three different centrality statis-
tics are going to be presented; the actors identified
through these measures occupy key roles in the net-
work, and will be considered content experts.
Degree centrality is the simplest of the centrality
measures, calculating the number of ties one actor has
to the others. For the two-mode network this is the
number of threads each actor communicates on, and
for the one-mode network it represents the number of
other actors that actor has communicated with.
Closeness centrality extends the idea of degree
centrality beyond one step. Closeness centrality con-
siders an actor central to the network if they can reach
all the other nodes in the network in as few steps as
possible. The calculation of closeness centrality dif-
fers little between one and two mode networks. If
two actors are one-step away in the one mode net-
work, they are necessarily two steps away in the two-
mode network. Likewise, if two actors in the one-
mode network share a common partner, then each of
them must have shared a thread with that actor in the
two-mode network. Though the normalization is dif-
ferent (Borgatti and Everett, 1997) the general rank-
ing is the same. As such only one-mode closeness
will be presented.
Betweenness centrality deems nodes central if
they are hubs of information. Where closeness deems
a node central if it can quickly reach other nodes, be-
tweenness deems a node central if it is used as path
between other nodes. A node has a high between-
ness score if it falls in the shortest path between many
other pairs of nodes. As with closeness centrality be-
tweenness centrality does not significantly differ be-
tween one and two mode networks (Borgatti and Ev-
erett, 1997).
HEALTHINF 2011 - International Conference on Health Informatics
72

The next step in the SNA is to try and isolate po-
tential subgroups within the network. With a topic
as large as pediatric pain there may be evidence of
subgroups in which actors are more active around a
certain topic of interest. If the network were broken
into groups, one would expect a lot of communication
within groups, and relatively little communication be-
tween groups.
3.1.2 Structural Equivalence
The goal of structural equivalence (SE) is to identify
nodes that occupy similar roles within the network.
Formally, two nodes are SE if they have the same ties
to all other nodes in the network. If two nodes are SE
then one can replace the other without interfering with
the flow of information in the network. In reality true
SE is rare, so approximate SE needs to be measured.
A simple measure would be to count the proportion of
matching ties, or the number of tie changes required
to make two nodes SE. There are several measures
available, but for this project a simple count of the
number of similar ties is used.
Regardless of which SE measure is used, a SE ma-
trix is developed, which records the SE between all
the actors. This matrix is used to group similar actors
using a hierarchical clustering algorithm. The result
is a binary tree, or dendogram, depicting a hierarchi-
cal ranking of similarities, as in figure 7. Cutting the
tree off at a particular level results in partitions being
created from the clusterings. The red blocks in figure
7 represent the cutpoint at which the clusters are cre-
ated. Assigning the actors to these groups creates a
blockmodel.
A blockmodel is a partitioning of the network into
exclusive, non-overlapping groups, such that nodes
within the group are approximately SE. For a block-
model there tends to be a lot of communication within
the blocks and relatively little between them. Once
the optimal block model is determined the active
blocks can be further investigated to determine the
content that makes certain blocks unique.
3.2 Network Visualization
The visualization of networks is a key component
of SNA, and as such there is a rich literature base
describing methods of presenting networks visually.
Linton Freeman (Freeman, 1999) documents the his-
tory of social network visualization from a socio-
logical perspective, including theories on node lay-
out (both information-based and algorithmic theories)
along with the use of colour, size and shape to encode
network information. There are many current tools
for analytic network visualization, including UCINet
(Borgatti et al., 2002) and an extension for the R sta-
tistical language called statnet (Handcock et al.,
2003).
Previous work on social network visualization
has also been directed towards network navigation.
Examples include ContactMap (Nardi et al., 2002)
for identifying community groups within email con-
tacts, PieSpy (Mutton, 2004), which provides a real-
time visualization of social networks for Internet Re-
lay Chat (IRC) members, and Vizster (Heer and
boyd, 2005), a tool for exploring the Friendster
(www.friendster.com) social networking site. These
tools are all designed for 1-mode networks, for ex-
ample, the nodes in the Vizster program all represent
users of Friendster, and the ties represent friendship
links between them. In contrast, this project is visual-
izing a 2-mode network, where the first class of nodes
represent mailing list members and the second rep-
resents threads, and the links between a node and a
thread indicate that a certain list member has commu-
nicated on that thread.
The software being used to implement this project
is the prefuse toolkit in Java (Heer et al., 2005).
Prefuse was chosen because it provides a full Java
library, and previous implementations of prefuse, in-
cluding the Vizster program, have proven successful.
4 VeCON System
4.1 Visualization
The purpose of the visualization is to first provide a
tool for visually exploring social networks, and sec-
ondly to provide some insight into the underlying so-
cial structure of the network. This section will outline
the graph-theoretic layout decisions for the network,
and then explain the visualization tools implemented
to help the exploration of the mailing list.
4.1.1 Graph Structure
The network is laid out using a force-directed lay-
out, in which the nodes repel one another and the
edges act as “springs” that hold the nodes together.
Because of this spring effect, the layout is also
sometimes referred to as a “spring embedding” al-
gorithm. Prefuse implements the Barnes-Hut algo-
rithm (Barnes and Hut, 1986) which allows for real
time calculation of spring-embedding forces. The al-
gorithm is an iterative process, and following the lead
of Vizster, this project chooses to not limit the num-
ber of iterations of the algorithm, resulting in a visu-
alization in which the nodes migrate to their optimal
UNDERSTANDING MEDICINE 2.0 - Social Network Analysis and the VECoN System
73

positions but continue to move subtly. The effect is “a
living or ‘breathing’ feel, connoting social energy or
playfulness.”(Heer and boyd, 2005).
Two changes that need to be made to the spring
embedding algorithm are i) an adaptation to two-
mode networks, and ii) dealing with the problem of
components (disconnected sections of the graph). The
two-mode issue is addressed by Krempel (Krempel,
1999), in which he suggests fixing the second mode
and allowing the first mode to vary. To this end, the
algorithm is adjusted slightly: the first step is to dis-
perse the threads evenly around the space, and then
allow the actors to move according to the spring em-
bedding algorithm. This method has proven to be ef-
fective, but a more formal evaluation of its efficiency
is required.
The issue of components is addressed in Kamada
and Kawai’s seminal work on force directed layouts
(Kamada and Kawai, 1989). The solution is to par-
tition the space according to the number of compo-
nents in the graph, with each graph being allocated
space proportional to its size (number of nodes). The
forces are then calculated only on the nodes within
the component. This means that components do not
effect each other in terms of layout, and avoids the
“drift” that is caused when disconnected components
continue to push each other away (see figure 72 in
(Fruchterman and Reingold, 1991)).
The colouring of the nodes is defined by their
mode: blue indicates actors and red indicates threads.
Following Vizster’s lead, nodes and their neighbours
are highlighted when the mouse hovers over them:
when hovering over an actor that actor’s threads are
highlighted, and conversely when hovering over a
thread the actors that communicated on that thread are
highlighted. The highlighting is done by increasing
the saturation of the colour (see figure 3).
4.1.2 Exploration
The visualization provides several different explo-
ration methods, which will each be described in de-
tail. The objective of each of the tools is to provide a
different way of exploring the mailing list to retrieve
pertinent messages.
Hover Over. As mentioned before, the visualiza-
tion implements a hover-over feature. When the
mouse hovers over a node, that node becomes fixed,
and it and its neighbours are “highlighted”. A node
is highlighted by increasing the saturation. Figure 3
demonstrates the difference between the regular and
highlighted nodes.
Along with changing the representation of the
(a) Regular. (b) Highlighted. (c) Focus Node.
Figure 3: Highlighting is achieved by increasing the satura-
tion from 25 to 50. A focus node is activated by clicking it,
at which point it doubles in size.
nodes, the hover-over feature presents additional in-
formation about the node/edge in question. For ac-
tors it presents the actor’s name in the top-right cor-
ner of the visualization, and for threads it presents the
thread’s subject line (see figure 8). The node names
were not put on the nodes in order to avoid cluttering
the visualization: current node labels are numerical
identifiers, provided in order to differentiate between
actors.
On the right side of the visualization is the con-
trol bar, where users can manage their search features
and control the factors that effect the spring embed-
ding. At the bottom of the control bar is a text box
that presents the detailed content of the selected node.
For actors a list of the threads they have communi-
cated on is presented, and for threads the conversation
is presented. When an edge is selected then that spe-
cific message is presented. The objective is to allow
the user to quickly browse through the conversations,
and upon finding the desired message to explore it in
more detail. Future work will pursue connecting the
visualization directly to the online discussion forum,
but as the forum is not yet developed this feature is
not implemented.
Point and Click. The objective of the point and
click option is to allow the user to explore a partic-
ular node in more detail. When a node is clicked dou-
bles in size, and the text associated with it becomes
fixed. The user can then adjust the temporal filter to
see where that node fits within the filtered data. While
the node is in focus (i.e. while its size is doubled) the
text stays static, though the rest of the highlighting ef-
fects associated with hovering remain. A second click
on the node reduces it back to normal size and allows
the text to change freely again. Figure 3 demonstrates
what a focus node looks like.
Temporal Filtering. Adding a temporal filter pro-
vides a way to reduce the volume of information be-
ing presented. The temporal filtering is accomplished
using a horizontal scroll bar, located within the con-
trol panel. The user can manipulate the lower-end or
HEALTHINF 2011 - International Conference on Health Informatics
74

upper-end of the bar to adjust the visualization, or can
set the bar to a specific window width and slide the
window itself. When the mouse is released the graph
is re-drawn with only those messages that are within
the window presented. The user can also manipulate
the dates manually by typing dates into the two date
boxes that are below the bar.
When the visualization is adjusted, only those
nodes that are connected to each other are presented,
reducing clutter by removing obsolete nodes. There
is still a potential for isolates in the filtered network,
however. If an actor participates in a thread, but that
contribution is not made during the window, then the
edge will be removed but the actor will remain in
the network, and that contribution will still be pre-
sented in the hover-over effect. Future work should
explore how to incorporate the disconnected user into
the force-directed layout, but for now the user is as-
signed a separate segment of the space.
5 METHODS
5.1 Data
This project will use the archives of the Pediatric Pain
Mailing List (PPML), provided to the VECoN project
by the administrators of the mailing list. There are
over 13,000 messages in the PPML archives, dating
back to 1991; for this project a sample of the mes-
sages from 2007 and 2008 was used. The sample
has been parsed from simple ASCII text files and the
messages have been written into a MySQL database.
Along with sender, subject and date information about
each message, a thread number has been assigned to
indicate which messages combine to form conversa-
tions. The threads and senders will be used as nodes
in the network, with ties between them indicating that
a sender has communicated on a particular thread.
Currently the PPML administrators are in the process
of transferring the archives of the mailing list to an
online discussion forum. Once this forum is active
the VECoN system will be connected to it.
5.1.1 Social Network Visualization
Beyond simple network exploration the tool pro-
vides functions to explore the SNA dimensions of
the PPML. Within the control panel there are but-
tons to toggle centrality indicators and block mod-
elling. When activated the centrality indicators rede-
fine the actor and thread nodes in the network, setting
the node size relative to that node’s degree. Currently
only degree centrality is implemented, but all three
centrality measures will eventually be added.
As well, the tool performs agglomerative cluster-
ing using the SE calculations from the blockmod-
elling. It is left to the user to decide how many blocks
to assign to the network, presenting the blocks as
“blobs” surrounding the component members. When
activated the blobs modify the spring embedding al-
gorithm to increase tensions within the blobs and
decrease tension outside them, resulting in tighter
groups of block members.
6 RESULTS
6.1 SNA
6.1.1 Micro Level Analysis
Table 1 lists the actors with the highest degrees in the
two-mode network, and table 2 lists the same for the
one-mode network.
Table 1: Actors with the highest degree centrality in the
two-mode network, i.e., the actors with the most number of
threads. The degree is normalized by dividing the degree
measure by the maximum possible degree.
Actor Degree NormDegree
771 31 0.1148
901 27 0.1000
782 26 0.0963
904 22 0.0815
920 20 0.0741
Table 2: Actors with the highest degree centrality in the
one-mode network, i.e., those actors that communicated
with many other members of the network. The degree is
normalized by dividing it by the max possible degree.
Actor Degree NormDegree
901 74 0.3776
904 60 0.3061
782 57 0.2908
855 56 0.2857
920 53 0.2704
From the degree centrality analysis there seem to
be several actors that are quite active. The maxi-
mum normalized degree of 0.115 in the two-mode
network indicates that actors are not participating in
many threads, and a normalized degree of 0.378 in
the one-mode network continues to demonstrate there
does not seem to be a single user in the network that
communicates with all other users. The histograms in
UNDERSTANDING MEDICINE 2.0 - Social Network Analysis and the VECoN System
75

Distribution of two−mode Degrees
two−mode degree
Frequency
0 5 10 20 30
0 50 100 150
Distribution of Actor Degrees
Actor degree
Frequency
0 20 40 60 80
0 20 60 100
Figure 4: Distrubtion of degrees for the PPML data. The
histograms indicate that there are not many actors with high
degree centrality.
Closeness in Actor Network
Closeness
Frequency
0.25 0.30 0.35 0.40 0.45 0.50 0.55 0.60
0 10 20 30 40 50
Figure 5: Distribution of closeness scores for the PPML
data. The closeness scores follow a normal distribution.
figure 4 confirm that suspicion; the majority of actors
in both the one- and two-mode networks have low de-
gree centrality measures.
Table 3 lists the highest closeness scores in the
network. The actors that have the highest closeness
Table 3: Closeness scores for the PPML network.
Actor Closeness
901 0.5957
904 0.5665
920 0.5552
782 0.5521
771 0.5506
scores are the same actors with high degree scores.
With a max closeness of 0.596 the network seems
to have a very high closeness measure. This means
that it is easy to get from any node to any other node.
These findings are confirmed in the histograms in fig-
ure 5. This histogram seems to follow a normal distri-
bution, centred at 0.419 with a standard deviation of
0.064, meaning that 97.5% of the members of the net-
work have a closeness centrality greater than 0.292.
Table 4 lists the highest betweenness scores from
the network. Once again, the same actors are promi-
nent for the betweenness calculation. The low maxi-
mum betweenness of 0.134 indicates that the network
does not depend on any particular actor to facilitate
Table 4: Betweenness scores for the actor network. As with
closeness, betweenness measures the same thing in the 1
and 2 mode networks.
Actor Betweenness
901 0.134
904 0.103
920 0.072
782 0.066
855 0.063
Distribution of Actor Betweenness scores
Normalized Betweenness
Frequency
0.00 0.02 0.04 0.06 0.08 0.10 0.12 0.14
0 50 100 150
Figure 6: Betweenness scores for the PPML network data.
communication. The histogram in figure 6 confirms
that finding, with the majority of users having low be-
tweenness.
The centrality scores for the network indicate a
healthy and active knowledge sharing network. Low
degree centralities mean that there is not a single user,
or a set of users, that are required to initiate conver-
sation. High closeness scores mean that it is easy to
connect one user to another, either through a thread
they have both communicated on, or a short series
of “mutual friends”; this is key to facilitating knowl-
edge transfer, to allow users to connect directly to
the source of experiential knowledge in as few steps
as possible. Low betweenness scores compound this
finding by demonstrating that, when trying to connect
with someone through a series of users, there are al-
ways multiple paths available, without the need to al-
ways communicate through a single user. These re-
sults combine to describe a knowledge sharing net-
work that has a large number of healthy communica-
tors and an active user base.
Though the centrality results do not demonstrate
the presence of any dominant users, it is noteworthy
that the same actors appear at the top of all four sets of
centrality measures. Table 5 lists the top ranked actors
for each of the four centrality measures, and the same
four actors appear in each list. If further investiga-
tion into the content of the mailing list were required,
these actors should be the first to be contacted, as they
seem to be the most active and most important to the
communication network.
HEALTHINF 2011 - International Conference on Health Informatics
76

Table 5: The ranking of actors provided by each of the three
centrality measures.
Degree Degree.2M Closeness Betweenness
901 771 901 901
904 901 904 904
782 782 920 920
855 904 782 782
920 920 771 855
125
23
127
2
78
49
79
11
31
115
70
82
81
77
80
94
33
192
35
188
20
52
55
87
110
38
34
193
194
191
190
187
189
178
180
42
138
14
92
134
171
32
108
139
154
161
197
140
196
185
186
25
149
24
28
98
173
58
163
167
7
16
15
1
12
5
6
172
102
19
195
69
164
174
90
8
26
84
75
66
104
105
109
143
182
17
130
4
103
30
97
63
99
21
128
132
145
148
74
62
67
83
3
85
141
131
121
122
61
54
144
40
41
181
184
117
118
175
176
89
100
120
107
88
126
73
71
72
29
156
158
151
142
153
137
152
135
162
177
96
129
95
136
68
169
170
91
18
13
27
9
183
179
116
86
43
53
133
93
168
59
60
57
64
65
157
146
160
111
114
112
113
36
44
159
147
155
166
165
119
22
150
47
50
56
51
46
48
76
45
10
106
101
37
124
39
123
Hierarchical Clustering of the Actor Network
Figure 7: A hierarchical clustering of the actors in the one-
mode network using structural equivalence. The red blocks
indicate the points at which the tree is cut to create the
blockmodel.
6.1.2 Macro Level Analysis
For the PPML the blockmodel contains three groups,
two small groups with 15 and 22 members, and one
large group with 160 members (figure 7 contains the
dendogram). The image matrix produced by the block
model is available in table 6. An image matrix is a
table that represents the communication densities be-
tween blocks. This image matrix demonstrates that
there is a lot of communication within the two smaller
blocks, and a bit of communication between them
(0.183 density). For the large group in block 1, how-
ever, there is little communication, either within or
between blocks.
Table 6: Communication Densities Within and Between
Blocks.
Block 1 Block 2 Block 3
Block 1 0.04796 0.07958 0.06932
Block 2 0.07958 1.00000 0.10000
Block 3 0.06932 0.10000 1.00000
SE provides a partitioning of the network into
groups of “similar” actors. For the PPML it provides
three separate groups: two small, active groups and
one large, relatively inactive group. These groupings
provide some insight into the communication patterns
between users, and are of keen interest in determin-
ing the presence/absence of subgroups of interest in
the network. The small groups may represent an
active sub-group of experiential knowledge sharers,
who actively communicate with all other members of
the group. Further investigation of the content of the
communications within these two groups is required.
6.2 Visualization
Figure 8 is a capture of the VECoN system. The left
pane contains the network visualization, and the right
pane contains the spring-embedding controls, the fil-
ter controls and the message pane where the contents
of the threads or the participating threads are pre-
sented.
7 DISCUSSION
The SNA provided some useful insight into the com-
munication patterns within the network, but further
analysis is required to fully flush out what the results
mean in the scope of the project.
7.1 Isolates
There were 68 isolates recognized in the actor net-
work. These were actors whose messages received
no response on the mailing list. A further investiga-
tion reveals that some of these actors posted few times
to the network; 13 only posted to the PPML once.
Looking through the subject lines, there are several
messages that are not meaningful pediatric pain com-
munications (such as incorrect subscribe/unsubscribe
messages and job or conference announcements).
However, there are also meaningful messages which
received no response. There does not seem to be a
pattern to which messages were ignored, and after fil-
tering the spam messages there were only nine mean-
ingful queries that were left unanswered. This is a
positive finding for a mailing list, as it is evidence
that knowledge seeking queries are being answered
most of the time. Moving forward it is imperative that
the PPML continues to be an active community by
incorporating new members and responding to their
queries.
UNDERSTANDING MEDICINE 2.0 - Social Network Analysis and the VECoN System
77
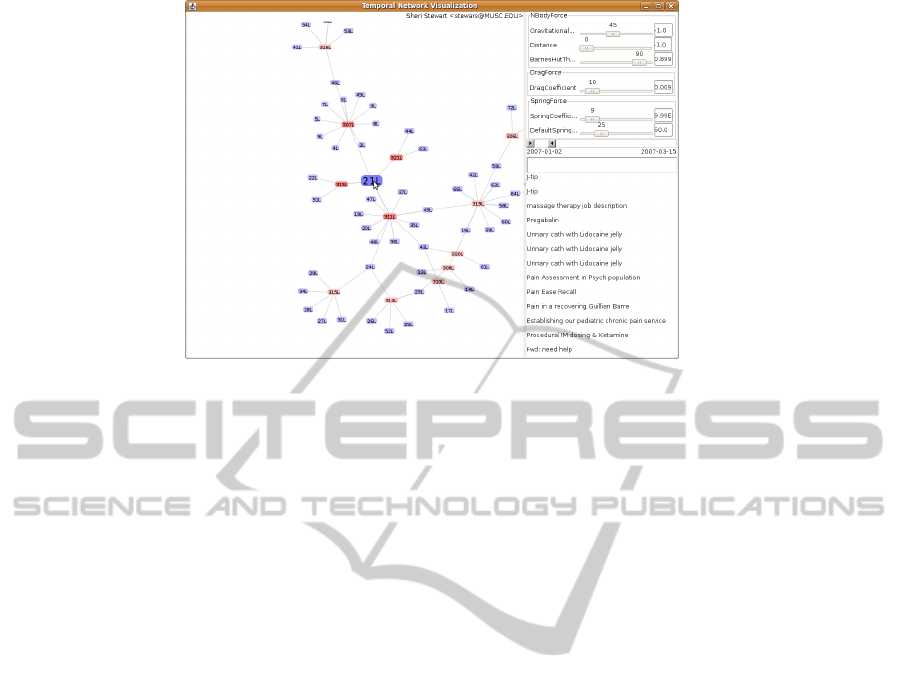
Figure 8: The PPML visualization. Note that the current network is restricted to messages between 2007-01-02 and 2007-03-
21.
7.2 Centrality
The centrality analysis has indicated that there is not
a central user or set of users that control the com-
munications on the network. For each of the four
measurements the highest scoring actors do not have
disproportionately high normalized values, indicating
that there is not one actor that communicates on ev-
ery thread, or connects disparate groups of actors.
Though the low degree centrality scores could be in-
terpreted as members being inactive, a more reason-
able interpretation is that there are many messages on
the mailing list that are spawning conversations be-
tween different actors. This is a very promising result
moving forward.
Detecting content experts or knowledge shar-
ing activities strictly using graph-theoretic principles
such as centrality analysis poses problems. If some-
one contributes to the list by asking many questions,
without providing answers, they are recognized as
central users, but should not be considered content
experts. In order to improve the prediction of con-
tent experts it is necessary to extract the underlying
semantics of the messages being communicated. Pre-
vious work, (Stewart et al., 2010), has worked on
extracting semantic representations of the messages,
and incorporating this information into the SNA could
help differentiate the content experts from the “ques-
tion askers.”
7.3 Structural Equivalence
The structural equivalence analysis broke the model
into 3 separate groups: two with high density commu-
nications and one with low density communication.
Further analysis into the content of the two groups re-
veals little to identify the two blocks, and there is little
to suggest that there are any specific sub-specialities
of interest within these two groups. Further investi-
gation should pursue other measures of SE, including
incorporating the 2-mode nature of the data.
7.4 Visualization
A beta release of the VECoN system has been pro-
duced, but it has not yet been tested by the PPML
members. Once the mailing list is available as a dis-
cussion forum and links between the visualization and
the forum are established the VECoN system will be
rolled out as a Java applet, and at that point research
will be conducted on its utility and on future addi-
tions. Currently future research is being conducted
to improve the spring-embedding algorithm and the
blockmodelling algorithm, along with adding more
centrality measures and a more intuitive control panel.
8 CONCLUSIONS
Experiential healthcare knowledge is a vital compo-
nent of the current healthcare system, and developing
new methods to facilitate the sharing of this knowl-
edge is vital to sustaining and improving the medi-
cal community. Medicine 2.0 technologies provide
online tools for facilitating knowledge sharing, es-
tablishing virtual communities of clinicians. Under-
standing the flow of knowledge in these virtual com-
munities is key to developing new systems, and SNA
provides the necessary tools for understanding the
HEALTHINF 2011 - International Conference on Health Informatics
78

flow of communication within the network. It has
provided a list of potential content experts within the
list, it has recognized several active subgroups, and it
has partitioned the network into disparate groups of
potentially different clinicians.
Further research should be directed at better un-
derstanding the members of the community. More
actor attributes, such as specialty, location, job de-
scription, et cetera, would provide better insight into
the structure of the network, and in particular into
the structure of the subgroups revealed through block-
modelling. Incorporating the semantic information of
the communications themselves would help differen-
tiate between acts of knowledge seeking and knowl-
edge sharing, and improve our overall understanding
of the experiential knowledge available in the net-
work.
Though the VECoN project is only in its beta
stages, preliminary results are promising. The net-
work has been visualized, and SNA tools have been
added. Future work will be on adding new SNA tools,
improving the visualization, implementing the sys-
tem online and making the interface more intuitive.
The ultimate goal of the VECoN system is to provide
a novel network exploration tool to help users make
new connections within the PPML community, and
find new sources of experiential knowledge already
available in the network.
ACKNOWLEDGEMENTS
This work is carried out with the aid of a grant from
the International Development Research Centre, Ot-
tawa, Canada. The authors would like to acknowledge
Dr. Allen Finley for his contributions to the PPML
and his ongoing support of this research.
REFERENCES
Barnes, J. and Hut, P. (1986). A hierarchical o(n log n) force
calculation algorithm. Nature, 324.
Borgatti, S., Everett, M., and Freeman, L. (2002). Ucinet for
windows: Software for social network analysis. Har-
vard, MA: Analytic Technologies.
Borgatti, S. P. and Everett, M. G. (1997). Network analysis
of 2-mode data. Social Networks, 19:243–269.
Freeman, L. C. (1999). Visualizing social networks. Web.
http://www.cmu.edu/joss/content/articles/volume1/
Freeman.html.
Fruchterman, T. M. J. and Reingold, E. M. (1991). Graph
drawing by force-directed placement. Software-
Practice and Experience, 21:1129–1164.
Handcock, M. S., Hunter, D. R., Butts, C. T., Goodreau,
S. M., and Morris, M. (2003). statnet: Software
Tools for the Statistical Modeling of Network Data.
Seattle, WA. Version 2.1 . Project home page at
http://statnetproject.org.
Hanneman, R. A. and Riddle., M. (2005). Introduction
to social network methods. University of California,
Riverside, Riverside, CA.
Heer, J. and boyd, d. (2005). Vizster: Visualizing online
social networks. InfoVis.
Heer, J., Card, S., and Landay., J. (2005). prefuse: A toolkit
for interactive information visualization. In CHI.
Kamada, T. and Kawai, S. (1989). An algorithm for draw-
ing general undirected graphs. Information Process-
ing Letters, 31:7–15.
Krempel, L. (1999). Visualizing networks with spring em-
bedder: Two-mode and valued data. American Statis-
tical Association, Proceedings of the Section of Statis-
tical Graphics, pages 36–45.
Mutton, P. (2004). Inferring and visualizing social networks
on internet relay chat. InfoVis, pages 35–43.
Nardi, B., Whittaker, S., Isaacs, E., Creech, M., Johnson,
J., and Hainsworth, J. (2002). Contactmap: Integrat-
ing communication and information through visualiz-
ing personal social networks. Communications of the
ACM, 45(4):89–95.
Stewart, S., Abidi, S., and Finley, A. (2010). Pediatric
pain management knowledge linkages: mapping ex-
periential knowledge to explicit knowledge. Studies in
Health Technology and Informatics, 160:1184–1188.
Wasserman, S. and Faust, K. (1994). Social Network Analy-
sis: Methods and Applications. Cambridge University
Press.
UNDERSTANDING MEDICINE 2.0 - Social Network Analysis and the VECoN System
79
