
EVALUATING AND MODELING VIRTUALIZATION
PERFORMANCE OVERHEAD FOR CLOUD ENVIRONMENTS
Nikolaus Huber, Marcel von Quast
Software Design and Quality, Karlsruhe Institute of Technology, Am Fasanengarten 5, Karlsruhe, Germany
Michael Hauck
Forschungzentrum Informatik FZI, Karlsruhe, Germany
Samuel Kounev
Software Design and Quality, Karlsruhe Institute of Technology, Am Fasanengarten 5, Karlsruhe, Germany
Keywords:
Virtualization, Modeling, Benchmarking, Performance.
Abstract:
Due to trends like Cloud Computing and Green IT, virtualization technologies are gaining increasing impor-
tance. They promise energy and cost savings by sharing physical resources, thus making resource usage more
efficient. However, resource sharing and other factors have direct effects on system performance, which are
not yet well-understood. Hence, performance prediction and performance management of services deployed
in virtualized environments like public and private Clouds is a challenging task. Because of the large vari-
ety of virtualization solutions, a generic approach to predict the performance overhead of services running
on virtualization platforms is highly desirable. In this paper, we present experimental results on two popular
state-of-the-art virtualization platforms, Citrix XenServer 5.5 and VMware ESX 4.0, as representatives of the
two major hypervisor architectures. Based on these results, we propose a basic, generic performance predic-
tion model for the two different types of hypervisor architectures. The target is to predict the performance
overhead for executing services on virtualized platforms.
1 INTRODUCTION
In recent years, due to trends like Cloud Comput-
ing, Green IT and server consolidation, virtualiza-
tion technologies are gaining increasing importance.
Formerly used to multiplex scarce resources such as
mainframes (Rosenblum and Garfinkel, 2005), nowa-
days virtualization is again used to run multiple vir-
tual servers on a single shared infrastructure, thus in-
creasing resource utilization, flexibility and central-
ized administration. Because this technology also al-
lows sharing server resources on-demand, it promises
cost savings and creates new business opportunities
by providing new delivery models, e.g., Infrastructure
as a Service or Software as a Service.
According to the International Data Corpora-
tion (IDC), 18% of all new servers shipped in the
fourth quarter of 2009 were virtualized (IDC, 2010)
and the server virtualization market is expected to
grow 30% a year through 2013 (IT world, The IDG
Network, 2008). However, the adoption of server
virtualization comes at the cost of increased system
complexity and dynamics. The increased complex-
ity is caused by the introduction of virtual resources
and the resulting gap between logical and physical re-
source allocations. The increased dynamics is caused
by the lack of direct control over the underlying physi-
cal hardware and by the complex interactions between
the applications and workloads sharing the physical
infrastructure introducing new challenges in systems
management.
Hosting enterprise services on virtualized plat-
forms like Cloud environments requires an efficient
performance management strategy at the application
level. Service-Level Agreements (SLAs), e.g., perfor-
mance guarantees such as service response time ob-
jectives, need to be respected. On the other hand, the
target is to utilize server resources efficiently in or-
der to save administration and energy costs. Thus,
providers of virtualized platforms are faced with
563
Huber N., von Quast M., Hauck M. and Kounev S..
EVALUATING AND MODELING VIRTUALIZATION PERFORMANCE OVERHEAD FOR CLOUD ENVIRONMENTS.
DOI: 10.5220/0003388905630573
In Proceedings of the 1st International Conference on Cloud Computing and Services Science (CLOSER-2011), pages 563-573
ISBN: 978-989-8425-52-2
Copyright
c
2011 SCITEPRESS (Science and Technology Publications, Lda.)

questions such as: What performance would a new
service deployed on the virtualized infrastructure ex-
hibit and how much resources should be allocated to
it? How should the system configuration be adapted
to avoid performance problems arising from chang-
ing customer workloads? In turn, customers using
virtualized resources are interested in a service’s per-
formance behavior when, e.g., moving it to a Cloud
Computing environment or when migrating it from
one platform to another.
Answering such questions for distributed, non-
virtualized execution environments is already a com-
plex task (Menasc
´
e et al., 1994). In virtualized en-
vironments, this task is even more complicated be-
cause resources are shared. Moreover, since changes
in the usage profiles of services may affect the en-
tire infrastructure, capacity planning has to be per-
formed continuously during operation. Proactive per-
formance management, i.e., avoiding penalties by act-
ing before performance SLAs are violated, requires
predictions of the application-level performance un-
der varying service workloads. Given that compu-
tation details are abstracted by an increasingly deep
virtualization layer, the following research questions
arise: i) What is the performance overhead when vir-
tualizing execution environments? ii) Which are the
most relevant factors that affect the performance of
a virtual machine? iii) What are the differences in
performance overhead on different virtualization plat-
forms? iv) Can the performance-influencing factors
be abstracted in a generic performance model?
Previous work on performance evaluation of vir-
tualization platforms focuses mainly on comparisons
of specific virtualization solutions and techniques,
e.g., container-based virtualization versus full virtu-
alization (Barham et al., 2003; Padala et al., 2007;
Soltesz et al., 2007; Qu
´
etier et al., 2007). Other work
like (Apparao et al., 2008; Tickoo et al., 2009; Iyer
et al., 2009) investigates core and cache contention ef-
fects. (Koh et al., 2007) predict the performance infer-
ence of virtualized workloads by running benchmarks
manually. (Huber et al., 2010) propose an approach
on a systematic and automated experimental analysis
of the performance-influencing factors of virtualiza-
tion platforms applied to the Citrix XenServer 5.5.
In this paper, we use the automated experimen-
tal analysis approach from (Huber et al., 2010) as
a basis. We extend this approach and evaluate its
applicability to VMware ESX 4.0, another industry-
standard platform with a different hypervisor archi-
tecture (Salsburg, 2007). The main goal is to build
a generic model which enables the prediction of per-
formance overheads on different virtualization plat-
forms. To this end, we evaluate various performance-
influencing factors like scheduling parameters, differ-
ent workload types and their mutual influences, and
scalability and overcommitment scenarios on the two
different types of hypervisor architectures. At the
same time, we evaluate the portability of automated
experimental analysis approach to other platforms.
Finally, we summarize the results of both case studies
and formulate a basic generic model of the influences
of various parameters on the performance of virtual-
ized applications. This model shall provide the means
for estimating the performance of a native application
when migrated to a virtualized platform or between
platforms of different hypervisor architectures. In ad-
dition, this model can be used for capacity planning,
e.g., by Cloud providers, to estimate the number of
virtual machines (VMs) which can be hosted.
The contributions of this paper are: i) an in-depth
experimental analysis of the the state-of-the-art Cit-
rix XenServer 5.5 virtualization platform covering
performance-influencing factors like scheduling pa-
rameter, mutual influences of workload types etc.,
ii) an evaluation of these results on VMware ESX 4.0,
another representative virtualization platform with a
different hypervisor architecture, iii) an experience
report on the migration of virtual machines and the
automated administration of virtualization platforms,
iv) a basic model capturing the general performance-
influencing factors we have identified.
The remainder of this paper is organized as fol-
lows. Section 2 provides an overview of the auto-
mated experimental analysis we use. Additionally,
it presents further experimental results on the Citrix
XenServer 5.5. An evaluation of our results based on
repeated experiments on VMware ESX 4.0 is given in
Section 3. In Section 4, we present our performance
prediction model. Section 5 discusses related work,
followed by a conclusion and an outlook on future
work in Section 6.
2 AUTOMATED EXPERIMENTAL
ANALYSIS
Because virtualization introduces dynamics and in-
creases flexibility, a variety of additional factors can
influence the performance of virtualized systems.
Therefore we need to automate the experiments and
performance analysis as much as possible. In this
section we give a brief summary of the generic ap-
proach to automated experimental analysis of virtual-
ized platforms presented in (Huber et al., 2010). We
briefly explain the experimental setup as well as the
general process that is followed. Furthermore, we ex-
plain the experiment types in more detail because they
CLOSER 2011 - International Conference on Cloud Computing and Services Science
564

are used as a basis for our evaluation. We also sum-
marize the previous results of (Huber et al., 2010) and
enrich them with more more fine-grained results and
analyses in Section 2.5.
2.1 Experimental Setup
The experimental setup basically consists of a Mas-
terVM and a controller. From a static point of view,
the MasterVM serves as a template for creating multi-
ple VM clones executing a benchmark of choice (see
Section 2.4). It contains all desired benchmarks to-
gether with a set of scripts to control the benchmark
execution (e.g., to schedule benchmark runs). A sec-
ond major part is the controller which runs on a ma-
chine separated from the system under test. From a
dynamic point of view, the controller clones, deletes,
starts, and stops VMs via the virtualization layer’s
API. Furthermore, it is responsible for collecting, pro-
cessing and visualizing the results. It also adjusts the
configuration (e.g., the amount of virtual CPUs) of the
MasterVM and the created clones as required by the
considered type of experiment.
2.2 Experiment Types
Several types of experiments are executed, targeted
at the following categories of influencing factors:
(a) virtualization type, (b) resource management con-
figuration, and (c) workload profile.
For category (a), an initial set of experiments is
executed to quantify the performance overhead of the
virtualization platform. The number of VMs and
other resource management-related factors like core
affinity or CPU scheduling parameters are part of cat-
egory (b). The influence of these factors is investi-
gated in two different scenarios, focused on scalabil-
ity (in terms of number of co-located VMs), and over-
commitment (in terms of allocating more resources
than are actually available). For scalability, one in-
creases the number of VMs until all available physical
resources are used. For overcommitment, the number
of VMs is increased beyond the amount of available
resources. Finally, for category (c) a set of bench-
marks is executed focusing on the different types of
workloads. For a more detailed description of the ex-
periment types as well as a benchmark evaluation, we
refer to (Huber et al., 2010).
2.3 Experimental Environment
We conducted our experimental analysis in two differ-
ent hardware environments described below. In each
considered scenario Windows 2003 Server was the
native and guest OS hosting the benchmark applica-
tion, unless stated otherwise.
Environment 1. This environment is a standard
desktop HP Compaq dc5750 machine with an
Athlon64 dual-core 4600+, 2.4 GHz. It has 4 GB
DDR2-5300 of main memory, a 250 GB SATA HDD
and a 10/100/1000-BaseT-Ethernet connection. The
purpose of this environment was to conduct initial ex-
periments for evaluating the overhead of the virtual-
ization layer. This hardware was also used to run ex-
periments on a single core of the CPU by deactivating
the second core in the OS.
Environment 2. To evaluate the performance when
scaling the number of VMs, a SunFire X4440 x64
Server was used. It has 4*2.4 GHz AMD Opteron
6 core processors with 3MB L2, 6MB L3 cache each,
128 GB DDR2-667 main memory, 8*300 GB of se-
rial attached SCSI storage and 4*10/100/1000-BaseT-
Ethernet connections.
2.4 Benchmark Selection
Basically, any type of benchmark can be used in
the automated experimental analysis. Only the
scripts to start and stop the benchmark and to ex-
tract the results must be provided. For CPU and
memory-intensive workloads, two alternative bench-
marks have been discussed in (Huber et al., 2010):
Passmark PerformanceTest v7.0
1
(a benchmark used
by VMware (VMware, 2007)) and SPEC CPU2006
2
(an industry standard CPU benchmark). Both bench-
marks have a similar structure consisting of sub-
benchmarks to calculate an overall metric. Bench-
mark evaluation results in (Huber et al., 2010) showed
that both Passmark and SPEC CPU show similar re-
sults in terms of virtualization overhead. However, a
SPEC CPU benchmark run can take several hours or
even to complete. Since passmark has much shorter
runs, the authors use Passmark in their experiments
and repeat each benchmark run 200 times to obtain
a more confident overall rating and to gain a picture
of the variability of the results. In addition to Pass-
mark, the Iperf benchmark
3
is used to measure the
network performance. It is based on a client-server
model and supports the throughput measurement of
TCP and UDP data connections between both end-
points.
1
Passmark PerformanceTest: http://www.passmark.com/
products/pt.htm
2
SPEC CPU2006: http://www.spec.org/cpu2006/
3
Iperf: http://iperf.sourceforge.net/
EVALUATING AND MODELING VIRTUALIZATION PERFORMANCE OVERHEAD FOR CLOUD
ENVIRONMENTS
565
2.5 Experiment Results
In (Huber et al., 2010), several benchmarks (CPU,
memory, network I/O) were automatically executed
to analyze the performance of native and virtualized
systems. The results of a case study with Citrix
XenServer 5.5 showed that the performance overhead
for CPU virtualization is below 5% due to the hard-
ware support. However, memory and network I/O vir-
tualization overhead amounts up to 40% and 30%, re-
spectively. Further experiments examined the perfor-
mance overhead in scalability and overcommitment
scenarios. The results for both the scalability and
overcommitment experiments showed that the perfor-
mance behavior of Citrix XenServer 5.5 meets the ex-
pectations and scales very well even for more than
100 VMs. Moreover, the measurements showed that
performance loss can be reduced if one assigns the
virtual CPUs to physical cores (called core pinning or
core affinity). For a detailed discussion of the previ-
ous results, we refer to (Huber et al., 2010).
These previous findings are now extended by our
more recent in-depth measurement results. At first,
we compare the performance overhead of virtualiza-
tion for different workload types. Second, we present
performance overheads in scaled-up and overcommit-
ment scenarios. Finally, we investigated the impact of
network I/O in more detail.
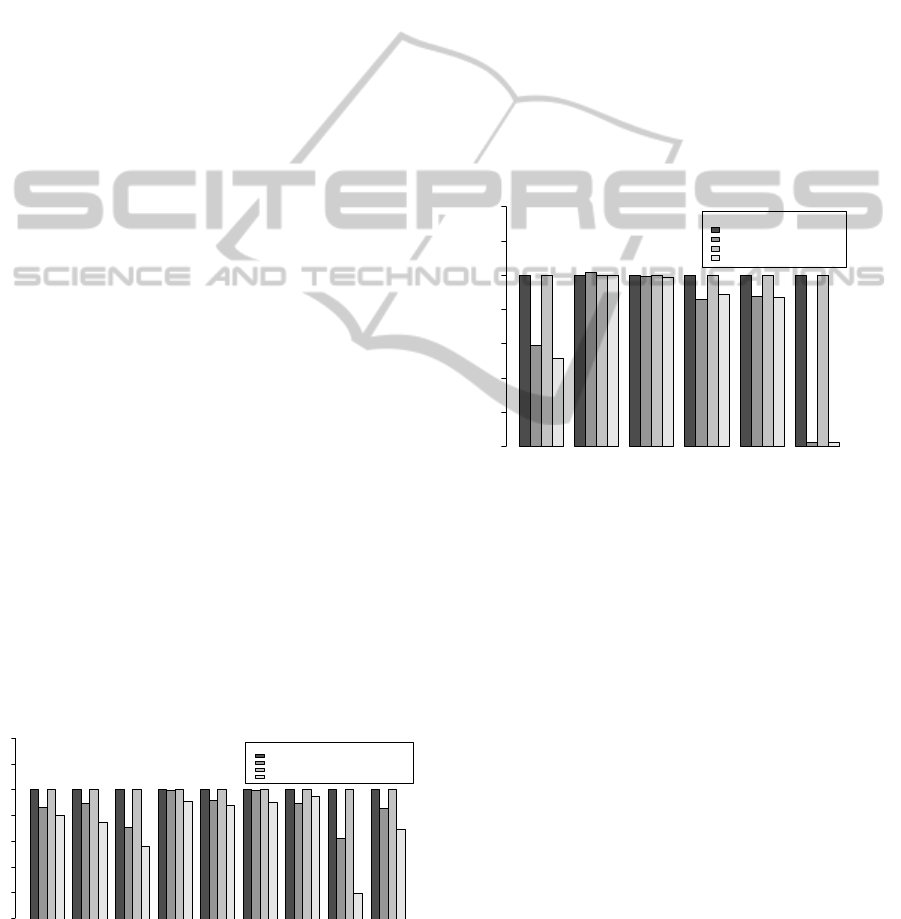
Overhead of Virtualization. In these experiments,
we investigate the performance degradation for CPU,
memory and I/O in more detail by looking at the
sub-benchmark results of each benchmark metric.
The new measurement results of Figure 1 depict the
fine-grained sub-benchmark results for the Passmark
CPU Mark results normalized to the native execu-
tion. The results demonstrate that floating point op-
erations are more expensive (up to 20% performance
drop for the Physics sub-benchmark) than the other
sub-benchmark results. However, the overall perfor-
mance drops are still in the range of 3% to 5%.
Total
(CPU Mark) Integer Math
Floating Point
Math
Find Prime
Numbers SSE Compression Encryption Physics String Sorting
Legend
native (1 CPU core)
virtualized (1 CPU core)
native (2 CPU cores)
virtualized (2 CPU cores)
normalized
0.75 0.80 0.85 0.90 0.95 1.00 1.05 1.10
Figure 1: Sub-benchmark results of the Passmark CPU
Mark metric.
Looking at the fine-grained memory benchmark
results depicted in Figure 2, one can see that for
the memory-intensive workloads the main cause for
the overall performance drop stems from the alloca-
tion of large memory areas. For the Large RAM sub-
benchmark, performance overhead is almost 97%.
The problem was, that to replicate our VM template
in the CPU overcommitment scenarios, we could only
assign 256MB main memory to each VM because
memory overcommitment is currently not supported
by Citrix XenServer 5.5. However, when increasing
this size to 3GB main memory in separate, indepen-
dent experiment with one VM at a time, the perfor-
mance overhead for large memory accesses is only
65% instead of 97%, which also improves the over-
all memory benchmark results slightly. Hence, in-
creasing memory allocation can significantly improve
performance for memory-intensive workloads, espe-
cially if expensive swapping can be avoided.
Total
(Memory Mark)
Allocate
Small Block
Read
Cached
Read
Uncached Write Large RAM
Legend
native (1 CPU core)
virtualized (1 CPU core)
native (2 CPU cores)
virtualized (2 CPU cores)
normalized
0.0 0.2 0.4 0.6 0.8 1.0 1.2 1.4
Figure 2: Sub-benchmark results of the Passmark Memory
Mark metric.
Finally, Figure 3 shows our results for disk I/O
intensive workloads . With the Passmark Disk mark
benchmark, we measured a performance overhead of
up to 28%. A more detailed look at the benchmark
results shows that most of the performance overhead
is caused by sequential read requests, which achieve
only 60% of the native performance, whereas for
write request’s the performance overhead does not
exceed 20%.
The performance increase for the random seek
benchmark can be explained by the structure of
the virtual block device, a concept used in Citrix
XenServer 5.5 for block oriented read and write, min-
imizing administration overhead and thus decreasing
access times.
Scalability and Overcommitment. Previous ex-
perimental results showed that the performance over-
head can be reduced for CPU workload when us-
ing core affinity. The following more detailed mea-
surements give more insights and explain why core
CLOSER 2011 - International Conference on Cloud Computing and Services Science
566
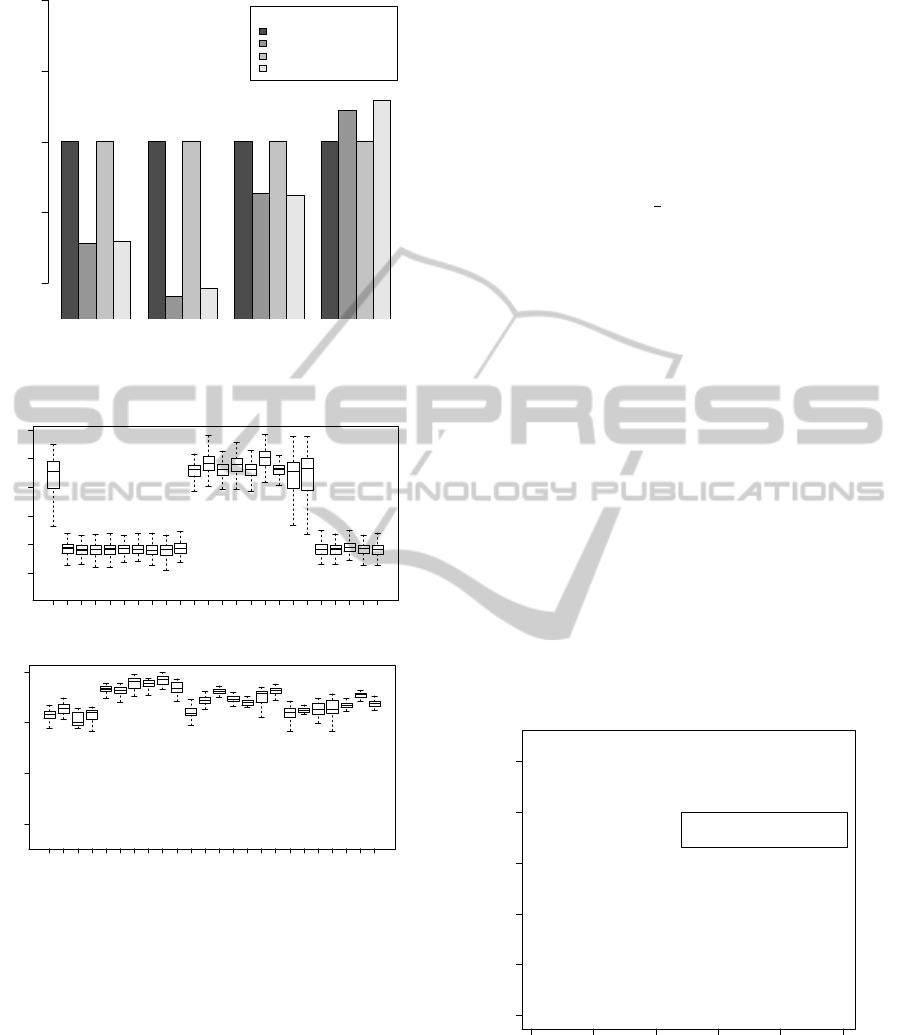
Total
(Disk Mark)
Sequential
Read
Sequential
Write
Random Seek
(read/write)
Legend
native (1 CPU core)
virtualized (1 CPU core)
native (2 CPU cores)
virtualized (2 CPU cores)
Subbenchmarks Festplatte (lokal)
normalized
0.6 0.8 1.0 1.2 1.4
Figure 3: Sub-benchmark results for local disk access of the
Passmark Disk Mark metric.
●
●
●
●
●
●
●
●
●
●
●
●
●
●
●
●
●
●
●
●
●
●
●
●
●
●
●
●
●
●
●
●
●
●
●
●
●
●
●
●
●
●
●
●
●
●
●
●
●
●
●
●
●
●
●
●
●
●
●
●
●
●
●
●
●
●
●
●
●
●
●
●
●
●
●
●
●
●
●
●
●
●
●
●
●
●
●
●
●
●
●
●
●
●
●
●
●
●
●
●
●
●
●
●
●
●
●
●
●
●
●
●
●
●
●
●
●
●
●
●
●
●
●
●
●
●
●
●
●
●
●
●
●
●
●
●
●
●
●
●
●
●
●
●
●
●
●
●
●
●
●
●
●
●
●●
●
●
●
●
●
●
●
●
●
●
●
●
●
●
●
●
●
●
840 860 880 900 920 940
VMs
CPU Mark Rating
1 2 3 4 5 6 7 8 9 10 11 12 13 14 15 16 17 18 19 20 21 22 23 24
(a)
●
●
●
●
●
●
●
●
●
●
●
●
●
●
●
●●
●
●
●
●
●
●
●
●
●
●
●
●
●
●
●
●
●
●
●
●
●
●
●
●
●
●
●
●
●
●
●
●
●
●
●
●
●
●
●
●
●
●
●
●
●
●
●
●
●
●
●
●
●
●●
●
●
●
●
●
●
●
●
●
●
●
●
●
●
●
●
●
●
●
●
●
●
●
●
●
●
●
●
●
●
●
●
●
●
●
●
●
●
●
●
●
●
●
●
●
●
●
●
●
●
●
●●
●
●
●
●
●
●
●
●
●
●
●
●
●
●
●
●
●
●
●
●
●
●
●
●
●
●
●
●●
●
●
●
●
●
●
●
800 850 900 950
VMs
CPU Mark Rating
1 2 3 4 5 6 7 8 9 10 11 12 13 14 15 16 17 18 19 20 21 22 23 24
(b)
Figure 4: CPU benchmark results for 24 VMs executed
without (a) and with (b) core affinity.
affinity improves performance. Figure 4(a) shows
the boxplot of 24 VMs simultaneously executing the
CPU benchmark without core affinity. There are
clearly two categories of VMs, one category (1, 11-
19) performing significantly different from the other
(2-10, 20-24). This behavior is not observed with
core affinity (see Figure 4(b)), when each VM is exe-
cuted on a separate physical core. This indicates that
XenServer’s scheduler does not distribute the VMs on
the cores equally. In general, it demonstrates that mul-
ticore environments still are a challenge for hypervi-
sor schedulers. In Section 3, we investigate if this
effect is observable on other hypervisor architectures,
too.
With core affinity enabled, for scalability and
overcommitment the performance drops linear with
the scaled amount of VMs and inversely proportional
to the overcommitment factor, respectively. For ex-
ample, assume c is the amount of physical cores.
If provisioning x · c amount of virtual CPUs, perfor-
mance roughly drops by
1
x
in each of our experimental
environments (single core, dual core, 24 cores).
Network I/O. We conducted further experiments
with the network I/O benchmark Iperf to gain more
insight on the performance overhead of XenServer’s
credit-based scheduler and its performance isolation.
More precisely, the goal of these experiments was to
demonstrate how the additional overhead introduced
by the hypervisor to handle I/O requests is distributed
among the running VMs. To this end, we executed
four VMs, two VMs running CPU Mark and two VMs
with Iperf. We pinned them pairwise on two physical
cores, i.e., core c
0
executed a pair of the CPU VM
and Iperf VM and a different available core c
x
the
other pair. The CPU benchmark was executed on both
VMs, simultaneously and the network I/O benchmark
was started separately on one VM. This symmetric
setup allows us to compare the results of VMs exe-
cuted on c
0
(where the Dom0 is executed) with the
results on the different core
x
.
+
+
+
+
+
+
+
+
+
+
+
+
+
+
+
+
+
+
+
+
+
+
+
+
+
+
+
+
+
+
+
+
+
+
+
+
+
+
+
+
+
+
+
+
+
+
+
+
+
+
+
+
+
+
+
+
+
+
+
+
+
+
+
+
++
++
+
+
+
+
+
+
+
+
+
+
+
+
+
+
+
+
+
+
+
+
+
+
+
+
+
+
+
+
+
+
+
+
0 20 40 60 80 100
400 500 600 700 800 900
Network I/O performance effects
# Measurement
CPU Mark Rating
o
o
o
o
o
o
o
o
o
o
o
o
o
o
o
o
o
o
o
o
o
o
o
o
o
o
o
o
o
o
o
o
o
o
o
o
o
o
o
o
o
o
o
o
o
o
o
o
o
o
o
o
o
o
o
o
o
o
o
o
o
o
o
o
o
o
o
o
o
o
o
o
o
o
o
o
o
o
o
o
o
o
o
o
o
o
o
o
o
o
oo
o
o
o
o
o
o
o
o
+
o
cpu mark measurements on core
x
cpu mark measurements on core
0
Figure 5: CPU benchmark results of two VMs executed on
core
0
and core
x
when network I/O is received by the VM
running on core
x
.
One would expect that there is no performance ef-
fect on the VMs running on c
0
when the Iperf VM on
c
x
executes network I/O. However, the results show
EVALUATING AND MODELING VIRTUALIZATION PERFORMANCE OVERHEAD FOR CLOUD
ENVIRONMENTS
567

Table 1: Mutual performance degradation for different workload types on Citrix XenServer 5.5.
V M
A
CPU CPU Mem CPU Mem Disk CPU Mem Disk
V M
B
CPU Mem Mem Disk Disk Disk Net Net Net
r
A
46.71% 50.64% 50.33% 23.35% 24.82% 31.16% 52.88% 52.85% 3.07%
r
B
52.44% 45.93% 49.04% 1.49% -0.09% 45.99% 40.46% 42.18% 33.31%
that the performance of the VM running the CPU
benchmark on c
0
drops up to 13% when the VM on
c
x
is executing the network I/O benchmark. Figure 5
depicts the CPU benchmark results of VMs executed
on core
0
(o) and core
x
(+). The second VM on core
x
receives the network load, hence the benchmark rat-
ing of the VM sharing this core drops significantly.
But also the benchmark rating of the VM on core
0
drops, although its paired VM is idle. Because VMs
executed on other cores than c
0
did not exhibit this
behavior, this indicates that Dom0 mainly uses c
0
to
handle I/O. This causes a slight performance drop for
VMs simultaneously executed on c
0
, i.e., about 1% on
average. However, this drop could further increase if
further machines on other cores receive network load.
We did not execute these scalability experiments as
this would require further network interfaces to gen-
erate network load on further Iperf VMs. However,
this is an interesting question for future work as well
as the question if this effect can be observed on other
hypervisors too, which will be discussed in the fol-
lowing section.
Mutual Influences of Workload Types. Target of
these experiments is to identify the mutual influences
of VMs sharing their resources and serving different
workload types. To this end, we pinned two VMs
V M
A
and V M
B
on the same physical core other then
core
0
to avoid interferences with Dom0. Then, we
ran an experiment for each possible combination of
benchmark types. As a result, we calculate the rel-
ative performance drop as r = 1 − (r
i
/r
s
), where r
i
is the interference result and r
s
the result measured
when executing the benchmark on an isolated VM.
Table 1 summarizes the results for all combinations
of workload types. Note that we did not run network
vs. network experiments because a different hardware
environment with additional hardware would have
been required.
The results show that there are no significant mu-
tual influences of CPU and memory intensive work-
loads. The performance drop for both benchmarks
is reasonably equal and the drop also fits the expec-
tation that each VM receives only half of its perfor-
mance compared to isolated execution. Explanations
are the similarity of both workload types in terms of
the used resources (memory benchmarks require CPU
as well) and the hardware support for CPU virtual-
ization. An interesting observation is that the Disk
benchmark is not influenced by other workload types
except of when executed vs. the disk benchmark. This
indicates that on Citrix XenServer 5.5, disk intensive
workloads do not compete for resources of CPU and
memory intensive workloads. This can be explained
with the similar reason as for the virtualization over-
head of the Disk mark result: the concept used in Cit-
rix XenServer 5.5 for block oriented read and write to
minimize administration overhead. With this concept,
disk workload can be passed through without requir-
ing major hypervisor intervention.
3 EVALUATION
To evaluate the validity of the conclusions from our
analysis of XenServer on other hypervisor architec-
tures, we conducted the same experiments on an-
other popular industry standard platform, VMware
ESX 4.0, which has a different type of hypervisor ar-
chitecture. This section compares the experiment re-
sults of both platforms. We also provide a short ex-
perience report on the portability of the automated
experimental analysis approach, which is of general
interest when migrating from one virtualization plat-
form to another as well as for automatic administra-
tion of virtualization platforms.
3.1 Platform Comparison
The following discussion and comparison of the re-
sults of our measurements on VMware ESX 4.0 has
a similar structure as Section 2.5. However, because
of unavailable driver support for the HP Compaq ma-
chine (see Section 3.2), we were only able to install
VMware ESX 4.0 and to conduct our experiments on
the SunFire machine.
Overhead of Virtualization. After repeating the
experiments on VMware ESX 4.0, we calculate
the relative delta between the two platforms as
V MwareESX 4.0 − CitrixXenServer 5.5
V MwareESX 4.0
. The results in Ta-
ble 2 show almost identical results for the CPU and
memory benchmarks because both virtualization plat-
CLOSER 2011 - International Conference on Cloud Computing and Services Science
568
forms use the hardware virtualization support. How-
ever, for the I/O benchmarks, VMware ESX 4.0 per-
forms better. The reason for this is that in Citrix
XenServer 5.5, all I/O workload is handled by the
separate driver domain Dom0, which is less efficient
monolithic architecture of VMware ESX 4.0. Hence,
it is important to distinguish these architectural differ-
ences when generalizing the results for the I/O perfor-
mance overhead.
Table 2: Relative deviation of CPU, memory, disk I/O and
network I/O benchmark results.
Benchmark rel. Delta
CPU Mark 0.15%
Memory Mark 0.19%
Disk Mark 19.14%
Iperf, outgoing 13.91%
Iperf, incoming 15.94%
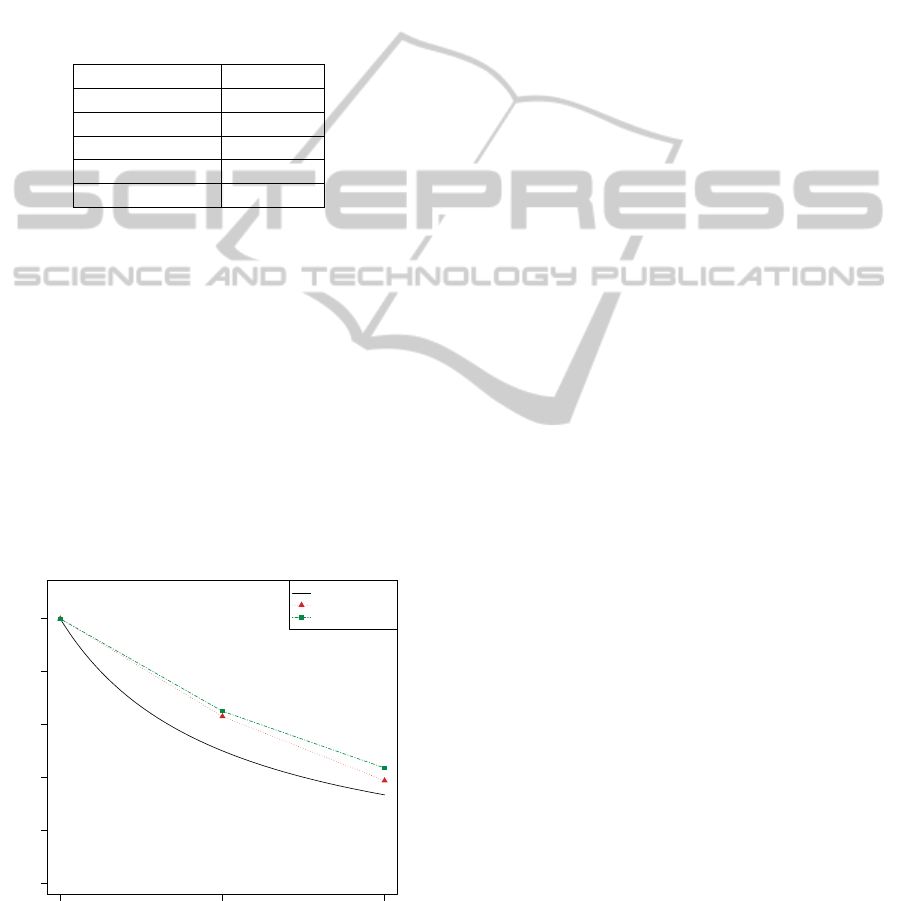
Scalability and Overcommitment. Concerning
the performance behavior of VMware ESX 4.0
when scaling up and overcommitting, respectively,
we observe a similar trend to the one on Citrix
XenServer 5.5. Figure 6 shows this trend for the over-
commitment scenario. As one can see, both platforms
behave similarly. The results for scalability are simi-
lar with VMware ESX 4.0 performing slightly better.
Another observation was that on VMware ESX 4.0,
using core affinity did not result in any performance
improvements. This indicates an improved hypervi-
sor scheduling strategy which takes care of multicore
environments and the cache and core effects observed
in Section 2.5.
0.0 0.2 0.4 0.6 0.8 1.0
Overcommitment factor
CPU Mark Rating (nomralized)
Hypothesis (1/x)
XenServer
vSphere
CPU overcommitment
1 2 3
Figure 6: Performance behavior for CPU overcommitment
for Citrix XenServer 5.5 and VMware ESX 4.0.
Network I/O. Analyzing the results of the network
I/O experiments repeated on VMware ESX 4.0 shows
some further advantages of the monolithic architec-
ture and that the concept of a separate management
VM (Dom0) has a slight performance drawback. For
example, we did not observe the effect of the Dom0
discussed in Section 3.1 (Network I/O). Hence, on
VMware ESX 4.0, the additional overhead for I/O vir-
tualization is distributed more evenly than in Citrix
XenServer 5.5.
Mutual Influences of Workload Types. We re-
peated the same experiments to determine the mutual
influences of workload types on VMware ESX 4.0.
Table 3 lists the results. For CPU and memory in-
tensive workloads, the observations are comparable
to the ones for Citrix XenServer 5.5: both workload
types have a similar effect on each other caused by
their similarities.
However, there is a big difference to Citrix
XenServer 5.5 for disk intensive workload. For
VMware ESX 4.0, we observe a high performance
degradation of the disk workload independent of the
other workload type. For example, if the disk bench-
mark is executed with CPU or memory benchmark,
disk benchmark results drop almost 50%, whereas
CPU and memory benchmark results suffer from only
10% and 20% performance loss, respectively. One ex-
planation is that VMware’s virtual disk concept is dif-
ferent from Xen and in this concept both VMs com-
pete for CPU time assigned by the hypervisor, thus
confirming the differences in both hypervisor archi-
tectures. However, CPU and memory suffer from less
performance degradation when running against disk
workload than in Citrix XenServer 5.5.
3.2 Portability of the Automated
Analysis
The first problem when applying the automated ex-
perimental analysis approach to VMware ESX 4.0
was that we could not install it on the HP Compaq
machine because of the lack of driver support. Sup-
porting only commodity hardware keeps the mono-
lithic hypervisor’s footprint low. Because of Cit-
rix XenServer 5.5’s architecture, further drivers can
be easily implemented in the Dom0 domain while
still keeping the hypervisors footprint small. Hence,
we could not repeat the measurements for VMware
ESX 4.0 on the HP Compaq machine. The next chal-
lenge we faced was that the VMs of VMware ESX 4.0
are usually intended to be managed via graphical ex-
ternal tools, which hinders an automated approach.
Fortunately, a special command line interface, which
EVALUATING AND MODELING VIRTUALIZATION PERFORMANCE OVERHEAD FOR CLOUD
ENVIRONMENTS
569
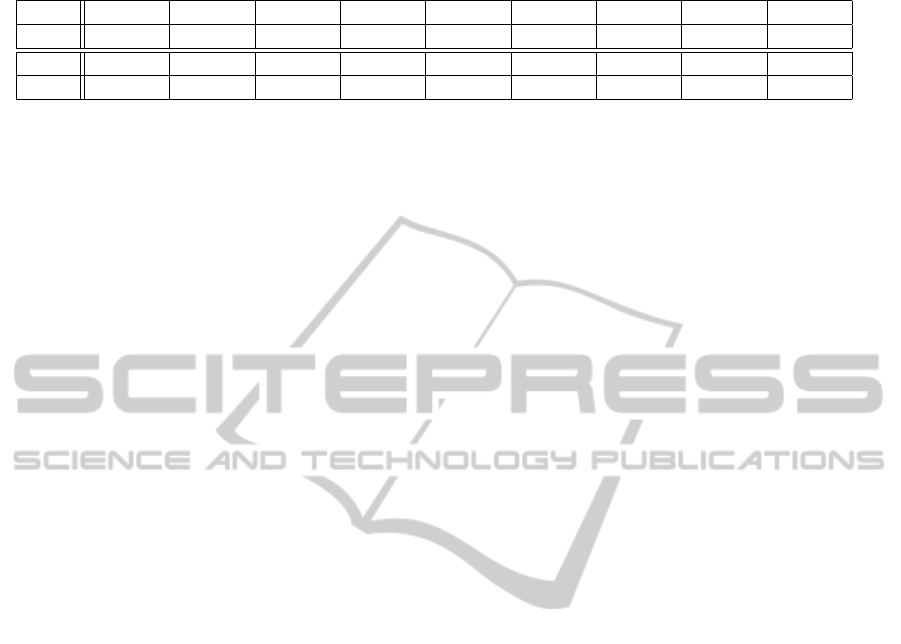
Table 3: Mutual performance degradation for different workload types on VMware ESX 4.0.
V M
A
CPU CPU Mem CPU Mem Disk CPU Mem Disk
V M
B
CPU Mem Mem Disk Disk Disk Net Net Net
r
A
47.03% 46.64% 49.23% 10.02% 17.21% 44.53% 9.95% 35.32% 14.87%
r
B
48.21% 40.29% 51.34% 49.56% 45.53% 44.82% 65.02% 54.56% 32.74%
must be activated separately, can be used for automa-
tion.
As both platforms support the Open Virtualization
Format (OVF) for virtual machines in theroy, port-
ing the MasterVM should be easy. Although this
standardized XML schema for OVF is in fact imple-
mented on both platforms, they use a different XML
tag semantic to describe the VM geometry (like its
partitions etc.). Hence, the export of a VM from
Citrix XenServer 5.5 to VMware ESX 4.0 works in
theory, but practically only with additional tools and
workarounds, involving manual XML editing.
Once migrated, one can reuse the concept of au-
tomated experimental analysis and experiment types,
but one has to adapt the scripts to the new API. For ex-
ample, the credit-based scheduler parameter capacity
is named differently on VMware ESX 4.0.
In summary, the concept itself is portable but re-
quires some manual adjustments. This mainly stems
from the fact that currently there is no standardized
and working virtual machine migration mechanism
across different virtualization platforms.
3.3 Summary
By migrating and repeating our automated analysis
to VMware ESX 4.0, we were able to confirm the
results for CPU and memory intensive workloads as
well as the observed trends in the scalability and over-
commitment scenarios. However, the experiments
also showed that there are differences when handling
I/O intensive workloads. In these scenarios, VMware
ESX 4.0’s performance behavior and performance
isolation is better. However, this product has high
licensing costs. Moreover, it is intended for graphi-
cal administration which makes automized adminis-
tration more difficult.
4 MODELING THE
PERFORMANCE-INFLUENCING
FACTORS
Having analyzed two major representative virtualiza-
tion platforms, we now structure the performance-
influencing factors and capture them in a basic math-
ematical performance model allowing one to predict
the performance impacts of virtualized environments.
4.1 Categorizing the
Performance-influencing Factors
This section categorizes the performance-influencing
factors of the presented virtualization platforms. The
goal is to provide a compact hierarchical model of
performance-relevant properties and their dependen-
cies. We capture those factors that have to be con-
sidered for performance predictions at the applica-
tion level, i.e., that have a considerable impact on the
virtualization platform’s performance, and we struc-
ture them in a so-called feature model (Czarnecki and
Eisenecker, 2000). In our context, a feature corre-
sponds to a performance-relevant property or a con-
figuration option of a virtualization platform. The
goal of the feature model is to capture the options that
have an influence on the performance of the virtual-
ization platform in a hierarchical structure. The fea-
ture model should also consider external influencing
factors such as workload profile or type of hardware.
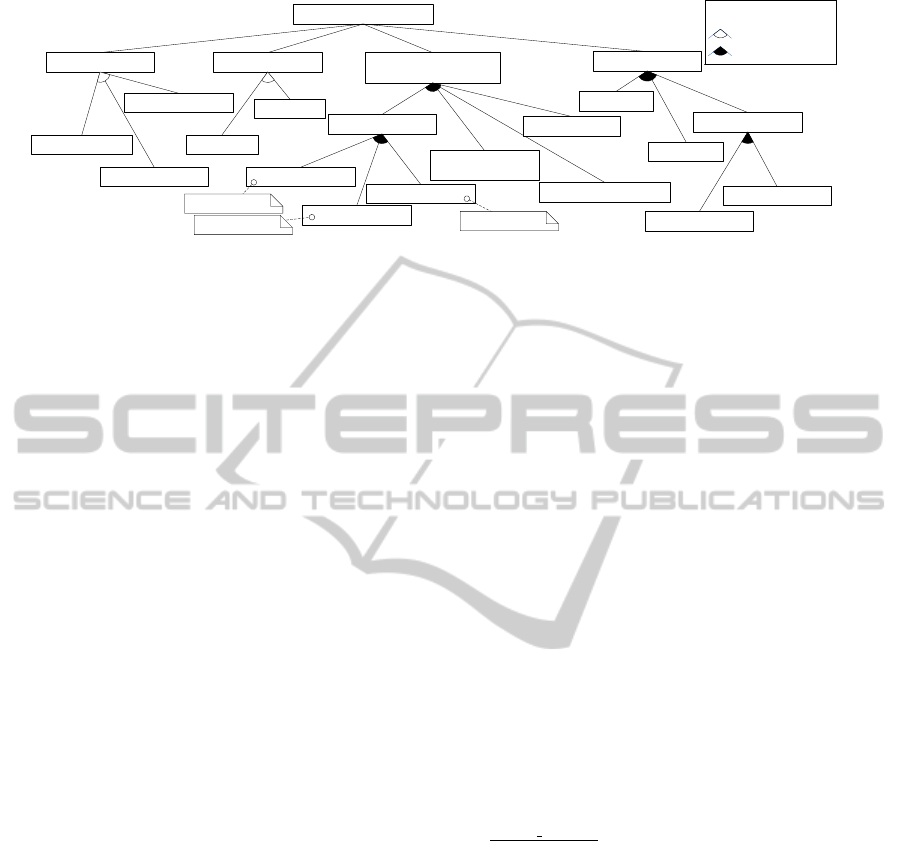
The model we propose is depicted in Figure 7.
The first performance-influencing factor is the vir-
tualization type. Different techniques might cause
different performance overhead, e.g., full virtualiza-
tion performs better than other alternatives because of
the hardware support. In our feature model, we distin-
guish between the three types of virtualization: i) full
virtualization, ii) para-virtualization and iii) binary
translation. Furthermore, our experiments showed,
that another important performance-influencing fac-
tor is the hypervisor’s architecture. For example, a
monolithic architecture exhibited better performance
isolation.
Several influencing factors are grouped under re-
source management configuration. First, the CPU
scheduling configuration has a significant influence
on the virtualization platform’s performance and is
influenced by several factors. The first factor CPU
allocation reflects the number of virtual CPUs allo-
cated to a VM. Most of the performance loss of CPU
intensive workloads comes from core and cache infer-
ences (Apparao et al., 2008). Hence, the second factor
is core affinity, specifying if virtual CPUs of VMs are
assigned to dedicated physical cores (core-pinning).
CLOSER 2011 - International Conference on Cloud Computing and Services Science
570
Virtualization Platform
Binary Translation
Para-Virtualization
Full Virtualization
Virtualization Type
exclusive OR
Legend
inclusive OR
Resource Management
Configuration
CPU Scheduling
CPU Allocation
Core Affinity
Workload Profile
I/O
CPU
Memory
Network
Disk
CPU Priority
Memory Allocation
Number of VMs
Resource
Overcommitment
VMM Architecture
Dom0
Monolitic
e.g. cap=50
e.g. mask=1,2
e.g. vcpu=4
Figure 7: Major performance-influencing factors of virtualization platforms.
The third factor reflects the capability of assigning
different CPU priorities to the VMs. For example,
the Xen hypervisor’s cap parameter or VMware’s lim-
its and fixed reservations parameters are CPU pri-
ority configurations. In addition, the level of re-
source overcommitment influences the performance
due to contention effects caused by resource shar-
ing. Finally, the memory allocation and the number
of VMs influence the resource management config-
uration, too. Managing virtual memory requires an
additional management layer in the hypervisor. The
number of VMs has a direct effect on how the avail-
able resources are shared among all VMs.
Last but not least, an important influencing fac-
tor is the workload profile executed on the virtual-
ization platform. Virtualizing different types of re-
sources causes different performance overheads. For
example, CPU virtualization is supported very well
whereas I/O and memory virtualization currently suf-
fer from significant performance overheads. In our
model we distinguish CPU, memory and I/O intensive
workloads. In the case of I/O workload, we further
distinguish between disk and network intensive I/O
workloads. Of course, one can also imagine a work-
load mixture as a combination of the basic workload
types.
4.2 Performance Model
Based on the results of Section 2.5 and Section 3
we now propose a basic mathematical performance
prediction model (e.g., based on linear regression).
We focus on the performance-influencing factors for
which similar results were observed on the two virtu-
alization platforms considered. These are the over-
head for CPU and memory virtualization, the per-
formance behavior in scalability scenarios and the
performance behavior when overcommitting CPU re-
sources. Our model is intended to reflect the perfor-
mance influences of the factors presented in the previ-
ous section. It can be used to predict the performance
overhead for services to be deployed in, e.g., Cloud
Computing or virtualized environments in general.
In our experiments, performance is measured as
the amount of benchmark operations processed per
unit of time, i.e., the throughput of the system. This
is not directly transferable to system utilization or re-
sponse times, as the benchmarks always try to fully
utilize the available resources. Therefore, in the fol-
lowing, we refer to throughput as the system perfor-
mance. We calculate a performance overhead fac-
tor o which can be used to predict the performance
p
virtualized
= o · p
native
, where o can be replaced by a
formula of one of the following sections.
Overhead of Virtualization. The following basic
equations allow to predict the overhead introduced
when migrating a native system to a virtualized plat-
form. These equations assume that there are no influ-
ences by other virtual machines, which we consider
later below.
For CPU and memory virtualization, we cal-
culate the overhead factors o
cpu
and o
mem
as
1 −
relative deviation
100
using the measured relative devi-
ation values. One can use our automated approach
to determine these factors for any other virtualization
platform to derive more specific overhead factors.
For I/O overhead, we recommend to measure the
performance overhead for each specific virtualization
platform using our automated approach because the
evaluation showed that there are significant differ-
ences between different virtualization platforms and
their implementations, respectively.
Scalability. To model the performance-influence of
scaling-up CPU resources, we use a linear equation.
The performance overhead is defined as o
scal
= a +b ·
c
virt
, where c
virt
is the number of virtual cores. The
coefficients a and b are given in Table 4. We distin-
guish between scenarios without core affinity and sce-
narios, where the virtual CPUs are pinned to the phys-
EVALUATING AND MODELING VIRTUALIZATION PERFORMANCE OVERHEAD FOR CLOUD
ENVIRONMENTS
571

ical cores in an equal distribution. These equations
give an approximation of the performance degrada-
tion when scaling-up which is independent of the vir-
tualization platform. However, this approximation
is only valid until you reach the amount of physi-
cal cores available. The overcommitment scenario is
modeled in the next section. Moreover, the coeffi-
cients of determination show that the linear trend fits
very well, except for the CPU with affinity scenario.
Table 4: Coefficients a, b for the linear equations for CPU
and memory performance when scaling-up and the corre-
sponding coefficient of determination.
Scenario a b R
2
CPU 1.008 -0.0055 0.9957
Memory 1.007 -0.0179 0.9924
CPU (w. affinity) 1.003 -0.0018 0.7851
Memory (w. affinity) 1.002 -0.0120 0.9842
Overcommitment. When considering a scenario
with overcommitted CPU resources, we can approxi-
mate the performance overhead as o
overc
=
1
x
, where
x is the overcommitment factor. The overcommit-
ment factor is determined by
c
virt
c
phy
, the ratio of the
provisioned virtual cores c
virt
and available physical
cores c
phy
. Note that for CPU overcommitment this
dependency between the performance overhead and
the overcommitment factor is independent of the vir-
tualization platform and the amount of executed VMs.
Our experiments on two leading industry standard
virtualization platforms demonstrated that the perfor-
mance overhead simply depends on the ratio of virtual
and physical cores. This dependency is valid at the
core level, i.e., if you pin two VMs with one virtual
core each on a single physical core, you experience
the same performance drop.
5 RELATED WORK
There are two groups of existing work related to
the work presented in this paper. The first group
deals with benchmarking and performance analysis
of virtualization platforms and solutions. The second
group is related to this work in terms of modeling the
performance-influencing factors.
(Barham et al., 2003) present the Xen hypervisor
and compare its performance to a native system, the
VMware workstation 3.2 and a User-Mode Linux at
a high level of abstraction. They show that the per-
formance is practically equivalent to a native Linux
system and state that the Xen hypervisor is very scal-
able. (Qu
´
etier et al., 2007; Soltesz et al., 2007; Padala
et al., 2007) follow similar approaches by bench-
marking, analyzing and comparing the properties of
Linux-VServer 1.29, Xen 2.0, User-Mode Linux ker-
nel 2.6.7, VMware Workstation 3.2. and OpenVZ,
another container-based virtualization solution. (Ap-
parao et al., 2008) analyze the performance charac-
teristic of a server consolidation workload. Their re-
sults show that most of the performance loss of CPU
intensive workloads is caused by cache and core in-
terferences. However, since the publication of these
results, the considered virtualization platforms have
changed a lot (e.g., hardware support was introduced)
which renders the results outdated. Hence, the results
of these works must be revised especially to evaluate
the influences of, e.g., hardware support. Moreover,
the previous work mentioned above does not come up
with a model of the performance-influencing factors
nor does it propose a systematic approach to quan-
tify their impact automatically. Such a generic frame-
work to conduct performance analyses is presented in
(Westermann et al., 2010). This framework allows
adding adapters to benchmark, monitor, and analyze
the performance of a system. The framework has
been applied to the performance analysis of message-
oriented middleware, however, the adapters currently
do not support the analysis of performance properties
of virtualization platforms or Cloud Computing envi-
ronments.
The second area of related work is the model-
ing of virtualization platforms or shared resources.
(Tickoo et al., 2009) identify the challenges of mod-
eling the contention of the visible and invisible re-
sources and the hypervisor. In their consecutive work
based on (Apparao et al., 2008; Tickoo et al., 2009),
(Iyer et al., 2009) measure and model the influences
of VM shared resources. They show the importance
of shared resource contention on virtual machine per-
formance and model cache and core effects, but no
other performance-influencing factors. Another in-
teresting approach to determine the performance in-
terference effects of virtualization based on bench-
marking is (Koh et al., 2007). They explicitly con-
sider different types of workloads (applications) and
develop performance prediction mechanisms for dif-
ferent combinations of workloads. Unfortunately, this
approach is neither automated nor evaluated on differ-
ent platforms.
6 CONCLUSIONS AND
OUTLOOK
In this paper, we conducted fine-grained experiments
and in-depth analyses of the Citrix XenServer 5.5
CLOSER 2011 - International Conference on Cloud Computing and Services Science
572

based on the results of (Huber et al., 2010). We mi-
grated this approach to VMware ESX 4.0 and eval-
uated the validity of the previous findings. In sum-
mary, the results showed that CPU and memory virtu-
alization performance behavior is similar on both sys-
tems as well as CPU scalability and overcommitment.
However, the results also indicated a deviation when
it comes to I/O virtualization and scheduling. In these
cases, VMware ESX 4.0 provides better performance
and performance isolation than Citrix XenServer 5.5.
We evaluated the portability of the automated experi-
mental analysis approach. Finally, we presented a ba-
sic model allowing to predict the performance when
migrating applications from native systems to virtual-
ized environments, for scaling up and overcommitting
CPU resources, or for migrating to a different virtual-
ization platform. As a next step, we plan to study the
performance overhead for mixed workload types and
their mutual performance influence in more detail. In
addition, we will use our model as a basis for future
work in the Descartes research project (Descartes Re-
search Group, 2010; Kounev et al., 2010). For exam-
ple, we will integrate our results in a meta model for
performance prediction of services deployed in dy-
namic virtualized environments, e.g., Cloud Comput-
ing.
ACKNOWLEDGEMENTS
This work was funded by the German Research Foun-
dation (DFG) under grant No. 3445/6-1.
REFERENCES
Apparao, P., Iyer, R., Zhang, X., Newell, D., and
Adelmeyer, T. (2008). Characterization & Analysis
of a Server Consolidation Benchmark. In VEE ’08.
Barham, P., Dragovic, B., Fraser, K., Hand, S., Harris, T.,
Ho, A., Neugebauer, R., Pratt, I., and Warfield, A.
(2003). Xen and the Art of Virtualization. In Sym-
posium on Operating Systems Principles.
Czarnecki, K. and Eisenecker, U. W. (2000). Generative
Programming. Addison-Wesley.
Descartes Research Group (2010). http://www.descartes-
research.net.
Huber, N., von Quast, M., Brosig, F., and Kounev, S.
(2010). Analysis of the Performance-Influencing Fac-
tors of Virtualization Platforms. In DOA’10.
IDC (2010). Virtualization Market Accelerates Out of the
Recession as Users Adopt ”Virtualize First” Men-
tality. http://www.idc.com/getdoc.jsp?containerId
=prUS22316610.
IT world, The IDG Network (2008). Gartner’s data
on energy consumption, virtualization, cloud.
http://www.itworld.com/green-it/59328/gartners-
data-energy-consumption-virtualization-cloud.
Iyer, R., Illikkal, R., Tickoo, O., Zhao, L., Apparao, P., and
Newell, D. (2009). VM3: Measuring, modeling and
managing VM shared resources. Computer Networks,
53(17):2873 – 2887.
Koh, Y., Knauerhase, R. C., Brett, P., Bowman, M., Wen,
Z., and Pu, C. (2007). An analysis of performance in-
terference effects in virtual environments. In ISPASS.
Kounev, S., Brosig, F., Huber, N., and Reussner, R. (2010).
Towards self-aware performance and resource man-
agement in modern service-oriented systems. In Int.
Conf. on Services Computing.
Menasc
´
e, D. A., Almeida, V. A. F., and Dowdy, L. W.
(1994). Capacity Planning and Performance Model-
ing - From Mainframes to Client-Server Systems.
Padala, P., Zhu, X., Wang, Z., Singhal, S., and Shin, K. G.
(2007). Performance evaluation of virtualization tech-
nologies for server consolidation. HP Labs Tec. Re-
port.
Qu
´
etier, B., N
´
eri, V., and Cappello, F. (2007). Scalability
Comparison of Four Host Virtualization Tools. Jounal
on Grid Computing, 5(1):83–98.
Rosenblum, M. and Garfinkel, T. (2005). Virtual machine
monitors: current technology and future trends. Com-
puter, 38(5):39–47.
Salsburg, M. (2007). Beyond the Hypervisor Hype. In
CMG-CONFERENCE, volume 2, page 487.
Soltesz, S., P
¨
otzl, H., Fiuczynski, M. E., Bavier, A., and
Peterson, L. (2007). Container-based operating sys-
tem virtualization: a scalable, high-performance al-
ternative to hypervisors. SIGOPS Oper. Syst. Rev.,
41(3):275–287.
Tickoo, O., Iyer, R., Illikkal, R., and Newell, D. (2009).
Modeling virtual machine performance: Challenges
and approaches. In HotMetrics.
VMware (2007). A performance comparison of hy-
pervisors. http://www.vmware.com/pdf/hypervisor
performance.pdf.
Westermann, D., Happe, J., Hauck, M., and Heupel, C.
(2010). The Performance Cockpit Approach: A
Framework for Systematic Performance Evaluations.
In SEAA’10.
EVALUATING AND MODELING VIRTUALIZATION PERFORMANCE OVERHEAD FOR CLOUD
ENVIRONMENTS
573
