
COMBINING TWO LAZY LEARNING METHODS
FOR CLASSIFICATION AND KNOWLEDGE DISCOVERY
A Case Study for Malignant Melanoma Diagnosis
Eva Armengol
1
and Susana Puig
2
1
Artificial Intelligence Research Institute (IIIA-CSIC) Bellaterra, Catalonia, Spain
2
Melanoma Unit, Dermatology Department, IDIBAPS, UT26 CIBERER, ISCIII
Hospital Cl
´
ınic i Provincial de Barcelona, Barcelona, Spain
Keywords:
Machine learning, Lazy learning methods, Knowledge discovery, Classification, Medical diagnosis.
Abstract:
The goal of this paper is to construct a classifier for diagnosing malignant melanoma. We experimented with
two lazy learning methods, k-NN and LID, and compared their results with the ones produced by decision trees.
We performed this comparison because we are also interested on building a domain model that can serve as
basis to dermatologists to propose a good characterization of early melanomas. We shown that lazy learning
methods have a better performance than decision trees in terms of sensitivity and specificity. We have seen
that both lazy learning methods produce complementary results (k-NN has high specificity and LID has high
sensitivity) suggesting that a combination of both could be a good classifier. We report experiments confirming
this point. Concerning the construction of a domain model, we propose to use the explanations provided by
the lazy learning methods, and we see that the resulting theory is as predictive and useful as the one obtained
from decision trees.
1 INTRODUCTION
The malignant melanoma (MM) is the second most
frequent kind of cancer among people between 15 and
34 years old. In the last thirty years the incidence
of MM has been increased more rapidly than other
kinds of cancer. Many studies show that an early de-
tection of MM increases the survival rate since when
tumors are thin the lesion can be excised and the sur-
vival is around the 95% after 5 years. However, when
the tumor has spread to the nodes the risk of metas-
tases increases and, thus the survival rate decreases.
The early diagnosis of melanoma is a difficult task
that dermatologist face every day. When a lesion is
suspicious of being a melanoma it is removed and the
final diagnosis is performed based on histopathology
criteria.
The clinical diagnosis of MM is based on the
ABCD rule that takes into account the asymmetry,
border irregularity, color and diameter of the lesion.
Although the ABCD rule has been proved to be effec-
tive for an early diagnosis, there are necessary more
accurate methods to correctly diagnose lesions that do
not present clear malignant characteristics. It is im-
portant that a dermatologist can detect suspicious skin
lesions during a clinical session, therefore it would
be very useful to have a clear and easy characteriza-
tion of MM in early stages. Dermoscopy is a non-
invasive technique introduced by dermatologists two
decades ago. This technique provides a more accurate
evaluation of skin lesions, and can therefore, avoid
the excision of lesions that are benign. Consequently,
dermatologists need to achieve a good dermatoscopic
classification of lesions prior to extraction (Puig et al.,
2007). In (Hofmann-Wellenhof et al., 2002) a classi-
fication of benign melanocytic lesions is suggested.
In (Argenziano et al., 2007) authors hypothesize that
dermoscopic classifications may be better than the
classical clinico pathological classifications of benign
melanocytic lesions (nevi). Dermoscopy improves ac-
curacy for the diagnosis of melanoma in nearly 25%.
However, some benign lesions may mimic melanoma
and some melanomas may be similar to benign le-
sions, consequently many unnecessary extractions are
produced. It is assessed of 30 lesions excised by
non-expert dermatologists only one of them is MM.
When dermatologists have high expertise, the ratio
decreases to one MM for each 4 excisions. The re-
flectance confocal microscopy is a new non-invasive
diagnostic technique that allows the visualization of
200
Armengol E. and Puig S..
COMBINING TWO LAZY LEARNING METHODS FOR CLASSIFICATION AND KNOWLEDGE DISCOVERY - A Case Study for Malignant Melanoma
Diagnosis.
DOI: 10.5220/0003652201920199
In Proceedings of the International Conference on Knowledge Discovery and Information Retrieval (KDIR-2011), pages 192-199
ISBN: 978-989-8425-79-9
Copyright
c
2011 SCITEPRESS (Science and Technology Publications, Lda.)

skin cells in vivo. This technique also increases the
accuracy of the experts’ diagnosis but even in the
hands of experts and in combination with dermoscopy
information, accuracy never reaches 100%.
Thus, we are especially interested on character-
izing skin lesions in the frontier of both malignant
and benignant lesions. In our experiments we used
descriptions of skins lesions that have already been
excised, i.e., they are lesions that dermatologists con-
sidered that could be malignant melanoma. However
some of them, after a histopathology analysis resulted
to be benignant. This means that they provide a good
set of suspicious lesions from which to generate a do-
main model able to discriminate between both malig-
nant and benignant lesions with similar characteris-
tics. We propose to take descriptions of known skin
lesions and to use a lazy learning method to obtain a
domain theory. Skin lesions are described using two
sets of features, dermatoscopic and confocal, and our
goal is to find a subset of features characterizing ma-
lignant lesions.
There are several works that automatically diag-
nose Malignant Melanoma. MELAFIND (medgadget
.com/archives/2005/08/melafind
system.html) is a de-
vice designed to determine whether skin moles and le-
sions are malignant. It uses a database of around 6000
already biopsied lesions to find similarities with a new
potentially malignant skin lesion. In (Vestergaard and
Menzies, 2008) there is an interesting comparison
of the performance of several automatic instruments
with human experts. The main conclusion of this
comparison is that there is not an automatic method
clearly outperforming human performace. All these
automatic instruments have a different goal than our
approach since they want to take the role of dermatol-
ogists and analyze and interpret an image of an skin
lesion in order to diagnose it. In our work, the goal is
not to diagnose from an image but from the interpreta-
tion of an image given by a dermatologist. In fact we
do not want to take the dematologist’s role but support
them in diagnosing a skin lesion.
In the present paper we introduce a classification
system that using lazy learning methods, is able to
recognize MM from similar benignant skin lesions.
The main goal is to minimize the number of MM di-
agnosed as benignant and to maximize the number
of MM correctly diagnosed, although we have to ac-
cept a reasonable number of false positives. In other
words, we want primarily to achieve a high sensitivity
and secondly we try to obtain a specificity as high as
possible.
In domains as the current one, it could be spe-
cially useful, in addition to classify a new problem, to
generate also some kind of explanation of the domain
model. Usual domain models are automatically build
using inductive learning methods (Mitchell, 1997)
that generalize the input data to generate a model
(or domain theory) that can be useful in the future
to classify unseen data. Inductive learning methods
can produce overgeneralization when solution classes
are not clearly separated. This means that, although
the model fits the known data, it fails in the classi-
fication of unseen objects. An example is the do-
main of predictive toxicology where from the descrip-
tion of carcinogen and non-carcinogen chemical com-
pounds, the goal is to find a model for carcinogene-
sis (Helma and Kramer, 2003). The difficulty in that
domain is that there are chemical compounds with
a very similar chemical structure with different car-
cinogenic activity. A similar situation occurs in the
characterization of skin lesions since early malignant
melanoma can share many characteristics with benig-
nant lesions and, therefore a dermatologist can easily
confuse them.
A different approach for classifying unseen exam-
ples is to use some lazy learning method (instance-
based, case-based reasoning, etc.). Thus, a new prob-
lem is classified as belonging to a class by assessing
its similarity with a set of known examples. Lazy
learning methods are good classifiers but they do not
produce explicit generalizations and therefore no do-
main knowledge can be build from them. Currently
there is a growing research line that focuses on ex-
plaining the result of lazy learning methods (see for
instance (Roth-Berghofer, 2004; Plaza et al., 2005)
and proceedings of the workshops on Explanation-
aware Computing held from 2004). In (Armengol,
2008) we pointed out that if we could generate some
explicit generalization of the classification process
from a lazy learning method, we could generate a do-
main theory. These generalizations could be seen as
local approximations and, by storing them, we should
have a model of the domain. Notice that this domain
theory is not complete, since it only describes some
areas of the problem space (those around the prob-
lems already solved). Consequently, explanations of
a lazy learning method could be used for knowledge
discovery. In some sense, this is the same idea of
explanation-based learning methods (Mitchell et al.,
1986) that generate domain rules from one example.
We experimented with two lazy learning methods:
the well known k-NN method and the LID method
(Armengol and Plaza, 2001). We compare their pre-
dictivity results with those produced using a decision
tree, and we show that the lazy methods have a better
performace than the decision tree also in terms of sen-
sitivity and specificity. From the experiments we also
constructed a domain theory that has been very use-
COMBINING TWO LAZY LEARNING METHODS FOR CLASSIFICATION AND KNOWLEDGE DISCOVERY - A
Case Study for Malignant Melanoma Diagnosis
201

ful to dermatologists in order to confirm a subset of
relevant features characterizing early MM. Unexpect-
edly, we have seen that both lazy methods, k-NN and
LID exhibit a performance almost complementary: k-
NN has a high specificity (i.e., no false positive) but a
low number of true positives (low sensitivity), in addi-
tion, it classifies many lesions as suspicious; LID has
a good level of sensitivity but its specificity is clearly
lower than the one of k-NN. These results suggest that
a combination of both methods could perform better,
i.e., to produce high specificity and high sensitivity.
In the current paper, we present the results of experi-
menting with a combination of both methods.
The paper is organized as follows. In sections 2
and 3 the lazy learning methods k-NN and LID are
described. Section 4 reports the experiments carried
out on a database of early melanomas and predictivity
of the methods is analyzed. Section 5 discuss about
how to perform knowledge discovery with lazy learn-
ing methods. Finally, there is a section with conclu-
sions and future work.
2 THE K-NN ALGORITHM
A common method for classification is the k nearest
neighbor (k-NN in short). This method is based on
the idea that similar objects have similar classifica-
tion. Given a training set S and a problem p to clas-
sify, the k-NN algorithm is composed of the following
steps:
• 1) To assess the distance between p and each one
of the elements of S;
• 2) To take the subset S
k
of S composed of the k
elements of S having the closest distance to p;
• 3) To classify p as belonging to the class of the
majority of elements in S
k
.
The key point of this algorithm is the distance
measure used to compare the objects. There are
several distances commonly used (for instance, Eu-
clidean, Minkowski, Mahalanobis, etc.) and the user
has to evaluate the most appropriate for the domain
at hand. Let us suppose that domain objects are de-
scribed as tuples of n attributes a
1
, . . . , a
n
. When the
values of these attributes are symbolic, the usual way
to assess the distance between two domain objects A
and B is D(a, b) =
∑
d(A.a
i
, B.a
i
), where A.a
i
and B.a
i
are the values that the attribute a
i
takes in A and B re-
spectively, and d(A.a
i
, B.a
i
) is defined as follows:
d(A.a
i
, B.a
i
) =
n
1 if A.a
i
= B.a
i
0 otherwise
Function
LID (p, S
D
i
, D
i
, C)
if stopping-condition(S
D
i
)
then return class(S
D
i
)
else f
d
:= Select-attribute (p, S
D
i
, C)
D
i+1
:= Add-attribute( f
d
, D
i
)
S
D
i+1
:= Discriminatory-set (D
i+1
, S
D
i
)
LID (p, S
D
i+1
, D
i+1
, C)
end-if
end-function
Figure 1: The LID algorithm: p is the problem to be solved,
D
i
is the similitude term, S
D
i
is the discriminatory set asso-
ciated with D
i
, C is the set of solution classes, class(S
D
i
) is
the class C
i
∈ C to which all elements in S
D
i
belong.
3 THE LAZY INDUCTION OF
DESCRIPTIONS METHOD
Lazy Induction of Descriptions (LID) is a lazy learning
method for classification tasks. LID determines which
are the most relevant attributes of a new problem and
searches in a case base for cases sharing these relevant
attributes. The problem is classified when LID finds a
set of relevant attributes whose values are shared by a
subset of cases all of them belonging to a same class.
The description formed by these relevant features is
called similitude term and the set of cases satisfying
the similitude term is called discriminatory set.
Given a problem for solving p, the LID algorithm
(Fig. 1) initializes D
0
as a description with no at-
tributes, the discriminatory set S
D
0
as the set of cases
satisfying D
0
, i.e., all the available cases, and C as the
set of solution classes into which the known cases are
classified. Let D
i
be the current similitude term and
S
D
i
be the set of all the cases satisfying D
i
. When the
stopping condition of LID is not satisfied, the next step
is to select an attribute for specializing D
i
.
The specialization of D
i
is achieved by adding at-
tributes to it. Given a set F of attributes candidate to
specialize D
i
, LID selects the most discriminatory at-
tribute in F using a distance measure. Such distance
is used to compare each partition P
f
induced on S
D
i
by an attribute f with the correct partition P
c
. The
correct partition has as many sets as solution classes.
Each attribute f ∈ F induces in S
D
i
a partition P
f
with
as many sets as the number of different values that f
takes in the cases contained in S
D
i
. Given a distance
measure ∆ and two attributes f and g inducing re-
spectively partitions P
f
and P
g
, we say that f is more
discriminatory than g iff ∆(P
f
, P
c
) < ∆(P
g
, P
c
). This
means that the partition P
f
is closer to the correct par-
tition than the partition P
g
.
Let f
d
be the most discriminatory attribute in F.
The specialization of D
i
defines a new similitude term
D
i+1
by adding to D
i
the attribute f
d
. The new simili-
KDIR 2011 - International Conference on Knowledge Discovery and Information Retrieval
202

tude term D
i+1
= D
i
∪ { f
d
} is satisfied by a subset of
cases in S
D
i
, namely S
D
i+1
. Next, LID is recursively
called with S
D
i+1
and D
i+1
. The recursive call of LID
has S
D
i+1
instead of S
D
i
because the cases that are not
satisfied by D
i+1
will not satisfy any further special-
ization. Notice that the specialization reduces the dis-
criminatory set at each step, i.e., we get a sequence
S
D
n
⊆ S
D
n−1
⊆ . . . ⊆ S
D
0
.
The selection of the most discriminatory attribute
is heuristically done using the LM distance (L
´
opez de
M
´
antaras, 1991) over the candidate attributes. Let us
recall its definition: Let X be a finite set of objects;
P = {P
1
, . . . , P
n
} be a partition of X in n sets; and
Q = {Q
1
, . . . , Q
m
} be a partition of X in m sets. The
LM distance between them is computed as follows:
LM(P , Q ) = 2 −
I(P ) + I(Q )
I(P ∩ Q )
where
I(P ) = −
n
∑
i=1
p
i
log
2
p
i
; p
i
=
|P
i
|
|X|
I(Q ) = −
m
∑
j=1
p
j
log
2
p
j
; p
j
=
|Q
j
|
|X|
I(P ∩ Q ) = −
n
∑
i=1
m
∑
j=1
p
i j
log
2
p
i j
; p
i j
=
|P
i
∩ Q
j
|
|X|
Given a partition P on a set X, I(P ) is the average
information of P and it measures the randomness of
the distribution of elements of X over the n classes of
the partition. The quantity represented by I(P ∩ Q ) is
the mutual average information of the intersection of
the partitions P and Q .
LID has two stopping situations: 1) all the cases in
the discriminatory set S
D
j
belong to the same solution
class C
i
, or 2) there is no attribute allowing the spe-
cialization of the similitude term. When the stopping
condition 1) is satisfied p is classified as belonging to
C
i
. When the stopping condition 2) is satisfied, S
D
j
contains cases from several classes; in such situation
the majority criteria is applied, and p is classified in
the class of the majority of cases in S
D
j
. The outcome
of LID is a class and the last similitude term, that jus-
tifies the proposed classification of the new problem.
4 EXPERIMENTS
We carried out experiments with a data base contain-
ing descriptions of 192 skin lesions, 50 of them are
malignant melanoma (MM) and 142 are benignant.
These lesions are described by 11 dermatoscopic at-
tributes and 22 confocal attributes. All attributes take
symbolic values although it is possible that some at-
tribute can have unknown value. We conducted 100
experiments, each one of them consisting on 1) the
random generation of a training set and a test set, and
2) the use of both k-NN and LID for classifying the ob-
jects in the test set. We prefer this kind of evaluation
instead of using 10-fold cross-validation because we
also want to analyze the performance of the methods
on training sets of different size. Thus the training set
size goes from 73 cases (the minimum one randomly
generated) to 164 cases (the maximum one randomly
generated) being the mean size of the 100 experiments
of 77 cases. We also compare the results with those
produced by decision trees generated using the J48
algorithm given in the Weka platform (Witten et al.,
1999).
Concerning the k-NN method, we experimented
with several values of k, i.e., 3, 5 and 7. From some
preliminary experiments we have seen that the best re-
sults are those produced taking k = 3. In fact, we saw
that the number of misclassifications is approximately
the same for all these values of k (around the 2.5%);
however the main difference is that higher values of
k produce highest number of multiple classifications.
For this reason, the results shown in the current paper
are those obtained using k = 3.
For each object in the test set the outcome may be
the following: one class (benign or MM) or a multi-
ple solution (i.e., both classes) meaning that the ob-
ject is suspicious since it satisfies descriptions of both
classes. Multiple solutions are produced by LID when
the final similitude term is satisfied by cases of both
classes. Despite of being k and odd number, the k-NN
method can also give multiple solutions. This hap-
pens when there are several cases having the same
distance to the problem p, since in this situation all
these cases are retrieved. For instance, let c
1
, c
2
, c
3
and c
4
be cases such that d(p, c
1
) = d
1
, d(p, c
2
) = d
2
and d(p, c
3
) = d(p, c
4
) = d
3
, although k = 3 the four
cases are retrieved as the most similar to p, therefore
it could be possible a tie between the two solution
classes.
We compare the predictivity of the methods us-
ing ROC curves (Fawcett, 2006). A ROC curve is
a technique for visualizing, organizing and selecting
classifiers based on their performance. This kind of
representation is specially useful when error costs are
not the same in all the classes. For instance, in our
domain is clearly worst to consider as benign a malig-
nant lesion that the inverse situation. The ROC curves
take into account the true positive rate (TPR) and the
false positive rate (FPR) for the comparison of meth-
COMBINING TWO LAZY LEARNING METHODS FOR CLASSIFICATION AND KNOWLEDGE DISCOVERY - A
Case Study for Malignant Melanoma Diagnosis
203

0
0,2
0,4
0,6
0,8
1
1,2
0 0,2 0,4 0,6 0,8 1 1,2
FPR
TPR
LID
k-NN
DT
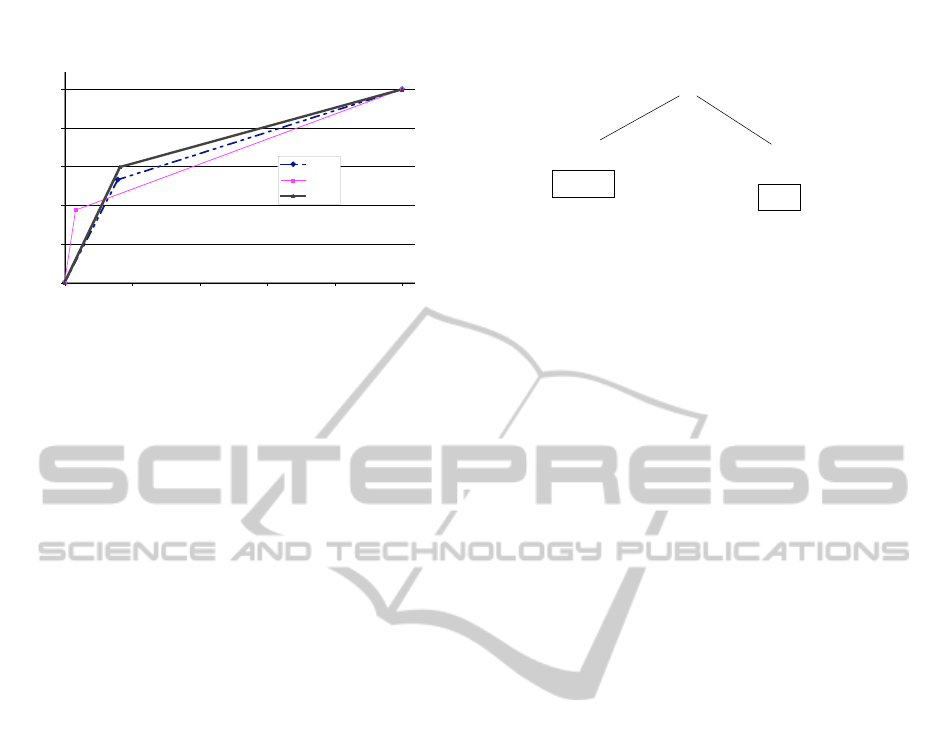
Figure 2: ROC curves corresponding to the 100 experiments
conducted with decision trees, k-NN and LID.
ods. These measures are calculated from the sensitiv-
ity (SE) and the specificity (SP), being
SP =
T N
T N+FP
SE =
T P
T P+F N
where T P stands for true positive, TN for true nega-
tive, FP for false positive, and FN for false negative.
The TPR is the sensitivity and the FPR is 1-SP.
One point (FPR, TPR) in the ROC space is bet-
ter than another if it is in the northwest part of the
graphic, i.e., if its TPR is higher, its FPR rate is lower,
or both. A classifier represented by a point in the di-
agonal means that it has a random behavior. Points
upper the diagonal means that the classifier exploits
some information from the data. Points down the di-
agonal means that the classifier performs worst than
a random classifier. Thus, a point is better than an-
other if TP is higher and FP is lower. Moreover,
given two points (FP
1
, T P
1
) and (FP
2
, T P
2
) such that
FP
1
< FP
2
and T P
1
< T P
2
the performance of the two
methods is incomparable and the cost of false posi-
tives has to be taken into account in order to choose
between them.
A common way to do this comparison is by means
of the calculation of the area under the ROC curve
(AUC). The range of AUC is the interval [0, 1], how-
ever, because the area corresponding to a random
classifier is 0.5, i.e., the area under the diagonal, the
AUC of a classifier should to be upper to 0.5. The
AUC of a classifier is equivalent to the probability
that the classifier will rank a randomly chosen posi-
tive instance higher than a randomly chosen negative
instance. See (Fawcett, 2006) for an excellent tutorial
on ROC curves.
For each one of the experiments (100 for each
method) we calculated the TPR and the FPR. Because
a lesion could be classified as suspicious (i.e., mul-
tiple classification), in the evaluation of the results
we do not taken into account multiple answers of the
methods. In other words, the sensitivity and speci-
ficity have been calculated taking into account only
the classifications in one (correct or incorrect) class.
The predictivity of decision trees is 76.47% and it
never classifies a lesion as suspicious (multiple clas-
sification). The k-NN produces around the 3% of sus-
picious lesions; and LID produces around the 1.5% of
suspicious lesions. The predictivity of the lazy meth-
ods is around 78% and around 74% for k-NN and LID
respectively.
The ROC curves present a different picture of the
performance of these methods (Fig. 2), since although
the lazy methods have lower predictivity than deci-
sion trees, they have better performance when analyz-
ing TP and FP. Thus we see that decision trees have
the lowest rate of true positives, meaning that the high
accuracy comes from the correct prediction of benign
lesions. ROC curves also show that k-NN has low
FPR, meaning that when it classifies a lesion as MM
it never fails, i.e., never classifies a benign lesion as
MM. Concerning LID it has a performance in the mid-
dle of the other methods: it is the method that captures
the highest number of MM, but it is also the method
producing the highest number of false positives. Table
1 shows the average of the 100 experiments in terms
of TPR and FPR. When using AUC to compare the
performance of the methods, we see that the best one
is LID although both methods clearly outperform de-
cision trees.
In fact, we would like to have a classifier with the
TPR of LID and the specificity of k-NN. For this rea-
son we combined both methods in a single classifier
using the following rule (say R1):
1. if k-NN classifies as MM then return MM
2. if LID classifies as MM then return MM
3. otherwise return benign
The last row of Table 1 shows the average of 100
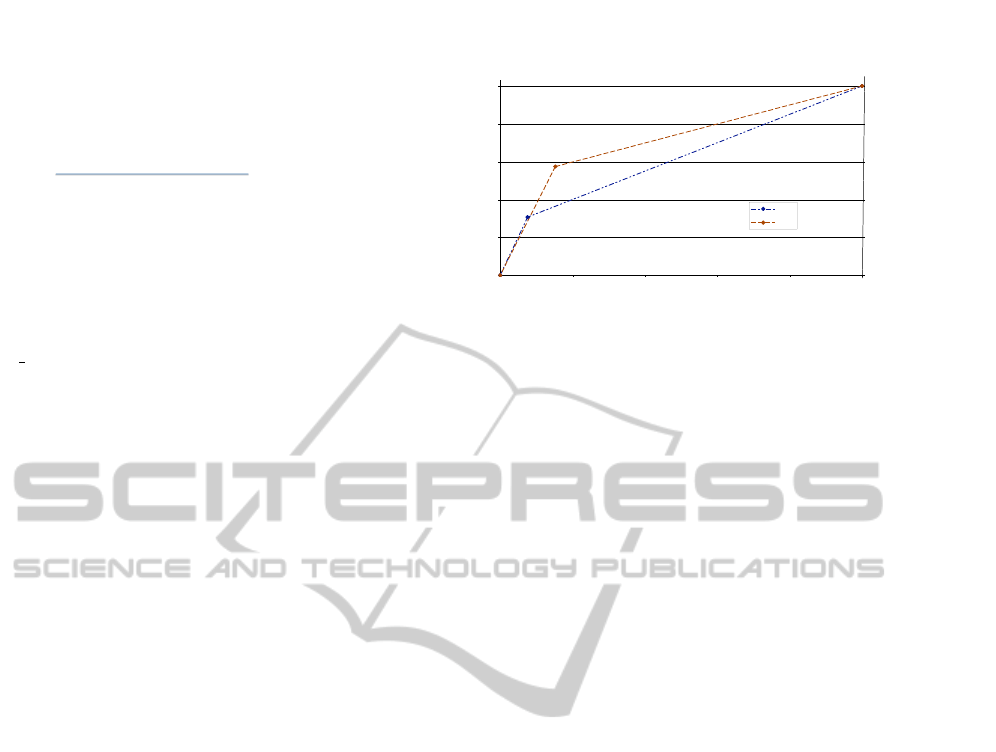
experiments using the rule R1 and Fig. 3 shows the
ROC curves comparing k-NN, LID and R1. We see
that the rule R1 produces a TP rate improving the
ones produced by both k-NN and LID. Our explana-
tion of this fact, especially for the improvement with
respect to LID, is that both methods characterize dif-
ferent kinds of MM. Currently, the experts are in-
specting the results in more detail. However, the per-
formance of R1 concerning FPR is near to the one
Table 1: Summary of the results produced by the methods
after averaging 100 random experiments.
Method Accuracy TPR FPR AUC
DT 76.4665 0.3076 0.0756 0.6160
LID 74.4008 0.5326 0.1574 0.6876
k-NN 78.6500 0.3750 0.0325 0.6712
R1 76.6991 0.5973 0.1638 0.7167
KDIR 2011 - International Conference on Knowledge Discovery and Information Retrieval
204
0
0,2
0,4
0,6
0,8
1
1,2
0 0,2 0,4 0,6 0,8 1 1,2
FPR
TPR
LID
k-NN
R1
Figure 3: ROC curves comparing the results of k-NN, LID,
and the combination of both methods given by the rule R1.
of LID than to the one of k-NN. We need to conduct
more experiments trying different combinations of the
methods. Comparing the AUC of the methods we see
that the classifier produced using R1 is the best one.
Concerning the size of the training set, we do not
detect any correlation with the accuracy of the lazy
learning methods. Thus, some experiments with a
large training set, say over 100 objects, have lower
accuracy than some experiments with smaller train-
ing sets. The same occurs with the decision trees. We
think that this result is due to the particularities of the
domain, since very similar skin lesions may have a
very different diagnose.
5 EXPERIMENTING WITH LID
FOR KNOWLEDGE
DISCOVERY
The similitude term generated by LID can be inter-
preted as a partial discriminant description of C
i
since
all the cases satisfying the similitude term belong to C
i
(according to one of the stopping conditions of LID).
Therefore, the similitude term can be used as a gen-
eralization of knowledge in the sense of either PRO-
TOS (Bareiss et al., 1988), EBL or inductive learn-
ing methods. In (Armengol, 2008) the domain theory
constructed using similitude terms was analyzed. In
the present study we use the same idea to generate
a lazy domain theory characterizing skin lesions. In
this way, we can take benefit from the classification
power of lazy learning methods and, in addition, to
give the experts a basis to formulate a domain model
to support the early diagnosis of MM.
We conducted 70 experiments to generate a do-
main model from the training sets, and then this
model was analyzed and compared to the one pro-
duced by decision trees. Given a training set T , we
Grade = 3
PG_form= dendritic
PG_form=
dendritic
roundish
Benign
MM
Figure 4: Two rules generated by LID: one for the benignant
class and another for the MM class. We represented them in
a tree form, however there is not any kind of neither order
nor preference between the attributes.
use LID with leave-one-out to classify each one of the
objects of T. When the object has been correctly clas-
sified into a class C
j
, the similitude term justifying the
classification is stored as a correct description for C
j
.
At the end of this process we have a lazy domain the-
ory to predict the classification of the objects belong-
ing to the test set.
The results of these experiments show that the do-
main theories generated by LID contain more rules
than the theories generated by decision trees. In fact,
it has overfitting because there are a lot of class de-
scriptions satisfied by only one object of the training
set. Particularly, LID produces a high number of dis-
criminant descriptions for the class benign and only
a few for the class MM. Independently on the size of
the training sets, there are subsets of class descriptions
that, with little differences, appear in all the experi-
ments. This means that the LID theory is able to rec-
ognize both malignant and benignant skin lesions that
follow the expected regular patterns. For instance, as
it is well known by dermatologists, most of MM have
pagetoid infiltrations whereas most of benignant le-
sions do not. Nevertheless, some benignant lesions
can present pagetoid infiltration (they are suspicious
lesions that are commonly excised and, after biopsy,
they are classified as benignant) and some early MM
still not present pagetoid infiltration (they are false
negatives). For this reason, we specially focused on
the descriptions of the lazy theories for the benignant
class with some of the attributes related with having
pagetoid infiltration. Figure 4 shows two of the rules
generated by LID, both related with having pagetoid
infiltration of grade 3. One of the rules states that a
lesion is benignant because of, in addition to having
infiltration of grade 3, the form of the pagetoid cells is
dendritic. The other rule states that a lesion is a MM
because it has infiltration of grade 3 and the pagetoid
cells are of two types: dendritic and roundish. In fact,
experts know that the presence of roundish pagetoid
cells is indicative of MM.
Figure 5 shows two decision trees: one of them
involves the attribute pagetoid-infiltration and it is
COMBINING TWO LAZY LEARNING METHODS FOR CLASSIFICATION AND KNOWLEDGE DISCOVERY - A
Case Study for Malignant Melanoma Diagnosis
205
!"#$%&'()'*+,%-".&*/0/1$2/
3///456'--$#7,"-/0/89/:$*'#*/;<=>?@A=BBC/
3///456'--$#7,"-/0/A9/DD/;>=?E@A=FGC/
!"#$%&'()'*+,%-".&*/0/*&9/:$*'#*/;FG=EA@G=8C/
/
H7*2I$$%,'J$)K$,,2/0/89/:$*'#*/;EE=G?@AE=B?C/
H7*2I$$%,'J$)K$,,2/0/A9/DD/;?=EE@8=G>C/
Figure 5: Decision trees generated by the J48 algorithm.
according with the dermatologist’s knowledge since
most of lesions with an irregular dermal papilla
(DP irregular = 1) having pagetoid infiltration are
MM. The other decision tree involves only the at-
tribute junsheetlike-cells that represents the presence
or absence of atypical cells arranged in sheet-like
structures visualized in superficial papillary dermis.
This kind of cells is an indicative of MM. Due to the
pruning process of the algorithm J48, class descrip-
tions are not discriminatory, nevertheless the predic-
tivity of the theory is around 75% and it never clas-
sifies a lesion as suspicious. Instead, using the lazy
domain theory generated by LID, a lesion may be clas-
sified as suspicious (around a 12% of times) or even
it may not be classified (around a 20% of times). The
predictivity of the lazy theory is around 55%.
Figure 6 shows the ROC curves generated using
the average of TPR and FPR of the 70 random ex-
periments we performed with both LID and decision
trees. From this graphic we see that the theory gen-
erated with LID has a higher rate of TP than the one
generated with the decision tree. However, LID also
produces a higher rate of FP than decision trees. The
AUC of the methods is 0.6160 and 0.677 for deci-
sion trees and LID respectively. Thus, the AUC shows
that, although the mean predictivity of the LID theory
is lower than the one produced by the decision tree, it
has better performance when analyzing TP and FP. In
particular, the LID theory produces the highest num-
ber of TP.
An explanation of the better performance of the
LID theory should be its overfitting. The decision
tree tries to reduce it and consequently, it offers com-
pact class descriptions satisfying the known objects.
However, that theory can fail in recognizing some un-
seen suspicious lesions far of the already known le-
sions. Instead, due to the overfitting, lazy domain
theories have class descriptions that are more specific
than those of the produced by the decision tree. This
means that there will be unseen objects that will not
be classified because they belong to areas of the space
for which there is no characterization. Nevertheless,
there are other areas that are better characterized due
to this specificity of the descriptions.
ROC curves
0
0,2
0,4
0,6
0,8
1
1,2
0 0,2 0,4 0,6 0,8 1 1,2
FPR
TPR
DT
LID
Figure 6: ROC curves comparing the performace of the the-
ories generated using both decision trees and LID.
6 CONCLUSIONS AND FUTURE
WORK
In this paper we introduced an approach for solv-
ing the problem of diagnosing early malignant
melanomas. Our main goal was to capture as more
MM as possible although this could produce also a
high number of false positives. However another
desirable goal is to generate some kind of domain
knowledge that could serve as basis to dermatologists
to elaborate an accurate domain theory. Our approach
is based on the use of lazy learning methods despite
they do no generate generalizations that could be used
as domain knowledge. In particular we compared the
performance of two lazy learning methods, the well-
known k-NN and LID, with the one of decision trees.
Although decision trees produce the highest accuracy,
a detailed analysis of the methods in terms of sensitiv-
ity and specificity show that lazy learning methods fit
better our requirements. The experiments show also
that k-NN and LID seem to be complementary in rec-
ognizing MM, therefore we implemented a rule R1
combining the prediction of both methods. The use
of the rule R1, that can be seen as a meta-classifier,
improves the true positive ratio although the false pos-
itive ratio is slightly higher than the one of LID.
Concerning the generation of a domain model, we
proposed to use the explanation of the classifications
produced by LID as a domain theory, and then we
compared it with a domain theory induced by means
of a decision tree. Results show that both theories
equally satisfy the expert’s expectations, however the
ROC analysis proved that the lazy domain theory cap-
tures more MM. We plan to analyze the domain the-
ory generated from the use of the rule R1.
I would be interesting to explore the possibility of
using some meta-learning method (Prodromidis et al.,
2000) to achieve a good combination of k-NN and LID
(and maybe some other method). We conducted some
KDIR 2011 - International Conference on Knowledge Discovery and Information Retrieval
206

preliminary experiments in this direction, however we
do not obtained the expected results: although the ac-
curacy improves with respect to each method alone,
the number of TP does not increase. A possible solu-
tion to focus on increasing TP could be the use of do-
main knowledge since it is known that there are some
relevant attributes characterizing MM (at least those
taken into account in the ABCD rule).
ACKNOWLEDGEMENTS
The authors acknowledge support of the Spanish
projects ARINF (TIN 2009-14704-C03-03), Next-
CBR (TIN 2009-13692-C03-01), and the grant 2009-
SGR-1434 from the Generalitat de Catalunya. The
authors also thank Pilar Delllunde and
`
Angel Garc
´
ıa-
Cerda
˜
na for their helpful comments to improve this
paper.
REFERENCES
Argenziano, G., Zalaudek, I., Ferrara, G., Hofmann-
Wellenhof, R., and Soyer, H. (2007). Proposal of a
new classification system for melanocytic naevi. Br J
Dermatol, 157(2):217–227.
Armengol, E. (2008). Building partial domain theories from
explanations. Knowledge Intelligence, 2(8):19–24.
Armengol, E. and Plaza, E. (2001). Lazy induction of
descriptions for relational case-based learning. In
Reaedt, L. D. and Flach, P., editors, ECML-2001.,
number 2167 in Lecture Notes in Artificial Intelli-
gence, pages 13–24. Springer.
Bareiss, E. R., Porter, B. W., and Wier, C. C. (1988). PRO-
TOS: an examplar-based learning apprentice. Int. J.
Man-Mach. Stud., 29(5):549–561.
Fawcett, T. (2006). An introduction to ROC analysis. Pat-
tern Recogn. Lett., 27:861–874.
Helma, C. and Kramer, S. (2003). A survey of the predic-
tive toxicology challenge 2000-2001. Bioinformatics,
pages 1179–1200.
Hofmann-Wellenhof, R., Blum, A., Wolf, I., Zalaudek, I.,
Piccolo, D., Kerl, H., Garbe, C., and Soyer, H. (2002).
Dermoscopic classification of Clark’s nevi (atypical
melanocytic nevi). Clin Dermatol, 20(3):255–258.
L
´
opez de M
´
antaras, R. (1991). A distance-based attribute
selection measure for decision tree induction. Ma-
chine Learning, 6:81–92.
Mitchell, T. (1997). Machine Learning. McGraw-Hill In-
ternational Editions. Computer Science Series.
Mitchell, T., Keller, R., and Kedar-Cabelli, S. (1986).
Explanation-based learning: A unifying view. Ma-
chine Learning, 1(1):47–80.
Plaza, E., Armengol, E., and Onta
˜
n
´
on, S. (2005). The ex-
planatory power of symbolic similarity in case-based
reasoning. Artificial Intelligence Review. Special Issue
on Explanation in Case-based Reasoning, 24:145–
161.
Prodromidis, A., Chan, P., and Stolfo, S. (2000). Meta-
learning in distributed data mining systems: Issues
and approaches. In Book on Advances of Distributed
Data Mining, editors Hillol Kargupta and Philip
Chan, AAAI press, 2000.
Puig, S., Argenziano, G., Zalaudek, I., Ferrara, G., Palou,
J., Massi, D., Hofmann-Wellenhof, R., Soyer, H., and
Malvehy, J. (2007). Melanomas that failed dermo-
scopic detection: a combined clinicodermoscopic ap-
proach for not missing melanoma. Dermatol Surg,
33(10):1262–1273.
Roth-Berghofer, T. R. (2004). Explanations and case-
based reasoning: Foundational issues. In Funk, P.
and Calero, P. A. G., editors, Advances in Case-Based
Reasoning, pages 389–403. Springer-Verlag.
Vestergaard, M. and Menzies, S. (2008). Automated di-
agnostic instruments for cutaneous melanoma. Semin
Cutan Med Surg, 27(1):32–6.
Witten, I., Frank, E., Trigg, L., Hall, M., Holmes, G., and
Cunningham, S. (1999). Weka: Practical machine
learning tools and techniques with Java implementa-
tions.
COMBINING TWO LAZY LEARNING METHODS FOR CLASSIFICATION AND KNOWLEDGE DISCOVERY - A
Case Study for Malignant Melanoma Diagnosis
207
