MATCHING TWO-DIMENSIONAL GEL ELECTROPHORESIS’
SPOTS
Ant´onio dos Anjos
1
, Bjarne Kjær Ersbøll
2
, Faroq AL-Tam
1
and Hamid Reza Shahbazkia
1
1
Department of Electronic and Informatics Engineering, University of Algarve, Faro, Portugal
2
Department of Informatics and Mathematical Modelling, Technical University of Denmark, Kgs. Lyngby, Denmark
Keywords:
2-D Electrophoresis, Matching, Registration.
Abstract:
This paper describes an approach for matching Two-Dimensional Electrophoresis (2-DE) gels’ spots, involv-
ing the use of image registration. The number of false positive matches produced by the proposed approach
is small, when compared to academic and commercial state-of-the-art approaches. This article contributes to
solving one of the greatest bottlenecks in the 2-DE analysis pipeline.
1 INTRODUCTION
In the context of Proteomics and Genomics, dif-
ferential analysis implies that two or more Two-
Dimensional Electrophoresis (2-DE) gel images are
compared in order to find the differences in terms of
protein or DNA expression. Although it is possible
to superpose two images and try to find their differ-
ences, it may not be the best approach. Distortions
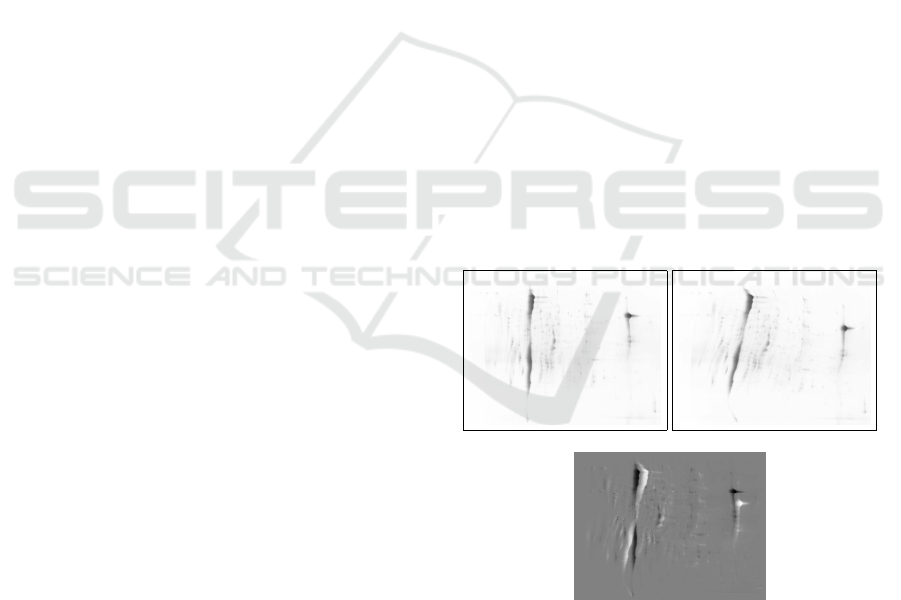
are present in the majority of the gels (Figure 1). This
way, when two different images are superposed, the
spots in one image will hardly be aligned with the
spots in the other image (Figure 1(c)). Essentially be-
cause these distortions are mostly non-rigid, the prob-
lem of finding a correspondence between spots be-
comes an extremely difficult task.
State-of-the-art software packages are known for
producing too many false positive matches (Rosen-
gren et al., 2003; Srinark and Kambhamettu, 2008).
The correction of false positive matches is an ex-
tremely time consuming task, being one of the main
bottlenecks in the analysis of 2-DE gels.
The problem of matching two sets of spots can be
put as a bipartite matching problem. However, the
following section shows that bipartite matching algo-
rithms may not be enough to achieve an acceptable
matching solution. Thus, other approaches will also
be considered, namely approaches that involve Image
Registration.
(a) Static image. (b) Deformed image.
(c) Difference image.
Figure 1: Distortion between 2-DE gels. Figures 1(a) and
1(b) represent approximately the same protein expression,
but are clearly different due to deformations.
2 BIPARTITE MATCHING
Matching protein spots between gels can be formu-
l
ated as a bipartite matching problem. According
to graph theory, a graph G = (V, E) with vertices
V and edges E is bipartite if there exists a partition
V = X ∪Y with X ∩Y =
/
0 and E ⊂ X ×Y. A match-
ing is a subset M ⊂ E such that ∀v ∈ V there is at most
one edge in M that is incident on v. The size of the
matching is given by the number of edges in M, and
is defined as |M|. A perfect matching is a matching
M where all the vertices are connected to one other
111
dos Anjos A., Kjær Ersbøll B., AL-Tam F. and Reza Shahbazkia H..
MATCHING TWO-DIMENSIONAL GEL ELECTROPHORESIS’ SPOTS.
DOI: 10.5220/0003702401110117
In Proceedings of the International Conference on Bioinformatics Models, Methods and Algorithms (BIOINFORMATICS-2012), pages 111-117
ISBN: 978-989-8425-90-4
Copyright
c
2012 SCITEPRESS (Science and Technology Publications, Lda.)
vertex at most.
When the goal is to find the best matching be-
tween vertices, the problem can be posed as an as-
signment problem where each edge e is assigned a
weight w(e). The maximum-weight matching satis-
fies the condition that for any other M
′
, W(M
′
) ≤
W(M), where W(M) =
∑
e∈M
w(e). One of the most
famous and reliable optimization algorithms that can
be applied to find the maximum-weight in a bipar-
tite matching is the Kuhn-Munkres algorithm (Kuhn,
1955), also called Hungarian Algorithm (HA).
Considering the spots in two different 2-DE gels,
the goal is to match each corresponding spot in gel X
to every other spot in gel Y. The spots are the ver-
tices of the graph. A weighing function w(e) based
on the similarity between each inter-gel spot has to be
defined.
It is proven in (Kuhn, 1955) that a maximum-
weight matching is a perfect matching. This requires
that each of the parties of the graph has the same num-
ber of vertices. 2-DE gels are unlikely to express the
same exact number of spots, even if the feature de-
tection step is perfect. This is easily solved by adding
the number of missing vertices to the set that has them
missing, and assigning an extremely high weight to
connect to those vertices.
The complexity of the Hungarian Algorithm is
O(V
3
). However, considering that manually correct-
ing the results of a poor matching process between
two 2-DE gel images may take several hours, the
O(V
3
) cost in the HA is a minor drawback.
In order to extract the features (i.e. protein spots),
the approach proposed in (dos Anjos et al., 2011) is
used.
If each vertex v
i
in the first party identifies the
location of a spot in the first image, and each ver-
tex v
j
identifies the location of a spot in the sec-
ond image, then, a cost function for each edge
e could be the Euclidean Distance: w(v
i
,v
j
) =
p
(v
ix
− v
jx
)
2
+ (v
iy
− v
jy
)
2
. This weighing function
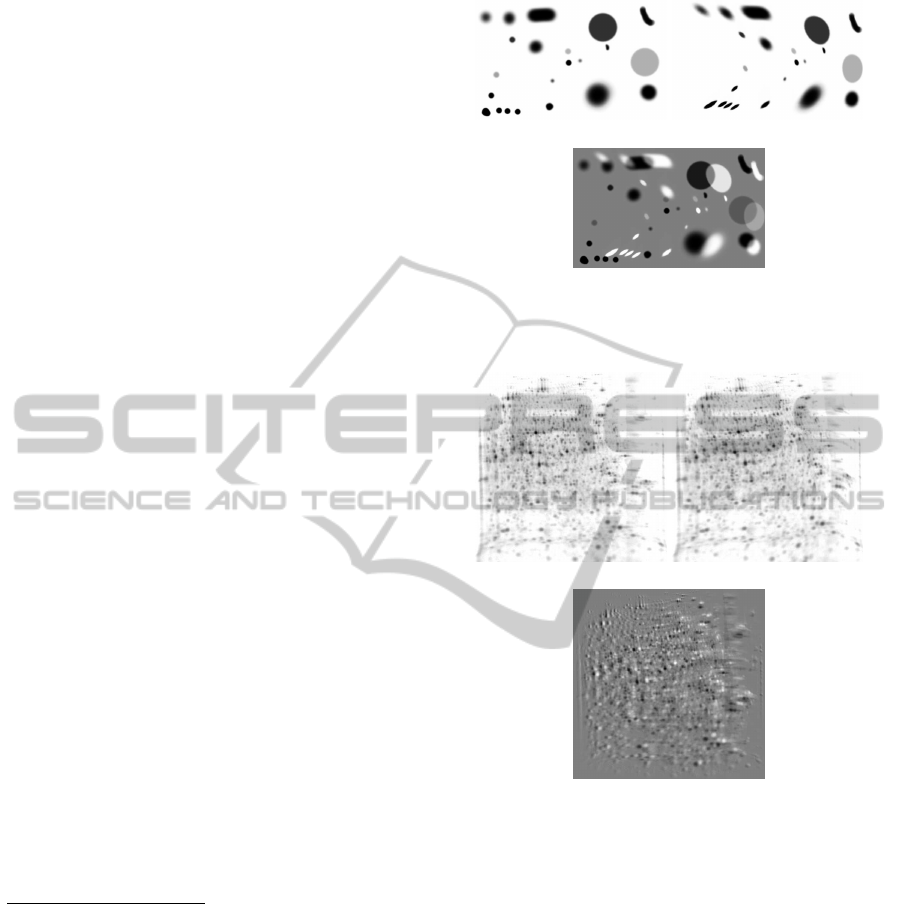
produces a perfect match between Figures 2(a) and
2(b), however, if only one outlier is introduced, only
≈ 60% of the spots are correctly matched. Therefore,
a more robust weighing function that includes more
information from the spots, namely the differences of
distances d, areas a, volumes vo, circularities c, ec-
centricities ec, and orientations o, has to be defined:
w(v
i
,v
j
) = α
d
kv
i
,v
j
k + α
a
a
i
− a
j
+α
vo
vo
i
− vo
j
+ α
c
c
i
− c
j
+α
ec
ec
i
− ec
j
+ α
o
o
i
− o
j
(1)
where the alphas are the respective weights of each
of the normalized components in w.
(a) Synthetic blob image. (b) Distorted image.
(c) Difference image.
Figure 2: Difference between synthetic images. A large
distortion between images is present.
(a) Static 2-DE gel image. (b) Deformed 2-DE gel image.
(c) Difference image.
Figure 3: 2-DE gels images and difference image.
Applying the HA with this weighing function
(Equation (1)), to Figures 2(a) and 2(b), produces a
match without any errors. Moreover, the outlier is
correctly identified. As reference, the weights were
set to: α
d
= 0.65;α
a
= 1.0;α
vo
= 1.5. The rest of the
coefficients were set to zero.
Figure 3(a) presents the image of one highly pop-
ulated 2-DE gel. The same image is presented in Fig-
ure 3(b) with an arbitrary elastic deformation. It is
possible to observe in Figure 3(c) that the gels’ spots
are not aligned.
Using as weights: α
d
= 2.5, α
a
= 1.5, α
vo
= 2.5, at
least, 103 spots were correctly matched, among a total
of 476 detected. This was manually verified. Not only
were the relatively close positioned spots matched but
also the relatively far positioned ones. Nevertheless,
the HA has limitations when the distortions in the im-
BIOINFORMATICS 2012 - International Conference on Bioinformatics Models, Methods and Algorithms
112

ages are extremely high. Additionally, the distortions
present in the 2-DE images are mostly local and non-
rigid, making it extremely difficult to find an optimum
valid match. If these distortions are corrected, the
number of matches may increase. This takes us to
a different field: Image Registration – which is dis-
cussed in the next section.
3 IMAGE REGISTRATION
The goal of image registration is to find a geometric,
or elastic transformationthat makes one image similar
to the other. Putting it more formally, the problem is
the following: Given two images S(i) and D(i), where
S is called the static image and D the deformed (also
called reference and match, respectively), the goal is
to find a transform T such that:
W = D(T(i)) ≈ S(i) (2)
where W is the warped image.
In differential analysis the objective is to identify
the differences and to quantify them, therefore, it may
be dangerous to register one image into the other us-
ing some image registration methods. For example,
Modersitzky (Modersitzki, 2004) completely warps a
ball into a C shape using a fluid registration method.
3.1 Geometric Transform
Non-rigid transforms, also called deformable and
elastic, allow relatively complex distortions in the im-
age. These include stretching and curving of the im-
age.
Affine transform, the most general transform that
preserves parallelism between lines, is a non-rigid
transform and is represented in homogeneous coor-
dinates by:
x
′
y
′
1
=
θ
0
θ
1
θ
2
θ
3
θ
4
θ
5
0 0 1
x
y
1
(3)
where θ
2
and θ
5
are the translations in x and y direc-
tions respectively.
The aforementioned transform preserves the
straightness of the lines. Curved transforms, as the
name points out, do not behave in a similar way.
These include the polynomial transformations that
can be expressed by:
x
′
=
∑
p
i
∑
p−i
j
a
ij
x
i
y
j
and y
′
=
∑
p
i
∑
p−i
j
b
ij
x
i
y
j
(4)
where p is the order of the polynomial transforma-
tion. Quadratic and cubic polynomial transforms are
the most used since they allow flexible enough trans-
formations, and higher order polynomials tend to get
unstable, specially at the borders of the images. Ad-
ditionally, very small perturbations may lead to very
unstable transformations in the image with a polyno-
mial of higher order.
4 REGISTRATION WITH
KNOWN CORRESPONDENCES
As previously seen, just by using the direct applica-
tion of the HA to the weighed distances between cor-
respondent spots in different gels, there was a sub-
stantial amount of correct spot matches between the
gels. Image registration can be used to improve these
results.
The idea is to select thebest matches and use those
matches to create a warping transform that hopefully
will drag the other misplaced and mismatched spots
to a corrected position in the gel image.
The proposed approach is the following:
1. Detect features;
2. Calculate the cost matrix;
3. Match using the Hungarian Algorithm;
4. Iterate until stability:
(a) Select only very good markers (≤ threshold);
(b) Warp;
(c) Recalculate the cost matrix;
(d) Rematch;
In this approach, the image is not really being
warped at each step. Because features have already
been detected, only the coordinates of the center of
the spots are recalculated, or warped. The objective
is to match the protein spots in one gel image to the
spots in the other gel image, instead of the whole im-
age.
Markers are detected and selected and the coeffi-
cients for a polynomial transform (Equation (4)) are
calculated. The degree of the polynomial transform
is limited by the number of detected points, there-
fore, higher order polynomial transforms were pre-
ferred until a maximum degree of 3. The intensity
levels resulting from the warping are simply ignored
since the objective here is just to correct the positions
of the spots.
The weights used in this matching were the same
as the previous ones: α
d
= 2.5; α
a
= 1.5; α
vo
= 2.5.
Two new parameters are additionally used, namely t
d
and t
c
, that define a threshold for the maximum al-
lowed distance for a spot to be accepted as a good
MATCHING TWO-DIMENSIONAL GEL ELECTROPHORESIS' SPOTS
113
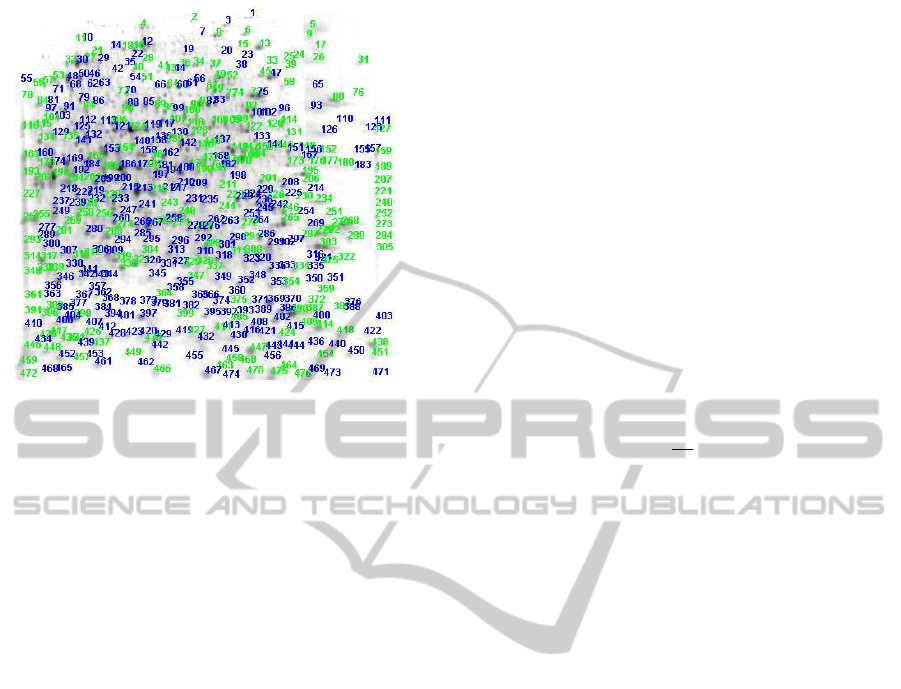
Figure 4: Matched with iterative registration. Blue numbers
represent reliable matches.
match, and the maximum allowed cost for a match to
be considered valid, respectively. The values set for
these thresholds were: t
d
= 0.09;t
c
= 0.1.
By using the presented approach, we can get a
minimum of 255 correct matches as shown in Figure
4, in contrast to 103 in the previous attempt. This
represents an increase of more than 100%. The blue
markers are the matches accepted as having an accept-
able quality. The green markers are markers that are
not considered reliable for being at a relatively far Eu-
clidean distance from the match, although many can
also be found as correct matches.
Although there is a great improvement, the results
obtained from matching “naturally” deformed images
is far from acceptable. A more advanced approach is
presented in the next section as an attempt to improve
these results.
5 REGISTRATION WITHOUT
KNOWN CORRESPONDENCES
For two images, it may be acceptable to ask the user
to manually place landmarks in order to allow the
calculation of the transformation. For large amounts
of images, that is not a suitable approach. For the
global misalignment correction, an automatic para-
metric affine transformation was chosen. Also, in
order to correct local distortions, non-parametric de-
formable registration is considered in this section.
5.1 Correction of Global Distortions
When a 2-DE gel is placed in the scanner, the posi-
tion of the gel will hardly be the same as the previ-
ously scanned gels. Rotation and translation are the
most common differences between gels, and these
are global deformations. Before any other attempt
of matching relative nearby spots between gels, these
global distortions should be corrected.
Parametric image registration deals with the prob-
lem of finding the transform’s parameters, in order to
minimize a similarity measure or error function.
Let us start by choosing the SSD as the similarity
measure. Thus, the problem is to find the parameters
Θ that minimize the following error function:
E(S, D(T(Θ))) =
N
∑
i
(S(~x
i
) − D(T(Θ,~x
i
)))
2
(5)
where Θ is a set of K parameters Θ =
{θ
0
,θ
1
,. . . ,θ
k
,. . . ,θ
K
} belonging to the trans-
form that warps D. E will stabilize and, therefore,
should be minimum when
∂E
∂θ
k
= 0, for all k.
The error can be minimized by either Gradient De-
scent, Gauss-Newton, or Levenberg-Marquardt opti-
mization (Levenberg, 1944; Marquardt, 1963). Since
the latter has become a standard technique for nonlin-
ear least-squares problems and can be thought of as a
combination of Gradient Descent and Gauss-Newton,
this is the method used in the proposed approach.
5.1.1 Tests
Figures 5(a) and 5(b) show the resulting difference
images of automatically registering images in Figure
2(b) to 2(a), and 1(b) to 1(a), respectively. Compare
Figure 5(a) with Figure 2(c). Also, compare Figure
5(b) with Figure 1(c). It is obvious that the global reg-
istration method corrected the global affine distortions
on both images. One of the great advantages of cal-
culating the distortion as global is that the number of
parameters that have to be estimated for the transfor-
mation is relatively small. The disadvantage is that lo-
cal distortions are not corrected, and 2-DE gel images
are also prolific in these kind of distortions. There-
fore, these resulting global transforms can be used as
a very good initial seed for a registration method that
handles local distortions.
5.2 Correction of Local Distortions
In order to take care of local distortions, automatic
non-parametric image registration was chosen since
parametric transformations do not perform well for
local distortions (Goshtasby, 1986). Image registra-
tion without known correspondences is an ill-posed
problem. A mathematical problem is ill-posed if its
BIOINFORMATICS 2012 - International Conference on Bioinformatics Models, Methods and Algorithms
114
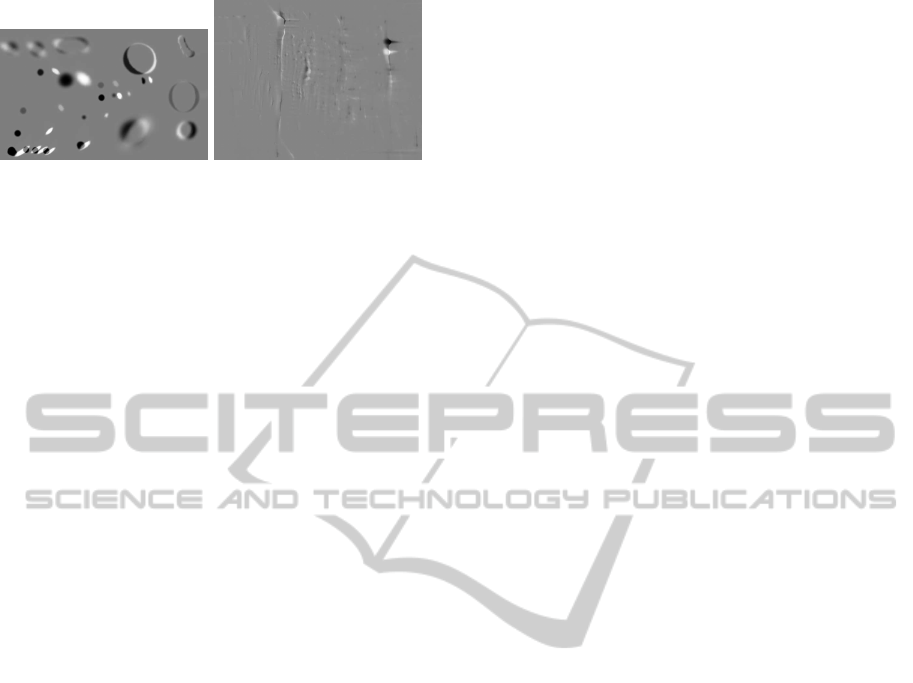
(a) Synthetic image. (b) 2-DE image.
Figure 5: Differences after affine registration.
solution is not unique, does not exist, or does not de-
pend continuously on the data (Hadamard, 1902).
An approach to solve ill-posed problems is based
in the regularization theory. Generally, it involves
the inclusion of constraints on the possible solutions.
Constraints are, usually, imposed by a regularizer.
The registration method presented in the previoussec-
tion did not need an explicit inclusion of any kind of
regularizer, since the solutions were implicitly regu-
larized by properties of the space. The most common
constraint used in the regularization of image process-
ing problems is smoothness. Regularization theory
involves the use of two terms:
• the error term E;
• the regularization term R.
The error term is usually the sum of squared differ-
ences, rewritten as follows:
E
SSD
(S, D,T) =
N
∑
i
(S(~x
i
) − D(T(~x
i
)))
2
(6)
and the regularization term:
R(T) = k∇Tk
2
(7)
The regularizer can be seen as a term that will prevent
abnormal transformations from occurring or, in other
words, a term that penalizes certain exaggerations in
the transformation.
Consequently, the total error to be minimized can
be expressed as:
E
t
(S, D,T) =
∑
E(S, D, T) + λR(T) (8)
with λ being a value that controls the trade-off be-
tween data fitness and transformation smoothness.
If the transformation caused by T in ~x is repre-
sented by u(~x), or T(~x) =~x+ u(~x), then the problem
can be posed in a variational way. Therefore, the ob-
jective now is to find the u that minimizes E(S,D, u).
In other words, we want to minimize the following
error function:
E
t
(S, D,u) =
∑
i
E(S, D, u) + λR(u) (9)
When E
t
is minimized, then u satisfies the Euler-
Lagrange equation:
∇(E(S, D, u)) + λ∇R(u) = 0. (10)
An approach presented in (Knut Conradsen, 1992)
tries to find the best u using an approximation to the
cross-correlation as matching criteria. In the cited
source, an algorithm to match two 2-DE gel images
of 512 × 512 pixels is presented. The method pro-
posed by the author estimates a transformation that
maps one 2-DE gel image to the other by using the
intensity of the pixels as main criteria. For each of the
pixels in one gel image, a disparity vector is estimated
or, in other words, the distance between coordinates
of the pixel in one gel and the best candidate position
on the other is calculated. The best candidate is iden-
tified by the local arrangement of gray levels for the
neighbor pixel in the other gel, and the matching is
done by cross-correlating the two gels. The different
maxima of the cross-correlation function will produce
the disparity vectors. These vectors are used to warp
the second gel so that it matches the first as well as
possible.
A median smoothing is applied at each level of the
pyramid, and together with the scaling process, these
act as a regularizer.
6 REGISTRATION-BASED
MATCHING
Some modifications were made to the algorithm pre-
sented in (Knut Conradsen, 1992). First, it was
adapted to work with any image size. As some ar-
tifacts could be seen at the end of the registration
process, another improvement consists in the use of
the original image and the cumulative displacement
matrices when warping at the intermediary steps, in-
stead of always using the same warped image with
the intermediate matrices. Also, cubic B-Spline in-
terpolation replaced cubic interpolation. Images with
more complex distortions were not being correctly
registered, therefore, a parameter was introduced in
order to allow more iterations at each level of the
pyramid. These changes introduced considerable im-
provements at the cost of more computational com-
plexity.
In the proposed approach, the intention is to find
correct positions for each spot in order to allow a bet-
ter matching. Therefore, what matters are the trans-
forms and not the warped images.
We proposed the following approach:
1. Normalize the images;
MATCHING TWO-DIMENSIONAL GEL ELECTROPHORESIS' SPOTS
115

2. Global Affine Registration;
3. Full image registration using the previous calcu-
lated transform as seed;
4. Detect features in the original images;
5. Correct the spots’ coordinates using the transform
calculated in step 3;
6. Match features with corrected coordinates;
After the results of the affine global and full reg-
istrations, the features in the original images are de-
tected using the approach proposed in (dos Anjos
et al., 2011). As mentioned before, position, area,
volume and other descriptors are extracted from the
spots. Nevertheless, only the coordinates of the de-
formed image are corrected by using the total dis-
placement field calculated from the image registration
process.
The total displacement u
t
(~x) for the position of
each detected spot is the following:
u
t
(~x) =~x− ((A~x+ b) + u(~x)) (11)
where (A~x + b) is the affine transform calculated as
described in Section 5.1, and u(~x) is the displacement
for each coordinate as calculated in (Knut Conradsen,
1992) with the proposed improvements.
This way, position can be given a much higher
weight in the cost function as it is supposed to be more
reliable. Another improvement, relatively to the pre-
vious presented approach is the replacement of the de-
tected volume by the volume of the spot weighed by
a Gaussian centered at the spot. Therefore, instead of
relying only on the detected volume, one relies on the
volume and on the context defined by the spot’s im-
mediate surroundings. Therefore, even having lower
representation, the information surrounding the spot
is included, contributing for a better match. Addition-
ally, a threshold t
ed
was created in order to immedi-
ately exclude the possibility of matches that are at a
very far position from the correspondingspot. Finally,
spot matches not respecting this threshold are set to ∞.
Only then, the cost matrix is processed by the HA.
7 RESULTS
All the parameters were the same for the complete set
of images. Distance and (new) volume, for the weigh-
ing function were set to: α
d
= 1.0; α
vo2
= 1.0. All the
other weight coefficients were set to zero. Moreover,
t
d
= 0.35;t
c
= 0.35;t
ed
= 35, where t
ed
is not normal-
ized as it is used during the construction of the cost
matrix.
As it will be demonstrated, one of the great advan-
tages of this approach is that it is very difficult to find
(a) 200 spots found. (b) 217 spots found.
Figure 6: Figures 1(a) and 1(b). Valid matches: 155.
a false match between the markers presented as valid
markers, meaning that the presence of false matches
is extremely low, or non-existent. Only markers pre-
sented in blue are matches that respect all the defined
thresholds. Green markers have found a match in the
HA but do not respect either t
d
or t
c
. Finally, the red
markers did not find any match in the HA, being con-
sidered as outliers.
Figure 6 shows the result of the suggested match-
ing process used to match the spots of Figures 1(a)
and 1(b).
A very popular approach used in feature matching
is Shape Context (Belongie and Malik, 2000). It ba-
sically consists of analyzing the spacial relationship
between points.
Shape contexts use mainly four parameters. The
first parameter defines the number of radial bins for
the creation of the histograms (set to 10), the second is
the number of theta bins that defines how many slices
should the histograms be divided in (set to 24), and
the minimum and maximum widths of the bins (set to
1 and 100, respectively).
Table 1 presents a comparison of the results of the
matches using the proposed approach and matching
with shape contexts.
It is clear that the proposed approach is doing a
better job than the shape context approach. The num-
ber of false matched spots is extremely low when us-
ing the proposed approach. This is highly desirable
because it avoids the necessity of a laborious manual
intervention to correct the results.
PDQuest is considered as one of the best software
packages in matching 2-DE gel images (Rosengren
et al., 2003). Despite not directly comparable with
PDQuest, or with any other commercial software, be-
cause the detected spots are not exactly the same as
the detected by our approach, results from matching
the same images used in Table 1 are presented in Ta-
ble 2 using PDQuest Version 8.0.1 build 055.
Although the number of false matched spots is
BIOINFORMATICS 2012 - International Conference on Bioinformatics Models, Methods and Algorithms
116

Table 1: Comparison between the detection of the proposed approach and shape context approach.
Spot Det Proposed Shape Context
Stat Def Mat Min % F.P. % F.P. Mat Min % F.P. % F.P.
341 374 238 69.79% 0 0.00% 272 79.77% ≥ 35 ≥ 10.26%
200 217 155 77.50% 0 0.00% 130 65.00% ≥ 20 ≥ 10.00%
97 114 56 57.73% 1 1.03% 52 53.61% ≥ 15 ≥ 15.46%
49 44 32 72.73% 1 2.27% 36 81.82% ≥ 12 ≥ 27.27%
422 398 312 78.39% 2 0.50% 315 79.15% ≥ 30 ≥ 07.54%
160 207 79 49.38% 2 1.25% 118 73.75% ≥ 20 ≥ 12.50%
160 195 41 25.63% 7 4.38% 48 30.00% ≥ 07 ≥ 04.38%
160 260 104 65.00% 1 0.63% 117 73.13% ≥ 10 ≥ 06.25%
160 278 92 57.50% 0 0.00% 112 70.00% ≥ 15 ≥ 09.38%
160 249 54 33.75% 6 3.75% 88 55.00% ≥ 10 ≥ 06.25%
Avg: 58.74% Med: 1.37% Avg: 66.12% Med: ≥ 13.99%
Table 2: Matching with PDQuest.
Spot Det PDQuest
Stat Def Mat Min % F.P. % F.P.
154 331 123 79.87% 0 0.00%
174 180 137 78.74% 7 4.02%
91 58 52 89.66% 4 6.90%
45 31 29 93.55% 1 3.23%
332 293 209 71.33% 5 1.71%
137 154 78 56.93% 3 2.19%
137 146 60 43.80% 8 5.84%
137 175 95 69.34% 0 0.00%
137 214 100 72.99% 0 0.00%
137 249 58 42.34% 4 2.92%
Avg: 69.85% Med: 3.65%
also low, when compared to the proposed approach,
it is possible to conclude that a lot of post-processing
will be needed. First, many undetected valid spots
have to be manually added and, then, they need to be
re-matched. Nevertheless, the matching is also very
good.
In summary, an effective spot matching approach
is proposed in this article. These results are outper-
forming the results obtained from importantacademic
and commercial approaches.
REFERENCES
Belongie, S. and Malik, J. (2000). Matching with shape
contexts. In Content-based Access of Image and Video
Libraries (CBAIVL), pages 20–26, Hilton Head, SC.
dos Anjos, A., Møller, A. L. B., Ersbøll, B. K., Finnie, C.,
and Shahbazkia, H. R. (2011). New approach for seg-
mentation and quantification of two-dimensional gel
electrophoresis images. Bioinformatics, 27(3):368–
375.
Goshtasby, A. A. (1986). Piecewise linear mapping func-
tions for image registration. Pattern Recognition,
pages 459–466.
Hadamard, J. (1902). Sur les probl`emes aux d´eriv´es par-
tielles et leur signification physique. Princeton Uni-
versity Bulletin, 13:49–52.
Knut Conradsen, J. P. (1992). Analysis of two-dimensional
electrophoretic gels. Biometrics, 48:1273–1287.
Kuhn, H. W. (1955). The Hungarian method for the assign-
ment problem. Naval Research Logistics Quarterly,
2(1-2):83–97.
Levenberg, K. (1944). A method for the solution of cer-
tain non-linear problems in least squares. Quarterly
Journal of Applied Mathmatics, II(2):164–168.
Marquardt, D. W. (1963). An algorithm for least-squares
estimation of nonlinear parameters. Siam Journal on
Applied Mathematics, 11.
Modersitzki, J. (2004). Numerical Methods for Image Reg-
istration. Oxford University Press.
Rosengren, A. T., Salmi, J. M., Aittokallio, T., Westerholm,
J., Lahesmaa, R., Nyman, T. A., and Nevalainen,
O. S. (2003). Comparison of pdquest and progenesis
software packages in the analysis of two-dimensional
electrophoresis gels. Proteomics, 3(10):1936–1946.
Srinark, T. and Kambhamettu, C. (2008). An image anal-
ysis suite for spot detection and spot matching in
two-dimensional electrophoresis gels. Electrophore-
sis, 29(3):706–715.
MATCHING TWO-DIMENSIONAL GEL ELECTROPHORESIS' SPOTS
117
