
ECG ARTEFACT DETECTION ALGORITHM
An Algorithm to Improve Long-term ECG Analysis
Susana Brás
1,2
, Nuno Ferreira
3
and João Paulo Silva Cunha
1,2
1
Institute of Electronics and Telematics Engineering of Aveiro (IEETA), Aveiro University
Campus Universitário de Santiago, Aveiro, Portugal
2
Departamento de Engenharia Electrónica, Telecomunicações e Informática, Universidade de Aveiro
Campus Universitário de Santiago, Aveiro, Portugal
3
Biodevices S.A., Rua 5 de Outubro, Porto, Portugal
Keywords: Electrocardiogram, Artefact detection, Threshold analysis.
Abstract: Newly devices allow the analysis and collection of very long-term electrocardiogram (ECG). However,
associated with this devices and long-term signal, are artefacts that conduce to misleading interpretations
and diagnosis. So, new developments over automatic ECG classification are needed for a reliable
interpretation. The feasibility of the cardiac systems is one of the main concerns, once they are currently
used as diagnosis or help systems. In this project, an artefact detection algorithm is developed, dividing the
time-series in intervals of signal and artefact. The algorithm is based on the assumption that, if the analysed
frame is signal, there is not an abrupt alteration over consecutive short windows. So, the time-series is
divided in consecutive nonoverlapped short windows. Over these windows, it is calculated the time-series
standard deviation, the maximum and minimum slope. A threshold-based rule is applied, and the algorithm
reveals that, in mean, it is verified a 99.29% of correctly classified signal and only 0.71% of signal
erroneously classified. Over the results obtained, the algorithm seems to present good results, however it is
needed its validation in a wider and representative sample with segments marked as artefact by multiple
specialists.
1 INTRODUCTION
The electrocardiogram (ECG) studies started with
visual inspection of the wave morphology alterations
(Malik, 2003). Due to the introduction of long-term
ECG devices, the visual inspection became time
consuming. To address this shortcoming, automatic
systems and algorithms were presented for a fast and
efficient analysis. The scientific community
proposed algorithms for the delineation and
identification of the complexes that compose the
heartbeat (P, QRS and T) (Pan, 1985); (Hamilton,
1986); (Almeida, 2010); (Vila, 2000); (Martinez,
2004). The analysis of different ECG characteristics
allowed the evaluation of specific pathologies, e.g.,
arrhythmias (Chin, 2010); (Tsipouras, 2002); or
ventricular repolarization abnormalities (Malik,
2003).
All the advances on the ECG analysis and
classification introduce a high necessity of new
developments in this area to obtain the most feasible
results. In rest ECG analysis (Stern, 1975), the
patient cardiac function is evaluated, studying the
alterations to normal under a resting condition. In
this kind of analysis, the ECG time-series is almost
noise free. In Holter analysis (Gibson, 2007),
physicians are interested in the analysis of long-term
ECG. The purpose is the evaluation of cardiac
function during daily routine activities, usually in a
24h or 48h exam. Since the Holter is a long-term
exam with the goal to evaluate specific alterations or
abnormalities, the presence of artefacts could mask
important events. Nowadays, very long-term ECG
monitoring is used as telemetric medicine (Mittal,
2011), or for online and real-time evaluation of
patient cardiac function. The Vital Responder
project is an example of such long-term ECG
monitoring. The main goal of the project is to
develop a system able to identify fatigue/stress,
during firefighters daily routine activities, focusing
on the cardiovascular analysis. Between first
responder professionals, firefighters registered the
329
Brás S., Ferreira N. and Silva Cunha J..
ECG ARTEFACT DETECTION ALGORITHM - An Algorithm to Improve Long-term ECG Analysis.
DOI: 10.5220/0003729503290333
In Proceedings of the International Conference on Bio-inspired Systems and Signal Processing (BIOSIGNALS-2012), pages 329-333
ISBN: 978-989-8425-89-8
Copyright
c
2012 SCITEPRESS (Science and Technology Publications, Lda.)

highest number of deaths on duty; some of them
associated with cardiac complications, which could
be consequence of exposure to stressful events.
The ECG based algorithms sometimes produce
misleading interpretation due to artefacts presented
in the time-series. Thus, algorithm for artefact
detection is of upmost importance that will allow
rejecting anomalous information, which induces in
error the automatic algorithms. The goal of this
paper is to present new algorithm for artefact
detection for very long-term ECG monitoring.
Basically, the algorithm evaluates the alterations of
the wave over consecutive windows. The entire
algorithm development was focused on the
assumption that ECG time-series have not abrupt
alterations between consecutive windows, if they are
considered sufficiently shorter. The long term ECG
could present differences along the exam, however,
they are gradually inspected. Therefore, if the
windows are sufficiently short, i.e., 2 or 3 seconds,
the alterations should not be significant if no artefact
is present.
In section 2, the Methods are described divided
in: Evaluated Database characteristics, ECG Pre-
processing, Artefact Detection Algorithm and the
Performance Evaluation. The Results are presented
in section 3 and in section 4 conclusions are drawn.
2 METHODS
The ECG was collected using the VitalJacket®
(Figure 1). The VitalJacket® is a wearable very
long-term ECG monitoring device composed by
microelectronics embedded into the textile
manufactured in the form of a simple t-shirt (Cunha,
2010). The VitalJacket® is a confortable t-shirt and
consequently does not collide with mobility. It can
record 5 lead ECG and accelerometry during up to 5
days in a single battery charge. It is equipped with a
memory card, where the data is recorded. Also, the
communication by Bluetooth in real time to a
computer or smartphone is possible, allowing the
real time analysis of data and algorithms
implementation. Biodevices S.A. has successfully
concluded the certification process according to the
standards ISO9001 and ISO13485 and the approval
of Vital Jacket® as a medical “Ambulatory ECG
device” according to the MDD directive 42/93/CE
that regulates medical devices in Europe. Vital
Jacket® has been granted with the CE1011 mark
(Cunha, 2010).
Figure 1: Vital Jacket, the wearable very long-term ECG
recording device used in the study.
2.1 Evaluated Database
The data was collected from 8 individual divided in
segments of noise and signal. The segments of
consecutive epochs were validated by a senior
cardiologist. Over the very long-term ECG data, the
specialist chose ECG segments where the time series
is not corrupted by artefact. On the other hand, there
are also chosen segments of the time series, clearly
marked by artefacts. Since, sometimes, the artefact
is not persistent, in some of the cases was not
possible to obtain a segment only marked by
artefact. So, it is important to point out that the data
contained in the signal segment is free of artefacts;
nevertheless the data in the noise segment is not
100% artefact.
The algorithm was validated not in all collected
signal, but in the segments chosen by the specialist,
and described in table 1. The signal (noise) segments
correspond to 0.25% (0.10%) of the total exams.
Since the data was collected in a non-controlled
scenario, it is contaminated by artefacts. Therefore,
consecutive segments of signal (noise) in each exam
have small duration.
Table 1: Database characteristics, the data was collected
using the VitalJacket®. Fs is the sampling frequency, h
corresponds to hours, m to minutes and s to seconds. The
segments are constituted by consecutive epochs of the
ECG long-term exam.
Example
#
Fs
(Hz)
Exam
duration
(h:m:s)
Signal
segment
(h:m:s)
Noise
segment
(m:s)
1 500
24:46:50
13:03 10:45
2 500
31:33
7:36 1:45
3 500
24:27:42
20:06 8:12
4 500
491:27:53
10:54 1:48
5 500
165:46:01
21:09 8:21
6 500
24:46:55
25:09 16:39
7 500
165:00:09
17:39 0:27
8 500
9:23:20
22:39 8:24
Total
937:11:50 2:18:15 56:21
0.25% 0.10%
BIOSIGNALS 2012 - International Conference on Bio-inspired Systems and Signal Processing
330

2.1.1 ECG Pre-processing
Once the used ECG corresponds to segments of very
long-term ECG collected during normal daily
routine activities of different individuals, there is
high frequency noise in the records. As described by
Sornmo and Laguna (Sornmo, 2006) after the 40Hz
there is no information about the P, QRS or T
complexes. Furthermore, the information after 30Hz
has a low power spectrum. Considering this
information a Butterworth low pass filter of order 3
with 30Hz cutoff frequency was applied to the data.
The filtered output signal is used in the artefact
detection algorithm.
2.2 Artefact Detection Algorithm
The algorithm development was based on the
assumption that in the presence of signal there are
not abrupt alterations between consecutive windows.
When an interval contains artefact, the
cardiologists rejects the information in an interval
around it of approximately 10 seconds, because they
do not trust in that information. Therefore, the
proposed method analyse the information in 12
seconds divided in consecutive nonoverlapped
windows of three seconds.
In each window, it was calculated the time-series
standard deviation (sd
i
, i=1,2,…,n; n number of
windows), the maximum slope (Ms
i
, i=1,2,…,n) and
minimum slope (ms
i
, i=1,2,…,n). Over these
measures the difference between two consecutive
windows is computed (d1
i
=sd
i+1
-sd
i
, d2
i
=Ms
i+1
-Ms
i
,
d3
i
=ms
i+1
-ms
i
, i=1,…,n-1).
Briefly, the algorithm will evaluate the four
windows and decide if there is artefact, based on a
threshold definition. The ECG signal analysis
indicates the initial thresholds, after they were tuned
according to the improvement of the algorithm
performance. If one of the following rules is
verified, the evaluated four windows are artefact:
•
(
1
+1
+1
)
>0.5
, i=1,4,7,…,n-1;
•
1
−1
+1
−1
+1
−1
>
0.25,
where 1
is the average d1
j
(j=i, i+1, i+2)
value;
•
(
2
+2
+2
)
>1
, i=1,4,7,…,n-1;
•
2
−2
+2
−2
+2
−2
>3,
where 2
is the average d2
j
(j=i, i+1, i+2) value;
•
(
3
+3
+3
)
>1
, i=1,4,7,…,n-1;
•
3
−3
+3
−3
+3
−3
>3.5,
where 3
is the average d3
j
(j=i, i+1, i+2) value.
If one of the six rules is verified, it is a 12 seconds
window of artefact.
2.3 Performance Evaluation
The performance of classification is evaluated in
terms of sensitivity (Sen) (equation 1). Considering
that ncc
i
is the samples correctly classified in type i
(i=1,2) and Ncc
i
is the number of samples classified
in type i (i=1,2).
=
(1)
Also the percentage of signal and artefact over the
entire segment is calculated as
=
(2)
where n
i
is the number of classified samples from
type i (i=1,2) and N
i
is the total number of samples
in type i (i=1,2).
It is important to state that when the sensitivity is
evaluated for signal samples detection in the signal
segments, the sensitivity will be equal to P
i
for
classified signal samples over this segment. Also,
when the artefact detection is evaluated, the
sensitivity of the artefact detection in the noise
segments will equal the P
i
for artefact, in this
segment.
Usually, the performance in a classifier is
accessed by sensitivity and specificity. However, in
this study, due to the database characteristics, the
true negatives are not demarcated. In that way the
specificity of the algorithm could not be accessed.
3 RESULTS
We started to understand the proposed measure
differences between signal and noise segments.
Table 2 presents the mean and standard deviation of
the three studied measures (sd, Ms, ms) considering
signal or noise segments. By the table inspection, it
is observed that the mean and standard deviation
values in noise segments are significantly higher
than in signal segments. This leads to conclude that,
in the presence of signal, there are not abrupt
alterations between consecutive windows
(confirming the initial assumption).
ECG ARTEFACT DETECTION ALGORITHM - An Algorithm to Improve Long-term ECG Analysis
331

Table 2: Mean and standard deviation (std) over the 3
seconds windows of the three implemented measures used
to discern between signal and artefact. Sd corresponds to
the standard deviation; Ms is the maximum slope; and ms
represents the minimum slope in each window.
Signal segments Noise segments
mean std mean std
sd
4,680 2,759 24,341 23,985
Ms
4,562 1,988 28,426 50,446
ms
-7,042 3,620 -31,982 56,861
Once, the goal is to identify artefacts, and
following the previous results, the identification is
made based on the difference between two
consecutive windows that could not exceed
predefined thresholds. These thresholds were
defined based on the best performance algorithm
achieved in these data sample. The algorithm has yet
been validated outside the used database in the
algorithm training. However, the new data was not
validated by a cardiologist.
Table 3 presents the results of the application of
the differentiation rule (section 2.3) to the 8
segments of signal. Also, table 4 shows the
algorithm performance in the artefact detection, over
the 8 segments containing artefacts.
Table 3: Artefact detection algorithm application to signal
segments. Sig corresponds to the classified interval as
signal, Art to the classified interval as artefact. Sen is the
sensitivity in the signal segment. P
art
is the percentage of
artefact detected in the segment.
Signal
segment
(h:m:s)
Sig Art
Sen
(%)
P
art
(%)
1
13:03 12:54 00:09 98,85 1,15
2
7:36 7:36 00:00 100,00 0,00
3
20:06 19:57 00:09 99,25 0,75
4
10:54 10:36 00:18 97,25 2,75
5
21:09 21:09 00:00 100,00 0,00
6
25:09 25:03 00:06 99,60 0,40
7
17:39 17:39 00:00 100,00 0,00
8
22:39 22:30 00:09 99,34 0,66
Mean 99,29 0,71
Median 99,47 0,53
As previously referred in the database
specifications, the specialist specified that the
segments of signal were free of artefacts;
nevertheless, the segments of noise were not 100%
artefact. Therefore, the true algorithm performance,
using this database is only accessed in the Table 3.
From the evaluation of Table 3 it is observed that the
presented algorithm has a good performance in
discerning between signal and artefact (mean
99.29%). The percentage of artefact erroneously
detected in the signal samples is low. From table 4,
it is observed that there are a mean percentage of
artefacts corresponding to approximately one half of
the data. From this latter evaluation and following
the database specifications, it is not possible to infer
the real performance. However, in the signal
evaluation, the algorithm proves to be able to differ
over signal and artefact.
Table 4: Artefact detection algorithm performance
evaluated in the noise segments (note that, as specified by
the specialist, this segments are not 100% artefact). Sig
corresponds to the classified interval as signal, Art to the
classified interval as artefact. Sen is the sensitivity in the
artefact segment. P
sig
is the percentage of signal detected
in the segment.
Noise
segment
(h:m:s)
Sig Art
Sen
(%)
P
sig
(%)
1
10:45 08:12 02:33 23,72 76,28
2
01:45 00:54 00:51 48,57 51,43
3
08:12 06:15 01:57 23,78 76,22
4
01:48 00:00 01:48 100,00 0,00
5
08:21 07:30 00:51 10,18 89,82
6
16:39 16:03 00:36 3,60 96,40
7
00:27 00:00 00:27 100,00 0,00
8
08:24 01:21 07:03 83,93 16,07
Mean 49,22 50,78
Median 36,18 63,82
In a next step, the algorithm should be evaluated
in ECG segments where the artefacts are
differentiated from signal. In the presented work, it
was possible to evaluate the algorithm performance
in discerning from signal and artefact. This step is
important, because it is wanted an algorithm
allowing the evaluation of the maximum amount of
data in a segment to obtain the more suitable results.
Figure 2 illustrates the algorithm implementation
performance in an ECG time-series containing
artefacts and clean signal. In figure 2a), it is
presented the entire exam corresponding to an
example outside the database used for algorithm
training. In figure 2b), a zoom around the 1530
seconds is presented. In this subfigure, it is observed
a high amplitude interval in the signal. The
algorithm marks this interval as artefact, between
intervals of signal.
BIOSIGNALS 2012 - International Conference on Bio-inspired Systems and Signal Processing
332
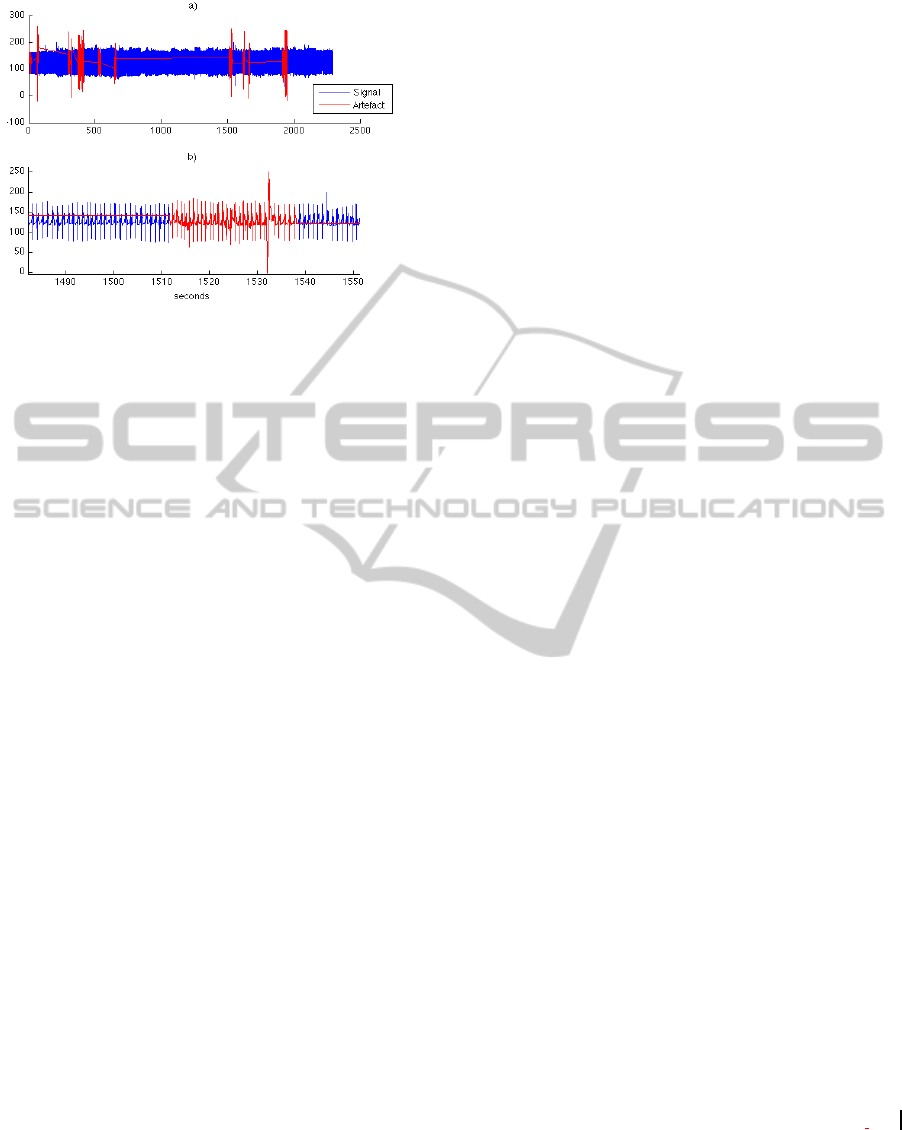
Figure 2: Artefact detection algorithm implementation in
an exam out of the used database. The red line represents
the ECG classified as artefacts and the blue the ECG
classified as signal. a) Signal classification. b) Zoom
around 1530 seconds.
4 CONCLUSIONS
In this work, it is presented an algorithm for artefact
detection over long-term ambulatory
electrocardiogram (ECG) signal. The algorithm is
based on standard deviation, maximum and
minimum slope evaluation in short windows, and the
imposition of differentiation rules based on
thresholds over the previous mentioned measures.
The algorithm proved to differentiate between signal
and artefact with a high performance considering the
percentage of signal correctly classified over eight
segments. However, the algorithm should be also
validated in a wider and representative sample, with
intervals marked as artefact by multiple specialists.
In conclusion, the present algorithm seems to be
promising results and in future a great help in
cardiac systems, once the misleading interpretation
of artefact as signal could conduce the cardiac
systems to erroneous outputs.
ACKNOWLEDGEMENTS
This work was partially supported by IEETA UA
(R&D centre financed by Fundação para a Ciência e
Tecnologia – FCT, Portugal through
POCI2010/POCTI/POSI programmes, with national
and CSF funds) and by Project “Vital Responder",
funded under the "Carnegie-Mellon|Portugal"
program from FCT (Portuguese R&D funding
agency) ref. CMU-PT/CPS/0046/2008. The authors
also acknowledge the support from Biodevices S.A.
REFERENCES
Almeida, R., Martínez, J. P., Rocha, A. P., Laguna, P.,
2010. P wave delineation using spatially projected
leads from wavelet transform loops. In Proceedings of
Computers in Cardiology, 37:1003-1006.
Chin, F. J., Fang, Q., Zhang, T., Cosic, I., 2010. A fast
critical arrhythmic ECG waveform identification
method using cross-correlation and multiple template
matching. In Proceedings of the 32nd Annual
International Conference of the IEEE EMBS, 1922-25.
Cunha, J. P. S., Cunha, B., Pereira, A. S., Xavier, W.,
Ferreira, N., Meireles, L., 2010. Vital Jacket: A
wearable wireless vital signs monitor for patients'
mobility in Cardiology and Sports. In Proceedings of
4th International ICST Conference on Pervasive
Computing Technologies for Healthcare, 1-2.
Gibson, C. M., Ciaglo, L. N., Southard, M.C., Takao, S.,
Harrigan, C., Lewis, J., Filopei, J., Lew, M., Murphy,
S. A., Buros, J., 2007. Diagnostic and prognostic value
of ambulatory ECG (Holter) monitoring in patients
with coronary heart disease: a review. In Journal of
Thrombosis and Thrombolysis, 23: 135-45.
Hamilton, P. S., Tompkins, W. J., 1986. Quantitative
investigation of QRS detection rules using the
MIT/BIH arrhythmia database. In IEEE Transactions
on Biomedical Engineering, BME-33:1157-65.
Malik, M., 2003. Assessment of T-wave morphology. In
Mayo Clinic Procedings, 78:18-20.
Martinez, J. P., Almeida, R., Olmos, S., Rocha, A. P.,
Laguna, P., 2004. A wavelet-based ECG delineator:
evaluation on standard databases. In IEEE
Transactions on Biomedical Engineering, 51:570-81.
Mittal, S., Movsowitz, C., Steinberg, J.S., 2011.
Ambulatory External Electrocardiographic
Monitoring: Focus on Atrial Fibrillation, Journal of
American College of Cardiology, 58:1741-1749.
Pan, J., Tompkins W. J., 1985. A real-time QRS detection
algorithm. In IEEE Transactions on Biomedical
Engineering, BME-32:230-6.
Sornmo, L., Laguna, P., 2006. Electrocardiogram (ECG)
signal processing. In Wiley Encyclopedia of
Biomedical Engineering, John Wiley & Sons, Inc
Stern, S., Tzivoni, D. and Stern Z., 1975. Diagnostic
accuracy of ambulatory ECG monitoring in ischemic
heart disease. In Circulation, 52:1045-9.
Tsipouras, M. G., Fotiadis, D. I., Sideris, D., 2002.
Arrhythmia classification using the RR-interval
duration signal. In Proceedings of Computers in
Cardiology, 29:485-88.
Vila, J. A., Gang, Y., Presedo, J. M. R., Fernández-
Delgado, M., Barro, S., Malik, M., 2000. A new
approach for TU complex characterization. In IEEE
Transactions on Biomedical Engineering, 47:764-72.
ECG ARTEFACT DETECTION ALGORITHM - An Algorithm to Improve Long-term ECG Analysis
333
