
CUSTOMIZABLE VISUALIZATIONS WITH
FORMULA-LINKED BUILDING BLOCKS
Mohammad A. Kuhail and Soren Lauesen
Software Development Group, IT University of Copenhagen, Rued Langgaards Vej 7, Copenhagen, Denmark
Keywords: Visualizations, Building Blocks, Customizability, Spreadsheet-like Formulas.
Abstract: One approach to visualization construction is to use complex blocks (widgets) that are tailored for specific
visualizations, and customize the visualizations by setting the properties of the widgets. This approach
allows fast and easy visualization construction but falls short if the user wants different appearance or
behaviour than what the widgets support. Another approach is to combine primitive graphical elements
using traditional programming or visualization toolkits. Traditional programming allows high
customizability, but it is time consuming and hard to develop advanced visualizations. Visualization toolkits
allow easier visualization creation in some cases, but customization and interaction are tedious. As an
alternative, we developed uVis visualization tool that uses spreadsheet-like formulas to connect building
blocks. uVis formulas can refer to building blocks and database tables. We created several advanced
visualizations, and compared our approach against others. Evaluation shows that our approach improved
customizability.
1 INTRODUCTION
Visualizations show data by size, color, shape, and
orientation. As users view and interact with
visualizations, they analyze data and derive insight
such as patterns, trends, clusters, and outliers
(Spense, 2007); (Meirelle, 2011). The exploratory
nature of data analysis requires that visualizations
support users in finding their way through data by
interacting with the visualization elements (Stolte
and Hanrahan, 2000). Ideally, every visual element
that makes the visualization is able to display
information when needed and disappear when
unneeded on user command (Ware, 2004).
Some visualization widgets allow easy and quick
visualization creation but do not support the
customization of each individual building block.
Some low-level Graphics APIs together with
traditional programming allow the customization of
individual building blocks. However, this could be
tedious and time consuming. Moreover, this
approach is not accessible to designers, visualization
creators with limited IT skills.
Some visualization toolkits such as prefuse and
Protovis provide useful abstractions for
visualization, but they do not support easy access to
relational data, and visualization creators are
required to have a solid programming background to
obtain high customization or interactivity.
To achieve a high level of customization, a
visualization needs to broken into basic building
blocks whose properties can depend on data. Hence,
we developed uVis, a tool with customizable
building blocks suited for visualization construction.
These blocks have properties, events, and functions,
and can create local data tables.
We constructed several advanced visualizations
using basic building blocks linked by spreadsheet-
like formulas. To further speed up the development
without sacrificing customizability, we designed
composite blocks that generate and link several basic
blocks that are still customizable.
To evaluate our approach, we created a custom
visualization with uVis and a popular visualization
tool, and compared customizability.
2 SOLUTION
The main goal of our solution is to support designers
with limited IT skills to design customizable
visualizations. To increase designer productivity, we
wanted to combine the convenience of widgets and
the customizability of basic blocks. Further, we
768
A. Kuhail M. and Lauesen S..
CUSTOMIZABLE VISUALIZATIONS WITH FORMULA-LINKED BUILDING BLOCKS.
DOI: 10.5220/0003863207680771
In Proceedings of the International Conference on Computer Graphics Theory and Applications (IVAPP-2012), pages 768-771
ISBN: 978-989-8565-02-0
Copyright
c
2012 SCITEPRESS (Science and Technology Publications, Lda.)
wanted to support the visualization of relational
data. To meet all these goals, we developed uVis
building blocks and formulas. The building blocks
are the visual elements that make up the
visualization, and based on data, the formulas
customize the appearance and behaviour of the
blocks.
2.1 uVis Building Blocks
uVis building blocks are the elements that make up a
visualization. They can be basic such as
TextBox,
Icon, Label, and Canvas or composite such as
ComboBox (figure 1). The latter can be made of a
combination of the formers. Blocks have built-in,
properties, designer properties, and event handlers.
Built-in Properties customize the block
appearance. As an example, a
TextBox has Top,
and
Left properties that customize position.
DataSource specifies how many block instances to
create, and bind these instances to data rows.
Designer properties are added by the designer to
retain data. For instance, a designer might write a
complex formula in a designer property and refer to
it from other properties rather than repeating it.
Block behaviour is defined by event handlers.
Events are triggered on mouse and keyboard user
actions. Event statements specify what happens
when an event occurs. For instance, a designer may
specify a box to show up upon clicking a visual
element in a graph.
With present tools, most of the properties have a
fixed value. For instance, the back colour of a
specific label can be set blue, and it can be
positioned at the top left of the screen. To make
these properties depend on data, some programming
is needed. With uVis, each property can be
customized by a formula that can refer to other
properties and data. When a property value changes,
formulas that refer to it automatically update the
values of properties they customize. In this way the
label back colour can depend on or more fields in
the data base and properties in other blocks.
2.1.1 uVis Basic Building Blocks
uVis basic building blocks provide minimal
functionalities, and can be used in many
visualizations.
uVis provides several kinds of basic blocks. We
explain them below.
Standard Input Blocks: Rather than designing all
blocks from scratch, we use standard
.NET input
controls such as
TextBox and Button.
Shapes: We designed a number of primitive shapes
such as
Line, Ellipse, and Box based on GDI+
drawings, but enabled them to function as
independent visual objects that receive mouse and
keyboard events.
Inspired by Cleveland (1985), we provide glyphs
such as triangles and stars. We also provide shapes
that are commonly used in visualizations. For
instance, a
Curve block connects several points.
However, the individual points are defined
separately, and they connect themselves to the curve.
This allows both curves and individual points to be
customizable. The
Tension property of a curve
specifies how the curve bends through the
coordinates of the connected objects.
2.1.2 uVis Composite Building Blocks
Composite building blocks comprise several basic
blocks and have a few properties that can
automatically specify properties of the basic blocks.
The designer can still customize the properties of the
individual basic blocks. Hence, visualization
construction is sped up and simplified without
compromising customizability. As an example,
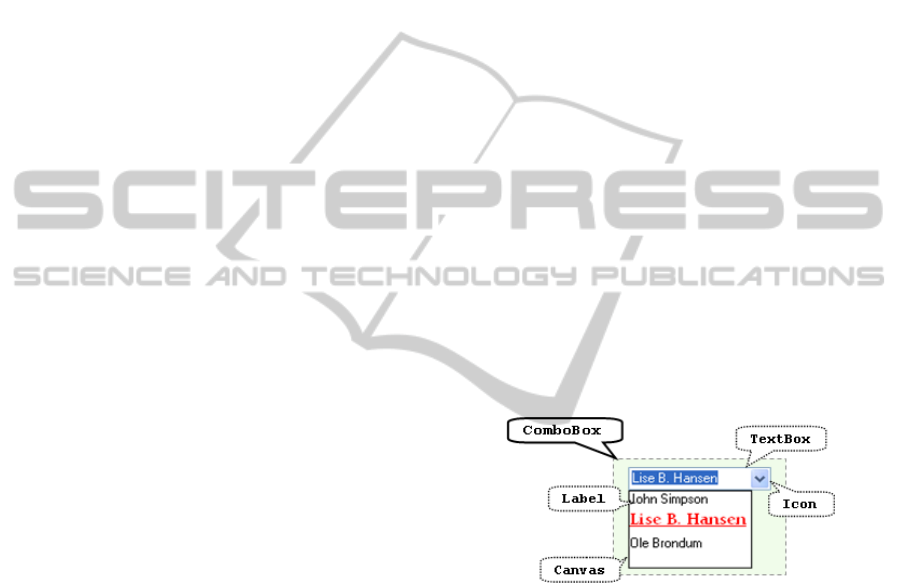
figure 1 shows a
ComboBox that shows a list of
patient names.
Figure 1: uVis ComboBox, a composite block. Comprised
blocks are illustrated with dotted callouts.
To create the ComboBox, the designer first set a
few properties of the
ComboBox that allowed the
block to refer to data and customize the general
appearance. As a result,
ComboBox generated
several basic blocks (
Label, Canvas, Icon, and
TextBox), and automatically specified them. The
designer set a few properties of the generated
Label
block to customize the appearance of the second
patient name (Lise B. Hansen).
2.2 uVis Formulas
Each block property may have a formula. Formulas
specify how to compute the property value for the
block. They are declarative and correspond to
CUSTOMIZABLE VISUALIZATIONS WITH FORMULA-LINKED BUILDING BLOCKS
769
spreadsheet formulas. Designers can customize the
appearance and behaviour of visualization blocks
with these formulas. They can refer to data fields in
database tables and local tables, properties and
functions of blocks. Rather than specifying one
block at a time, uVis formulas can specify multiple
block instances that are related to a data source. Let
us look at an example.
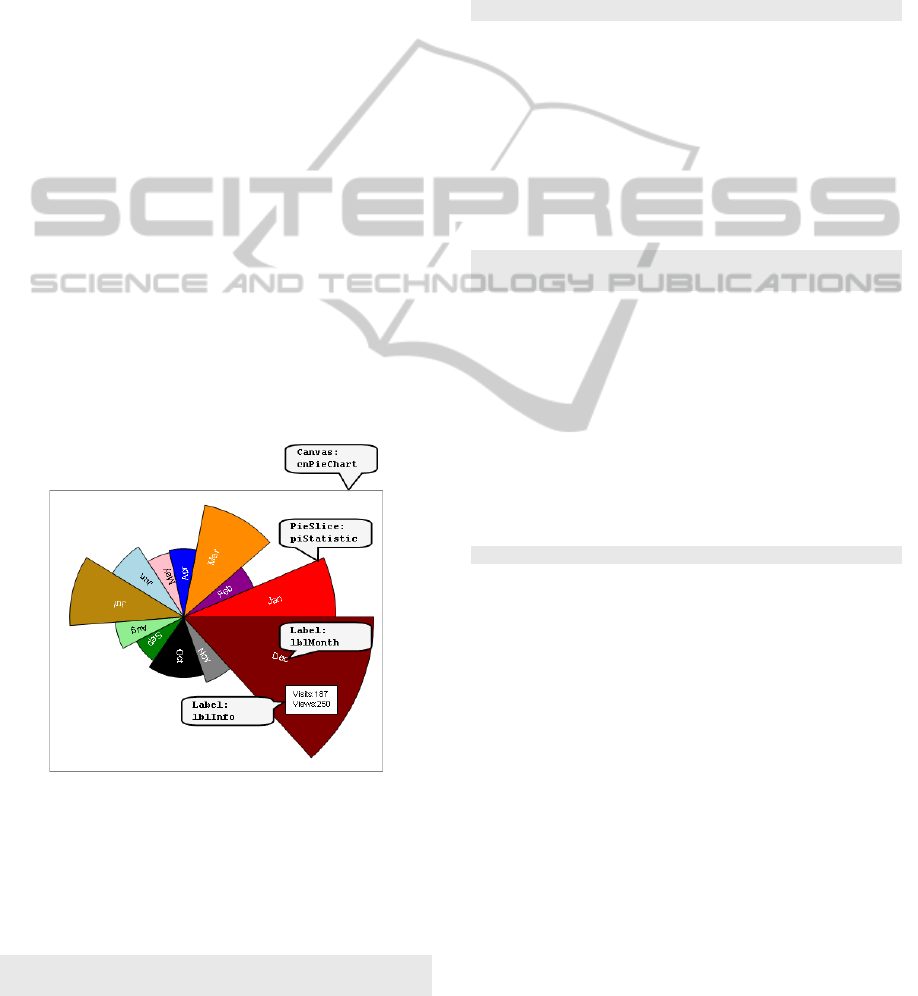
Example – Creating a custom pie chart with uVis.
Figure 2 shows a custom pie chart showing monthly
visits and views of a website. Pie slice angles
represent monthly visits of the website, and the radii
represent monthly views. When the end-user clicks a
pie slice, a message showing the visits and views in
numbers shows up. The data behind the
visualization resides in a database table
Statistics with fields views, visits, month,
and
year.
uVis Development Environment. To create a
custom pie chart, the designer dragged a
PieSlice
block from the toolbox, and dropped it in the design
panel. A property grid showing the PieSlice default
property values showed up.
The uVis environment is a what-you-see-is-a what-
you-get (WYSIWYG) environment. Thus, the
designer gets an immediate visual feedback in the
design panel as he specifies the property formulas.
Figure 2: A custom pie chart representing the monthly
visits and views of a website.
Multiple Instances per Block. To create PieSlice
blocks representing the monthly statistics, the
designer specified the
DataSource of block
piStatistic (of type PieSlice) in this way.
PieSlice: piStatistic
DataSource: Statistics where year=2010
uVis translates the DataSource formula into an
SQL statement, retrieves the corresponding record
set from the database and creates one block instance
for each row in the record set. Each instance is
bound to a row. Hence, the instance can access the
field values of the row.
Dynamic Formulas – Customizing individual
block instances. To let the angle of pie slices show
monthly visits, the designer specified
SweepAngle
in this way.
SweepAngle: 360*visits/SUM(visits)
The SweepAngle formula refers to visits, which
is a field in the table
Statistics. uVis evaluates it
for each
piStatistic instance. SUM(visits)
calculates the total monthly visits in the retrieved
records. The result of the
SweepAngle formula is
the angle measured in degrees.
To align the pie slices next to each other around
a circle, the designer specified StartAngle in this
way.
StartAngle: index=0? 0 : Me[index-
1]!StartAngle+Me[index-1]!SweepAngle
StartAngle means that if it is the first pie slice, the
value is 0, for the rest of the slices the value is the
previous slice's end angle.
Me is the current instance,
and
Index is the current instance's index in the
record set. Thus,
Me[index-1] is the previous
block instance. The formula retrieves the previous
instance’s
StartAngle and SweepAngle by means
of the
! operator, which refers to properties.
To let the pie slice radius represent the monthly
views, the designer wrote this formula.
OuterRadius: 200*views/ MAX(views)
MAX(views) calculates the maximum monthly
views in the retrieved rows. The result is the radius
measured in pixels and proportional to the area. The
longest radius is 200 pixels long.
3 EVALUATION
To evaluate our approach, we created a custom pie
chart using a popular visualization tool, Protovis and
evaluated how much it rates against uVis in these
dimensions.
1. Customizability. To what extent a designer can
customize the visual elements of a visualization.
2. Accessibility. To whom is the solution
accessible? Can a designer make the
visualization?
To create the custom pie chart in figure 2,
IVAPP 2012 - International Conference on Information Visualization Theory and Applications
770
Protovis uses a “
Wedge” block (pie slice), and
customizes its properties dynamically using
anonymous functions. The programmer retrieved the
data in a multi-dimensional array form. However,
rather than using a where clause to filter it (e.g. get
statistics where the year=2010), the programmer
filtered it using a for loop. The programmer
customized pie slices’ angles and radii according to
data using dynamic properties. Protovis has a default
implementation that calculates the end angle of
previous pie slice automatically. In uVis, we did it
by referring to the previous instance’s start angle
and sweep angle. Such referencing is not possible in
Protovis.
In conclusion, in Protovis it is necessary for a
visualization creator to have programming
knowledge (e.g. declare a variable, define a for
loop). Using basic blocks and dynamic properties
made it possible to customize individual basic
blocks without the need for loops.
In uVis, we created most of the custom pie chart
without real programming. The
DataSource was
filtered using a where clause in SQL style. The
properties were dynamically customized by
spreadsheet-like formulas that refer to data fields
and other properties. Using a basic block
(
PieSlice) allowed the customizability of
individual pie slices. To let pie slices respond to
click events, the designer needed to write three short
assignments. This is a light version of programming,
but we believe there is no way around it.
4 CONCLUSIONS AND FUTURE
WORK
In this paper we showed that it is possible to create
customizable visualizations by combining building
blocks linked with uVis formulas. This approach
allowed the customization of individual basic blocks
in the visualizations. However, the more advanced
the visualization, the more challenging the formulas
become for the designer.
We believe uVis can create a multitude of
advanced visualization, but this needs to be
investigated more deeply. We plan to implement
more advanced visualizations and look into how our
approach can support it. We are currently upgrading
uVis from a proof-to-of-concept visualization tool to
a more stable tool. This will enable us to evaluate
our approach with real designers. Moreover, we plan
to investigate to what extent interaction can be made
without real programming.
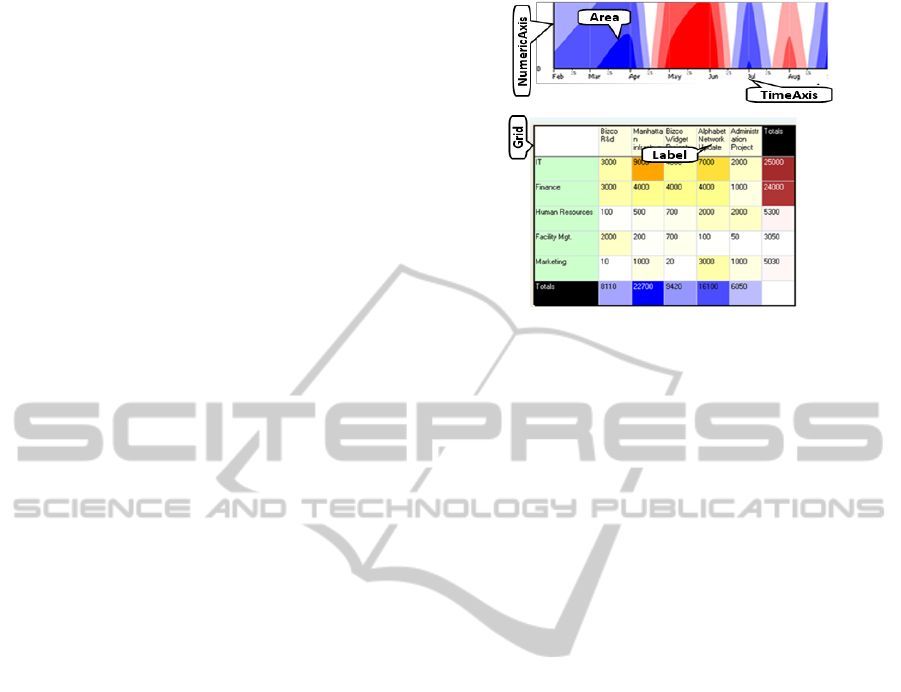
Figure 3: From top to bottom: Customizable visualizations
created with uVis: Horizon Graphs and Heat Map.
REFERENCES
Cleveland W. S., 1985. The Elements of Graphing Data.
Pacific Grove, California: Wadsworth Advanced Books
and Software.
Meirelle, I., 2011. Visualizing data: new pedagogical
challenges. Selected Readings of the 4th Information
Design International Conference. São Paulo: SBDI |
Brazilian Society of Information Design.
Spense, R., 2007. Information Visualization: Design for
Interaction. 2nd ed. Prentice Hall.
Stolte C., Hanrahan P., 2000. Polaris: A System for Query,
Analysis and Visualization of Multi-dimensional
Relational Databases. October 2000. Utah: IEEE
Information Visualization.
Ware C., 2004. Information Visualization: Perception for
Design. 2nd ed. Morgan Kaufmann.
CUSTOMIZABLE VISUALIZATIONS WITH FORMULA-LINKED BUILDING BLOCKS
771
