
A USER CENTRIC APPROACH TO THE DEVELOPMENT AND
TESTING OF A HOME ENERGY MANAGEMENT SYSTEM
Jeroen Stragier
1
and Jan Derboven
2
1
Interdisciplinary Institute for Broadband Technology – Research Group for Media and ICT (IBBT-MICT)
Department of Communication Sciences, Ghent University, Korte Meer 7-9-11, 9000, Ghent, Belgium
2
Interdisciplinary Institute for Broadband Technology – Centre for User Experience Research (IBBT-CUO)
Faculty of Social Sciences, Katholieke Universiteit Leuven, Parkstraat 45 bus 3605, B-3000, Leuven, Belgium
Keywords: Home Energy Management, Smart Grids, Smart Metering.
Abstract: The development and small scale field trial in Flanders of a home energy management system is presented.
During the development, a user-centric approach was used to create interaction between developers and
possible end-users in a living lab setting. This allowed actively addressing people’s needs and wants in the
development process and testing the system in their homes. The preliminary results of the field trial indicate
a high usage during the starting week, which gradually slows down over the weeks that follow. Usage of the
different elements in the system varies over the weeks but a consistent “top 3” of elements remains.
Dynamic pricing is used by a small but consistent part of the participants. They actively adapt their
appliance usage to these prices.
1 INTRODUCTION
Smart grids are high on the agenda. While the focus
of the benefits of these improved electricity
infrastructures are mainly on the technical and
structural side, end-users and more specifically
households can also benefit from the new
possibilities of smart grids and especially smart
meters that are to be installed in their houses. These
new meters can provide the end-user with detailed
information on their energy use, something that
many households find lacking today. Moreover,
many studies have indicated that information or
“feedback” is indeed an effective means to create
awareness and possibly reduce energy use. Not only
information on energy use can be improved, new
energy pricing strategies can be developed, such as
dynamic pricing, in which varying electricity prices
can be used over the course of the day, with e.g.
high prices at peak moments and low prices at off-
peak moments. The delivery of detailed information
to the end-user can be done in many ways starting
with e.g. more detailed billing over online
monitoring portals to full scale home energy
management systems. This paper presents a user-
centric approach to the development of a home
energy management system. The research involved
the constant interaction between system developers
and the panel of users, whose input was of vital
importance to the development of the system, in a
living lab setting. Stahlbrost (2008) defines a living
lab as a “human-centric research and development
approach in which IT-systems are co-created, tested,
and evaluated in the users’ own private context”.
This has been the main approach from the start of
the development to the final testing. Currently, a
small scale field trial is in progress in the homes 21
families in Flanders, Belgium. Preliminary results on
usage of the developed system are presented.
2 EFFECT OF FEEDBACK ON
ENERGY USE
Feedback can have a positive effect on a households
energy use, as research has indicated many times
(Darby 2006; Dobson and Griffin 1992; Fischer
2008; Froehlich 2009; Ueno et al. 2006; Wood and
Newborough 2003). It provides users with
information on the results of the energy efficiency
measures taken. Home energy management systems
can be an effective means to provide tailor-made
185
Stragier J. and Derboven J..
A USER CENTRIC APPROACH TO THE DEVELOPMENT AND TESTING OF A HOME ENERGY MANAGEMENT SYSTEM.
DOI: 10.5220/0003948101850190
In Proceedings of the 1st International Conference on Smart Grids and Green IT Systems (SMARTGREENS-2012), pages 185-190
ISBN: 978-989-8565-09-9
Copyright
c
2012 SCITEPRESS (Science and Technology Publications, Lda.)

feedback to households. Evidence for this has been
found in several experiments in which feedback was
provided to household by means of computer
systems or in-home displays (e.g. Brandon and
Lewis 1999; Ueno et al. 2006) ). However, although
the effect of feedback of energy use on behaviour
has been indicated by many studies, similar studies
also argue that its effect on behaviour and awareness
is likely to fade away when no further feedback is
provided (for instance, when proof-of-concept
technology is removed from the house). This implies
that giving feedback on energy use does not
necessarily lead to long-term changes in the users’
behaviour. Darby (2006) argues that continued
feedback is necessary to create persistence in the
change of behaviour. Home energy management
systems offer an excellent means to provide end-
users with persistent feedback on their energy use.
3 USER CENTRIC
DEVELOPMENT OF THE
SYSTEM
In this section, the methodology and the results of
the user research are presented. The research part
first presents the actual user research consisting of a
description of the field research, and the further
(both qualitative and quantitative) analysis of the
field data. Preliminary results of a currently ongoing
field trial are subsequently presented.
3.1 User Research
3.1.1 Large Scale Survey
As a first step in the actual user research, an online
survey was held with a representative sample in
Flanders. The sample collected through this survey
would form the base of recruitment for the next
phases of the research. In the survey, structural,
behavioural and attitudinal data regarding energy
use in a domestic situation was collected. This
resulted in a database (N=1314) containing
information of the panel members on e.g. their type
of house, level of insulation of the dwelling, how
consciously they’re using energy, their
environmental attitude and so on. A number of
questions addressed the degree to which they already
monitor their energy use by keeping e.g. excel files
containing meter readings or by using existing tools.
We also asked how likely they would be to buy
devices helping them to monitor e.g. their electricity
use. From the database of the quantitative survey, a
list of interesting respondents was compiled to be
contacted for further participation in the
development.
3.1.2 Diary Study
In total, 30 households agreed to participate in the
diary study. This study was conceived as a small
snapshot of the participants’ daily energy use habits.
To get this snapshot, the interviewees were asked to
keep a diary during two weeks. Use of electrical
appliances, heating settings, bathing frequency,
specific actions taken to lower energy use, general
behaviour, such as talking about energy use,
searching for information, etc. were registered in the
diary. In order to make this as easy as possible to fill
in, a diary template was distributed to the
participants. In the templates, they were asked to fill
in a general section (especially heating settings that
are rarely altered), a daily section with a 24 hour
time window to specify when an appliance was used,
and a weekly section which primarily contained
questions asking about the participant’s general
behaviour during the past week (e.g. searching for
information about energy use, registering of meter
readings etc.). The daily section was the core part of
the diary. A 24-hour time window was provided in
the template to the participants. Per appliance used
during the day, start and end time of the use was
recorded down in the diary.
The diary offered insights in the participant’s
routines and in the reasons participants have for their
specific behaviour. Often it was observed that
people’s behaviour roots deeply in their specific
home and family situation. A quite obvious
observation from the diaries was that the general
family and housing situation has a very profound
impact on people’s energy related behaviour. Apart
from obvious differences based on specific family
and housing situations, differences in energy-related
behaviour often come down to quite small details in
behaviour. A lot of energy saving methods are that
common that almost everyone has the same energy
saving behaviour, for instance drying laundry
outside instead of using the tumble dryer when the
weather is good, or only turning on the dishwasher
when it’s full. Participants that went one step further
often focused on small improvements, such as
unplugging specific devices to reduce phantom
power. Only few participants took more drastic
measures to reduce their energy use, such as
consciously not owning/using energy devouring
appliances such as dishwashers or microwave ovens.
Often, luxury considerations prevent people from
going further in energy efficiency.
SMARTGREENS2012-1stInternationalConferenceonSmartGridsandGreenITSystems
186

3.1.3 Scenario Evaluation
All participants from the diary study agreed to
participate in a subsequent interview. The main topic
of the interview was the discussion of four scenarios
containing different functionalities of a home energy
management system. These scenarios were
developed based on the results of a market overview
and the input gathered in the diary study. They can
be seen as sort of a first product proposal. In these
scenarios several possibilities such as user feedback
and automated control were illustrated by means of a
fictitious family. The first scenario illustrated basic
applications of a smart meter such as detailed
billing. The second scenario elaborated more on
creating awareness of energy use (on a global level
for the household) by means of visualization through
mood lights, PC or smart phones. The third scenario
went more into detail and discussed feedback on
appliance level. Feedback in this scenario was
visualized through an in-home display. The fourth
and most advanced scenario illustrated the
possibilities of home automation in relation to
energy use.
Although it has to be noted that the participants
were quite positive about most of the applications in
the scenarios, they generally preferred scenario 3.
Scenario 1 was a scenario on which they agreed that
it presented basic information that “should be
standard” - of course with today’s mechanical
meters, this is quite impossible. This scenario
offered the least added value to their present
situation. The advantage of scenario 3 over scenario
2 was the level of detail. Whereas scenario 2 was
limited to a visualization of overall meter readings
on the computer screen, scenario 3 added the in-
home display as a means of easy access to the data
and, more importantly, added more detail as it
showed the energy use per appliance. This last
feature was something that was clearly appreciated
by the participants as indicated by the following
quote:
“The increased level of detail really gives a
lot of added value. As long as the data is on
an overall level, it’s all interesting and you
might start thinking about it somewhat, but
I don’t think you will act on it, as you don’t
know where the problem is.”
3.1.4 Interface Design
The design process of the application consisted of
several stages. Besides the ethnographic data,
respondent interviews and qualitative data gathering
presented above, participatory design techniques
were used to involve end users in the actual design
of an energy management system (Schuler and
Namioka 1993). A total of 2 focus group discussions
(N=8) were held with members from our research
panel.
Focus group sessions allowed for a creative
approach. After an introduction and discussion of
the concept of home energy management,
participants were asked to design an energy
management system that would meet their needs. To
do this, participants received pencils, paper and cut-
out graphics and icons to design their system from
scratch.
In a final stage, the user research data, together
with the participatory design results were used to
create the design of the final smart application for
smart phones and tablets. The final application
design includes a competition-style home page, in
which users can compare their energy use of the
present day to that of the day before.
This allows users to see whether they are doing
better or worse, and can trigger them to try to do
better. In this way, the competition-style home page
can be seen as a quick, one-glance self-monitoring
screen that can persuade its users to try to do better
than the day before (Fogg 2003). Besides navigation
buttons, the home screen also offers a direct link to
relevant system messages about the users’ current
energy use, such as changing energy tariffs,
information about appliances that remain switched
on upon leaving the house, etc.
Beyond the home screen, users can access more
detailed information, such as detailed graphs with
their energy use and energy prices, estimates of the
yearly energy bill, etc. Apart from visualising and
comparing usage information, the system gives users
advice on their energy use behaviour in the system
messages, and warns them when an energy use
threshold has been reached.
4 FIELD TRIAL
The developed system was installed in 21 homes
spread out over Flanders, the Dutch speaking part of
Belgium. The households were selected from the
project panel. They were contacted asking for their
participation in the project. A total number of 43
households were contacted of which 21 agreed to
participate. An initial visit was scheduled in
September with the participants to explain the
purpose of the field trial, assess the applicability of
the dwelling (not every house was suitable for the
installation of the system) and consequently
AUSERCENTRICAPPROACHTOTHEDEVELOPMENTANDTESTINGOFAHOMEENERGYMANAGEMENT
SYSTEM
187
concretize what measures would have to be taken in
order to get the system installed. From October 17
th
until November 17
th
2011, a second appointment
was made with the participants for the actual
installation of the system in their homes. The
installation supports the measurement of the total
electricity use in the house, a number of sub
measurements of specific appliances or circuits and
in some cases a measurement of the gas use. The
total electricity measurement is possible through the
installation of a modern smart meter. The
submeterings take place in the fuse box of the
participant. Metering modules measure the current
and voltage of the circuits that the participant wants
to be able to monitor (up to 6 submeterings). The
impact on the existing electricity installation of the
house is limited because of the use of current clamps
that can be clicked around the conductor. If the
existing gas meter has a so called pulse output, the
gas use in the house can be monitored through a
module that counts these pulses. The smart meter
and the metering modules send their measurements
to the database in the home energy controller (HEC).
This HEC is incorporated into the home network and
has an internet connection. The user interface of the
system connects with the HEC through WLAN.
Since the actual technical installation of the system
is not the aim of this paper, we will not elaborate
any further on this. As a user interface to interact
with the system, the participating households were
given either an Android based tablet or smartphone.
The field trial started November 17
th
2011 and is
scheduled to end March 31
st
2012 (although
continuation is possible). The purpose of the field
trial was to get insights into the interaction of the
participating households with the system. To do this,
the following research design was set up:
1. A weekly questionnaire
2. A monthly questionnaire
3. A three monthly in-home interview with
the participants
Currently, 8 weekly questionnaires and one
monthly questionnaire have been sent out to the
participants. The scheduling of the first interview is
in progress at the moment of writing. The weekly
questionnaires are sent out at the last working day of
each week.
The weekly questionnaire is a short online
survey containing questions on basic use of the
applications such as whether or not they used it, how
many times per week, at which moment they mostly
use it, and of course, which of the features they use
the most.
The monthly questionnaire is a longer version of
the weekly survey. It allows to go more into depth
on issues identified in the weekly questionnaire and
their actual usage and liking of the different
elements included in the application. The following
section of the paper will summarize the results of
both questionnaire types. We will not go into detail
on the results of every question asked, but try to
summarize the general trends seen in the use of a
home energy management system. Since the field
trial runs for approximately six months only, our
focus is not on the actual potential of the system to
lower the energy use of the participating families,
but more on the way they interact with the system.
4.1 Preliminary Results
4.1.1 Application Features
Most of the participants consult the system at least
once a week. The frequency of consulting less
frequent however over the weeks (the percentages in
the figures have to be interpreted with caution given
the small scale of the field trial).
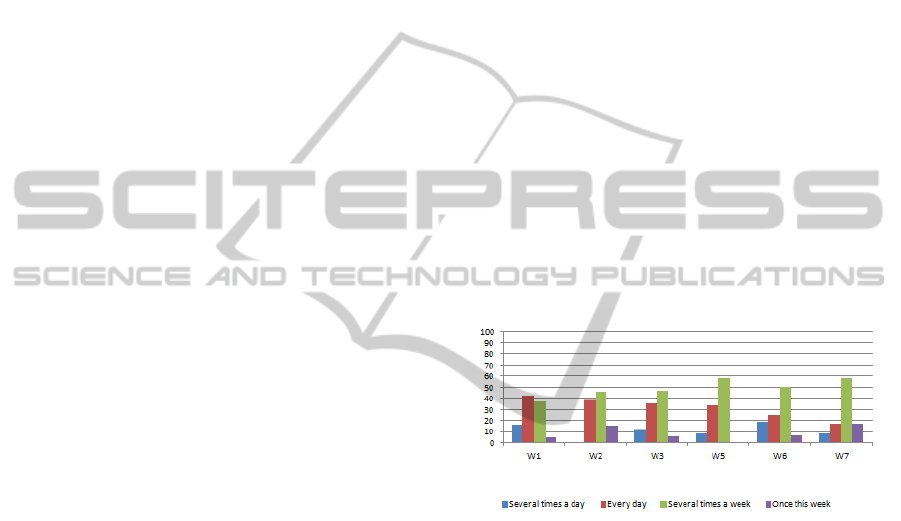
Figure 1: Degree to which the application is consulted
(week 1 to week 7, in %).
Figure 1 indicates that the proportion of respondents
that consult the app every day gradually reduces
over the course of the weeks (In week 4, the monthly
questionnaire was sent out. No data about weekly
use was collected in this week). The novelty aspect
of the system seems to fade out somewhat. The
share of participants consulting the app several times
a week instead, increases over the weeks.
The participants don’t quite have a fixed moment
at which they consult their energy usage data. Most
of them consulted the application quite randomly at
the start of the field trial. Over the course of the
weeks however, this is clearly showing a downward
trend. More participants seem to find somewhat
fixed moments to consult their data. However, we
need to be careful with interpreting these trends.
Results from weekly surveys in the next weeks will
provide more insights. During weekdays the app is
SMARTGREENS2012-1stInternationalConferenceonSmartGridsandGreenITSystems
188

mostly consulted in the evening, whereas during the
weekend, day-time consultations are seen far more
frequently.
An important question is of course what the
participants are doing with the application? What
elements do they use the most? According to the
answers of the participants, in the first week after
installation in their homes, most of the elements in
the system were tested. A top 3 of elements that
remained quite consistent over the weeks that
followed were “Checking my current energy use”,
“Following the energy use of my appliances” and
“Checking my historical energy use” (at that
moment only the previous days were consultable
however). Although these three elements remain the
most consulted ones in the field trial, the share of
“Following the energy use of my appliances”
gradually dropped over the weeks. Apparently, once
people know what an appliance uses, their attention
to this element seems to fade out. Two other
elements that were highly consulted were “Checking
my stand-by electricity use” and “Real-time
following of the electricity use of an appliance”. The
attention to this element also faded out over the
weeks. A growing attention was paid to “comparing
my current energy use to the past days/weeks” over
the course of the weeks.
In the first monthly online survey, more specific
questions were asked on the usage of some elements
in the application that are less frequently used: the
estimation of the yearly electricity bill, the
possibility to impose usage limits and the making of
comparisons between days, weeks or months.
The app provides the user with a comparison of
his energy use with that of the day before.
Depending on the difference between two days, a
green or a red smiley is shown in the application,
indicating a better or worse situation than the day
before. When asked if they believe that the
comparison with the previous day is correct, most of
the participants state that they do so. The question
that is often raised however is whether the
comparison is a relevant one. A comparison of a
Sunday with a Monday for example, is a comparison
of two worlds to some participants (a day where
everybody is at home all day versus a working day).
When asked what type of comparison they would
prefer, comparing a week with the previous one
seems to be more to the liking of the participants.
Given the fact that daily consultation of the
application doesn’t seem to be common with our
participants, this might indeed be a better way of
comparing.
The application also provides the possibility to
get an estimation of the annual electricity bill. 13 of
the participants state that this is a feature they use.
Only half of them however, believe that the
estimation is in fact an accurate one. The main
reason for this is that most of the participants are
aware that the prices used in the field trial are
fictitious. Others have questions on whether the
system uses relevant parameters such as seasons in
its calculation of the bill. One respondent however
gives the interesting remark that when dynamic
prices would in fact be used in the future, the
estimation would come in very useful as it would be
very difficult to make that estimation on your own.
Finally, imposing a (non-binding) limit to their
energy usage per day was considered not to be used
by the participants. Only two of the participating
households indicated to use the usage limit.
4.1.2 Dynamic Prices
Every day, the respondents are provided with new
electricity prices for the next day. When asked if
these prices have an influence on the moment of use
of their electrical appliances, 8 out of 21 participants
state that they do. Indeed, a small, but consistent part
of them actively adapt the use of certain appliances
to these dynamic electricity prices, as is seen in both
the weekly as well as the monthly questionnaire. The
appliances that are often shifted in accordance to the
dynamic prices are typically those with a large
flexibility such as dishwasher, washing machine and
tumble dryer.
The participants were asked to give a specific
example of a situation in which they shifted their
electricity use in accordance with the electricity
prices and a situation in which they didn’t. The
responses to these questions are quite
straightforward. While the answers to the first
question (a situation in which they did) are not
surprising and mostly related to shifting of the
appliances indicated above, the reasons why
someone wouldn’t are more related to the relative
inflexibility of cooking and watching TV or using
the personal computer. Other reasons not to use the
dynamic prices are forgetting to set timers or just
being in a situation where an appliance has to work
at that moment and can’t be shifted.
5 CONCLUSIONS
This paper presents a user-centric development of a
home energy management system and the
preliminary results of the ongoing field trial. The
user-centric approach has proven to be very useful in
the development stage. Constant feedback from user
AUSERCENTRICAPPROACHTOTHEDEVELOPMENTANDTESTINGOFAHOMEENERGYMANAGEMENT
SYSTEM
189

research was incorporated into the development. The
preliminary results indicate that while the first weeks
of the field trial were marked by a high application
consulting rate of the participants, this decreased
somewhat in the weeks that followed. It was clear
that the amount of daily consulting gradually
decreases in favor of weekly consulting. Day to day
comparisons of energy use doesn’t seem to be the
most interesting base of comparison. Week to week
comparing is indicated as a more interesting base.
Estimations of yearly bills are found interesting,
despite the fact that the prices provided in our setting
are not delivered by the energy supplier and
therefore not accurate. Because some of the
participants were clients with another energy
supplier than the one that is a partner in the project,
fictitious prices had to be used. It is indicated that
these calculation modules will be of great interest
when dynamic prices are in fact on the market.
These pricing strategies will make it very difficult
for the end user make decent estimation of their
yearly bill. Approximately one third of our
participants are currently to some degree adapting
their electricity usage in accordance to the dynamic
prices that are being provided the day before.
Shifting of usage mostly implies appliances with a
certain degree of flexibility such as washing
machines and dishwashers. Those who don’t adapt
their electricity use to these tariffs indicate that this
is mainly because of not being at home at the time of
low prices. Automation will be an important
function of home energy management in the future,
especially when using dynamic prices. The small
scale of the field trial makes overall conclusion
somewhat difficult, but still, general trends are
detectable. The personal interviews are currently in
the process of being scheduled, and will certainly
attribute to insights on the use of the system within
the households and its influence on household
dynamics and routines with regard to energy use.
ACKNOWLEDGEMENTS
The IBBT SmartE project is a project co-funded by
IBBT (Interdisciplinary institute for Technology). A
research institute founded by the Flemish
Government. Companies and organizations involved
in the project are IBBT, IBBT-iLab.o UGent-MICT,
UGent-IBCN, KULeuven-CUO, KULeuven-ESAT-
Electa, VITO, VUB-SMIT, Telenet, SPE-Luminus,
Alcatel-Lucent Bell, Niko, Ferranti and Xemex, with
project support of IWT.
REFERENCES
Brandon, Gwendolyn and Alan Lewis. 1999. "Reducing
Household Energy Consumption: A Qualitative and
Quantitative Field Study." Journal of Environmental
Psychology 19(1):75-85.
Darby, S. 2006. "The effectiveness of feedback on energy
consumption: A review for DEFRA of the literature on
metering, billing and direct displays." In
Environmental Change Institute, University of Oxford.
Dobson, J. K. and J. D. Griffin. 1992. "Conservation effect
of immediate electricity cost feedback on residential
consumption in behaviour." In 7th ACEEE Summer
Study on Energy efficiency in Buildings. Washington
DC.
Fischer, Corinna. 2008. "Feedback on household
electricity consumption: a tool for saving energy?"
Energy Efficiency 1(1):79-104.
Fogg, BJ. 2003. Persuasive technology. Using computers
to change what we think and do: Morgan Kaufmann:
San Francisco, CA.
Froehlich, J. 2009. "Promoting Energy Efficient Behaviors
in the Home through Feedback: The Role of Human-
Computer Interaction." In International Conference on
Human-Computer Interaction. San Diego.
Pierce, J. and D. Roedl. 2008. "Changing energy use
through design." interactions 15(4):6-12.
Schuler, D. and A. Namioka. 1993. Participatory design:
Principles and practices: CRC / Lawrence Erlbaum
Associates.
Ståhlbröst, A. 2008. "Forming future IT: the living lab
way of user involvement." Luleå University of
Technology
Ueno, Tsuyoshi, Fuminori Sano, Osamu Saeki and
Kiichiro Tsuji. 2006. "Effectiveness of an energy-
consumption information system on energy savings in
residential houses based on monitored data." Applied
Energy 83(2):166-183.
Wood, G. and M. Newborough. 2003. "Dynamic energy-
consumption indicators for domestic appliances:
environment, behaviour and design." Energy and
Buildings 35(8):821-841.
SMARTGREENS2012-1stInternationalConferenceonSmartGridsandGreenITSystems
190
