
An Electrocardiogram (ECG) Signal Processing Algorithm for Heart
Parameters Estimation based on QRS Complex Detection
Lorenzo Piazzo
1
, Francesco Delli Priscoli
2
, Guido Oddi
2
, Donato Macone
1
and Silvano Mignanti
2
1
Dipartimento di Ingegneria dell’Informazione, Elettronica e Telecomunicazioni,
University of Rome "Sapienza", Rome, Italy
2
Dipartimento di Ingegneria Informatica, Automatica e Gestionale, University of Rome "Sapienza", Rome, Italy
Keywords: Signal Processing, ECG, QRS Complex Detection, Bravehealth.
Abstract: This paper presents an algorithm able to estimate heartbeat parameters, based on a QRS complex detection.
The proposed algorithm demonstrates to be able to recognize heartbeat parameters even in highly noisy
situations, i.e. where the ECG signal is extremely disturbed. Furthermore the algorithm was tested on real
ECG signals generated by a so called Wearable Unit, a complex bio-signals sensor being developed by
STMicroelectronics within the Bravehealth ICT FP7 EU funded project.
1 INTRODUCTION
Heart failures, strokes, anginas: there is a plethora of
diseases a heart could suffer: up to now, patients
affected by cardiovascular diseases were usually
forced to continuously monitor their heart status
going to hospitals for the usual, quite invasive,
electrocardiography and similar analyses. The
Bravehealth (ICT FP7 European Commission, under
Grant Agreement no. 248694) project intended to be
an advancement in this respect, developing a
telemedicine system able to remotely monitor heart
status of patients with cardiovascular diseases and,
in case of abnormal situations, alert caregivers and
patients with enriched information status.
In order to reach this challenging result a so
called Wearable Unit (WU) has been developed in
the framework of the Bravehealth Project: this unit
consists in an extremely integrated system and is
composed by several sensors (electrocardiogram –
ECG, temperature, 3-axis motion, pulse-oximetry,
etc.) in a “plaster” to be positioned on the chest of
the patient in correspondence with the heart. Such a
WU is not only designed to forward raw data to a
remote management centre, but also to provide on-
board pre-processing of the acquired signals, in
order to pre-filter, pre-analyse and pre-process such
a raw data (an interesting example could be to
supply visual alerts directly on the unit itself).
This paper focuses on an approach for the estimation
of heartbeat parameters, based on the QRS complex
detection. The work reported was partially
performed in cooperation with STMicroelectronics
(STM) within the already mentioned Bravehealth
project: a valuable contribution of this paper is to
apply the proposed algorithm to real ECG signals
produced by the WU. This paper is organized as
follows. Section 2 reports a description of the typical
ECG signal and an analysis of the state of the art
about the QRS complex detection. Section 3 shows
the proposed ECG signal processing chain. Section 4
illustrates the proposed QRS Detector Unit and
Section 5 reports the results of the tests applied to
real signals coming from the WU developed by
STM. Brief conclusions are drawn in Section 6.
2 STATE OF THE ART
An electrocardiogram (ECG) signal is the expression
of the myocardium electrical activity, measured on
the body surface: it could be considered as a nearly
periodic signal. The ECG signal contains a lot of
information about heart status and possible diseases.
In the medical tradition, the ECG signal cycle is
labelled using alphabetical letters, namely the letters
P, Q, R, S, and T for the individual peaks of the
whole cycle waveform (see Figure 1). In the
flagging step, diagnosis about heart status and
possible diseases is usually performed based on
features extracted from the timing and morphology
249
Piazzo L., Delli Priscoli F., Oddi G., Macone D. and Mignanti S..
An Electrocardiogram (ECG) Signal Processing Algorithm for Heart Parameters Estimation based on QRS Complex Detection.
DOI: 10.5220/0004209602490252
In Proceedings of the International Conference on Biomedical Electronics and Devices (BIODEVICES-2013), pages 249-252
ISBN: 978-989-8565-34-1
Copyright
c
2013 SCITEPRESS (Science and Technology Publications, Lda.)

of the points indicated with those letters. The ECG
signal analysis is crucial for the doctors to generate a
correct clinical diagnosis (Kohler et al., 2002).
Figure 1: ECG waveform: (1) P wave; (2) QRS complex;
(3) T wave; (4) PR interval; (5) QRS interval; (6) QT
interval; (7) ST interval;(8) PR segment; (9) ST segment;
(10) R–R interval (or beat); (11) cardiac cycle (including P
wave, QRS complex, and T wave).
The QRS complex detection of ECG signal has
been researched for the past four decades. According
to the medical definition (Rangayyan, 2001); (Silipo
et al., 1998), the most important information about
ECG signal is almost concentrated on the P wave,
the QRS complex and the T wave. These data
include the positions and/or the magnitudes of PR
interval, QRS interval, QT interval, ST interval, PR
segment and ST segment (see Figure 1). In
particular, QRS detection is quite difficult, since
several issues might be present, such as noise,
power-line interference, and the similarity between
the T wave amplitude and the QRS complex. A lot
of proposals of QRS complex detection algorithms,
introducing solutions to the previously mentioned
problems, have been investigated. For example, in
(Pan et al., 1985), an algorithm (called PT method)
is depicted, which recognizes QRS complex,
through the analysis of positions and magnitudes of
sharp waves using a digital band pass filter to reduce
the false detection of ECG signals. In (Benitez et al.,
2001); (Vijaya et al., 1998); (Keselbrener et al.,
1997); (Dokur et al., 1997); (Afonso et al., 1999)
digital filters were used to detect and classify ECG
signal in time and frequency domains, while (Suarez
et al., 2007) proposed a “Geometrical Matching
Approach” to find the ECG beat. Finally, (Yeha et
al., 2008) proposes a “Difference Operation
Method” for detecting the QRS complex.
3 ECG SIGNAL PROCESSING
The proposed ECG signal processing chain is
composed by three main units (as depicted in Figure
2): the flagging unit, the filtering unit and the QRS
detection unit.
Figure 2: ECG signal processing chain.
In the flagging step, the input signal is analysed
to detect corrupted parts, e.g. a saturated signal. The
result of the analysis is a vector of signal flags that
can be used by the rest of the processing steps. In the
filtering step, a linear pass-band filter is applied to
the signal. The filtering is carried out in the
frequency domain by computing the Fast Fourier
Transform (FFT) of the whole signal, by
multiplication with the pass band response and
taking the inverse FFT of the result. Finally, in the
QRS detection step, the signal is analysed to identify
and mark the peaks of the QRS complexes. Both the
flagging and the filtering steps are quite standard
and they will not be described in this paper. Instead,
the core of the ECG processing, the QRS detection
algorithm, will be described in the next Section.
4 QRS DETECTOR UNIT
The proposed detector is based on correlation: the
detector can be seen as an adaptive matched filter
detector. The algorithm maintains a correlation
template of 2 1 samples, where
/
and: (i) round(.) means the rounding
to the nearest integer operation; (ii) F
s
is the
sampling frequency; (iii)
is the template half
length in sec. The template is denoted by t
i
, for
,…, and represents an estimate of the
waveform segment centred on the QRS complex.
The algorithm maintains an estimate of the current
heart period, denoted by T
h
, measured in samples.
Given the input ECG signal, denoted by x
n
for 1,…,, the detector produces a sequence of
indices of estimated positions of the QRS peaks. The
sequence of peaks positions is produced as follows.
Given the position of the last identified QRS peak,
denoted by P
m
, the positions ranging from
0.5
to
1.5
are considered as candidate for the next peak. From
each of these positions a signal segment of length
2 1 is extracted and the mean subtracted
segment is correlated with the template. Formally,
for the candidate in position J: (i) the segment
is
,...,; (ii) the mean
BIODEVICES2013-InternationalConferenceonBiomedicalElectronicsandDevices
250

is1/∙
∑
, and (iii) the correlation
is
∑
̅
. The index of the candidate
yielding the highest correlation, denoted by P
n
, is
selected as the new peak position and the
corresponding segment, denoted by
,..., is stored. Every time that a
new peak position P
n
is produced by the correlation
cycle just described, the following steps take place.
The peak position is refined by setting P
n
equal to
the position of the maximum of the segment s
i
and
the segment is updated as
,...,. This is done in order to lock the template
center on the maximum of the QRS complex. Next,
the template, the peak position and the heart period
are updated according to the following equations:
←
1
̅
, ,…,
(1)
←
1
(2)
←
(3)
where
0.7 and
0.5 are the forgetting
coefficients. Finally, the newly produced T
h
is
checked against a minimum and a maximum value,
T
min
and T
max
, and, if it is outside the range, it is set
equal to the exceeded limit. Let us now discuss the
algorithm initialization. This is accomplished by
setting the first peak at the maximum of x
n
for
1,…,
, i.e. the maximum of the first two
seconds of the signal. The template is initialized to
the signal segment of length 2 1 centered on the
first peak and the heart period is initialized to
0.8
. The procedure outlined above can get stuck
on a false peak, lower than the QRS peak, especially
when the template length is short. To avoid such
aproblem it is sufficient to maintain and additional,
longer template, representing the whole heartbeat.
The beat template, denoted by
for 0,1, …, is
initialized to zero and is updated at every beat
detection, using the segment
for
0,1, … ,
. The update rule is the following:
←
1
, ∈ 0,
1
(4)
and guarantees that the beat template has its peak in
0 as long as the QRS peak is correctly detected.
When the algorithm is stuck to a lower peak, the
maximum of the beat template will not be in 0
anymore. When this situation is detected, the last
estimate is shifted in order to match the maximum of
the beat template and the correlation template
reinitialized. In conclusion, the algorithm is able to
produce a sensible measure of the quality of the beat
detection, namely the correlation coefficient
between the template and the extracted signal
segment. The computational complexity for
processing an ECG file with N samples is easily
evaluated to be 2 multiply-add operations.
5 RESULTS
The ECG processing chain was implemented in
MATLAB and tested on two signals, produced by
the Wearable Unit prototype. The two signals were
selected as worst cases, being them affected by
disturbances like power line interference and
movements artifacts. The first signal was severely
affected by power line disturbances and, by studying
its spectral content, strong peaks were identified at
frequencies as low as 22 Hz. Therefore the filter was
selected as a band-pass filter with raising edge
between 0.1 and 0.5 Hz and falling edge between 17
and 20 Hz. The rising and falling parts were a raised
cosine junction. The template half window
was
set to 0.1 seconds. In the flagging step, the input
signal is analysed to detect corruptions. The results
for the first signal are reported in Figures 3, 4 and 5
where the first plot reports the original ECG, the
second plot reports the filtered ECG, the QRS marks
and the peaks envelope and the third plot reports the
estimated heart period (in seconds) and the beat
correlation coefficient. All signals are plotted versus
the time in seconds.
Figure 3: Original first ECG signal.
Observing this set of figures, the preprocessing is
successful in limiting the power-line disturbance.
The QRS peaks are correctly marked except around
30 seconds, were the noise is too high for a reliable
detection, and 55 seconds, where the signal is absent
(flagged due to saturation).
Figure 4: Filtered and marked first ECG signal.
However the peaks are correctly detected
elsewhere. Furthermore, the unreliable peaks are
AnElectrocardiogram(ECG)SignalProcessingAlgorithmforHeartParametersEstimationbasedonQRSComplex
Detection
251
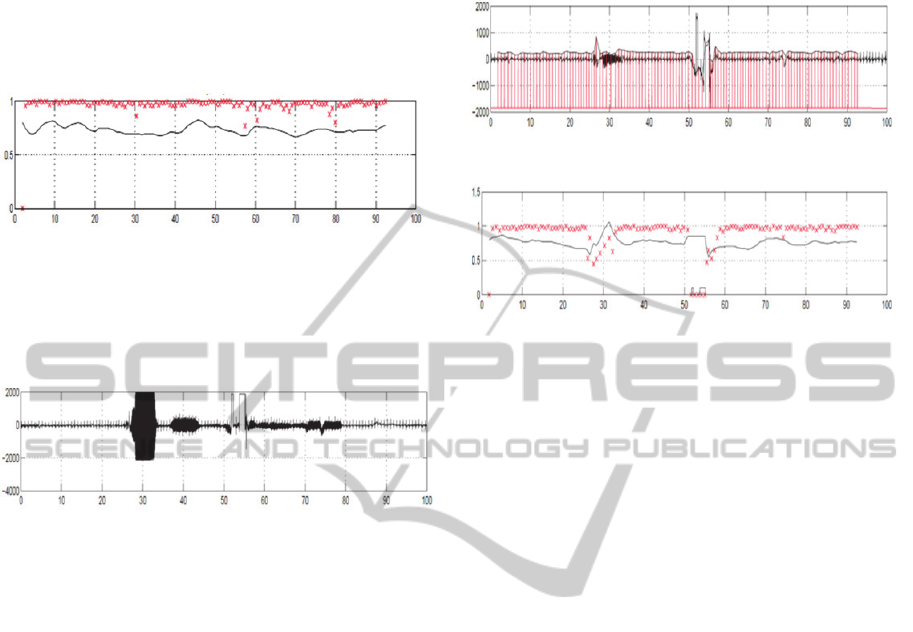
identified by a lower correlation coefficient, with a
zero correlation coefficient indicating flagged data
or false maximum detection. The results for the
second signal are reported in Figures 6, 7 and 8 and
are quite similar (the QRS peaks are correctly
identified).
Figure 5: Estimated heart period (in seconds) and beat
correlation coefficient of first ECG signal.
Since this signal is less noisy, the band-pass
filtering could be skipped, since the QRS detection
works fine even on the original, unfiltered, signal.
Figure 6: Original second ECG signal.
6 CONCLUSIONS
In this paper an approach for the estimation of
heartbeat parameters is presented, based on a QRS
complex detection. The QRS detection algorithm
described in the paper demonstrates to behave very
well even on the noisy ECG signals produced by the
Wearable Unit. The algorithm results to be an
optimal candidate for its deployment into the WU,
after the phase of re-design of the algorithm for the
firmware of the unit itself. Considering the trade-off
between costs and benefits, a direct hardware
implementation of the algorithm is envisaged.
DISCLAIMER
The work described in this paper is partially based
on the results of the ICT FP7 Integrated Project
Bravehealth. The Bravehealth consortium receives
research funding from the European Community's
FP7. Apart from this, the EC has no responsibility
for the content of this paper. The information in this
document is provided as is and no guarantee or
warranty is given that the information is fit for any
particular purpose. The user thereof uses the
information at its sole risk and liability.
Figure 7: Filtered and marked second ECG signal.
Figure 8: Estimated heart period (in seconds) and beat
correlation coefficient of second ECG signal.
REFERENCES
Afonso V. X., Tomkins W. J., Nguyen T. Q., Luo S.,
1999, ECG beat detection using filter banks, IEEE
Trans. Biomed. Eng. 46 (2), pp. 192–202.
Benitez D., Gaydecki P.A., Zaidi A., Fitzpatrick A.P.,
2001, The use of the Hilbert transform in ECG signal
analysis, Comput. Biol. Med. 31, pp. 399–406.
Dokur Z., Olmez T., Yazgan E., Ersoy O. K., 1997,
Detection of ECG waveforms by neural networks,
Med. Eng. Phys. 19 (8), pp. 738–741.
Keselbrener L., Keselbrener M., Akselrod S., 1997,
Nonlinear high pass filter for R-wave detection in
ECG signal, Med. Eng. Phys. 19 (5), pp. 481–484.
Kohler B. U., Henning C., Orglmeister R., 2002, The
Principles of Software QRS Detection, IEEE Eng.
Med. Biol. 21 (1), pp. 42–57.
Pan J., Tompkins W. J., 1985, A real-time QRS detection
algorithm, IEEE Trans. Biomed. Eng. BME-32 (3), pp.
230–236.
Rangayyan R. M., 2001, Biomedical Signal Analysis: A
Case-study Approach, Wiley–Interscience, New York,
pp. 18–28.
Silipo R., Marchesi C., 1998, Artificial neural networks
for automatic ECG analysis, IEEE Trans. Signal
Process. 46 (5), pp. 1417–1425.
Suarez K. V., Silva J. C., Berthoumieu Y., Gomis P.,
Najim M., 2007, ECG beat detection using a
geometrical matching approach, IEEE Trans. Biomed.
Eng. 54 (4), pp. 641–650.
Vijaya G., Kumar V., Verma H. K., 1998, ANN-based
QRS-complex analysis of ECG, J. Med. Eng. Technol.
22 (4), pp. 160–167.
Yeha Y. C.,Wanga W. J., 2008, QRS complexes detection
for ECG signal: The Difference Operation Method,
Computer Methods and Programs in Biomedicine 91,
pp. 245–25.
BIODEVICES2013-InternationalConferenceonBiomedicalElectronicsandDevices
252
