
Using a Graphics Turing Test to Evaluate the Effect of Frame Rate
and Motion Blur on Telepresence of Animated Objects
M. Borg
1
, S. S. Johansen
1
, K. S. Krog
1
, D. L. Thomsen
1
and M. Kraus
2
1
School of Information and Communication Technology, Aalborg University, Aalborg, Denmark
2
Department of Architecture, Design and Media Technology, Aalborg University, Aalborg, Denmark
Keywords:
Graphics Turing Test, Frame Rate, Object Velocity, Motion Blur, Computer Graphics, Animation.
Abstract:
A limited Graphics Turing Test is used to determine the frame rate that is required to achieve telepresence of
an animated object. For low object velocities of 2.25 and 4.5 degrees of visual angle per second at 60 frames
per second a rotating object with no added motion blur is able to pass the test. The results of the experiments
confirm previous results in psychophysics and show that the Graphics Turing Test is a useful tool in computer
graphics. Even with simulated motion blur, our Graphics Turing Test could not be passed with frame rates of
30 and 20 frames per second. Our results suggest that 60 frames per second (instead of 30 frames per second)
should be considered the minimum frame rate to achieve object telepresence and that motion blur provides
only limited benefits.
1 INTRODUCTION
Motion blur is heavily used in animated films to in-
crease the visual realism. It is created based on the
motion blur which occurs when recording real films
(Potmesil, 1983). However, it can be argued that this
way of creating motion blur is not optimal for cre-
ating realistic animations since it does not simulate
the actual human visual system where processes like
eye pursuit help deblurring the perceivedimage (Burr,
1980). We present a setup to determine the minimum
requirements in terms of frame rate, object velocity
and blur length to render realistic animations in vir-
tual environments.
The specific aim of the work presented in this pa-
per is to evaluate the relation between the frame rate
and the velocity of an object in a virtual scene such
that the displayed virtual scene is indistinguishable
from a real scene. Also, it is tested whether or not
simulated motion blur can compensate for low frame
rates in order to obtain object telepresence which we
define as the subjective experience that a virtual ob-
ject is situated in the real world in the accordance with
definitions of presence and telepresence by Slater
and Usoh, Steuer and Witmer and Singer (Slater and
Usoh, 1994; Steuer, 1992; Witmer and Singer, 1998).
Rather than, for instance, evaluating the pixel
colour difference between different synthesised
videos, test subjects assess object telepresence di-
rectly. The relation is evaluated through an experi-
ment setup restricting the human visual system and
taking into account the limitations of today’s monitors
— for example insufficient black levels and colour
range. The setup used in the experiment hides these
limitations and makes it possible to carry out the tests
focusing solely on the comparison between the real
and the virtual object in order to provide more reli-
able results.
Our main contribution is to determine under
which conditions (in terms of frame rate and blur
length) it is possible to create an animated scene
which can pass a limited Graphics Turing Test as de-
fined by McGuigan (McGuigan, 2006). In this con-
text, the relation between the object velocity and the
frame rate needed to pass the test with simulation of
motion blur will be investigated. The setup is tested
using a fixed motion pattern. However, the setup is
also applicable for testing other motion patterns.
2 RELATED WORK
The persistence of the human eye has been shown to
vary depending on several parameters, for instance
intensity (Barlow, 1958), contrast (Bowling et al.,
1979), proximal objects (Chen et al., 1995; Di Lollo
and Hogben, 1987), duration (Efron, 1970), trajectory
(Watamaniuk, 1992) and velocity.
283
Borg M., Johansen S., S. Krog K., L. Thomsen D. and Kraus M..
Using a Graphics Turing Test to Evaluate the Effect of Frame Rate and Motion Blur on Telepresence of Animated Objects.
DOI: 10.5220/0004211002830287
In Proceedings of the International Conference on Computer Graphics Theory and Applications and International Conference on Information
Visualization Theory and Applications (GRAPP-2013), pages 283-287
ISBN: 978-989-8565-46-4
Copyright
c
2013 SCITEPRESS (Science and Technology Publications, Lda.)
A study by Watson et al. (Watson et al., 1986)
has tested the relation between frame rate and veloc-
ity for moving lines with staircase and stroboscopic
light. They used an experiment structure similar to
the Graphics Turing Test and found that the critical
sampling frequency starts at about 30 frames per sec-
ond for very small velocities of the lines and increased
linearly with the velocity. Others have tested the re-
lation between the ability to distinguish between blur
lengths at different velocities (P¨a¨akk¨onen and Mor-
gan, 1994) as well as how motion deblurring is af-
fected by velocity (Hammett et al., 1998). In relation
to object velocity Watamaniuk found that the persis-
tence was reduced solely by step size, hence frame
rate, rather than velocity with fixed-trajectory motion
(Watamaniuk, 1992).
Common to all of these experimental methods is
that they implicitly expect the test subject to compare
to a simple pattern or a manufactured reality. The
results might prove to work for simple patterns and
videos but not necessarily in virtual reality systems
where presence is essential.
We propose an experiment in the spirit of Alan
Turing’s artificial intelligence test (Turing, 1950)
where the test subjects will compare a virtual repre-
sentation of a scene to a genuine scene (McGuigan,
2006). We use a setup similar to the one proposed
by Brack et al. (Brack et al., 2010) which is a mod-
ification of the experiment by Meyer et al. (Meyer
et al., 1986), who made the test subjects watch the
scenes through cameras with Fresnel lenses, and the
experiment by McNamara et al. (McNamara et al.,
2000), who focused on matching light intensities in
real scenes, photographs and renderings.
3 EXPERIMENT SETUP
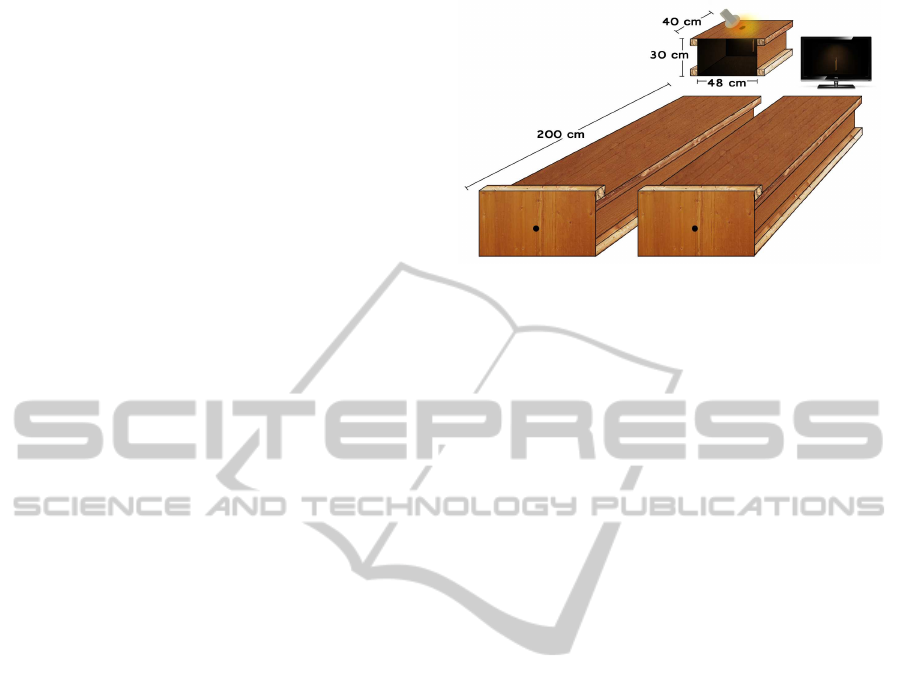
The setup consists of two boxes as seen in Figure 1.
One box has a monitor at the end and the other has a
small box containing a physical object. The monitor
and the small box can be switched in order to present
the virtual and genuine scenes in a randomised order.
The monitor displays a virtual representation of the
physical object, box and light. This setup allows the
user to compare the two scenes which can be seen
in Figure 2. The fronts of the boxes are covered by
opaque plates with circular holes of 2.6 cm in diam-
eter which make it possible to view the entire scene,
as well as restricting the depth cues provided by oc-
clusion, size, position, ocular accommodation, linear
perspective, motion parallax, stereopsis and conver-
gence (Borg et al., 2012). The box is 200 cm long and
lined with black fabric in order to avoid reflections of
Figure 1: A graphic representation of the setup. This does
not include the sheet preventing the user from viewing be-
yond the fronts of the boxes.
the light emitted from the monitor. The experiment
environment surrounding the boxes is well lit (≈70
lux) and the test subjects are asked to look through
the hole at a minimum distance of 7 cm to prevent
dark adaption. The physical scene is lit by a halogen
lamp through a diffuse filter at an oval shaped hole in
the top of the box. A luminosity of about 600 lux is
measured just below the filter. Sufficient light is emit-
ted by the spotlight in order to make the object easily
visible.
Before the test, the test subjects are informed
about the experimentsetup and asked to answer which
of the two is the real scene — similar to a two-
alternatives forced choice test. The test subjects can
look into the boxes for as long as they want.
4 VIRTUAL SCENE
A 12 cm white plastic propeller is chosen for the ex-
periment because of its simple shape, its rotating mo-
tion pattern and its high contrast relative to the back-
ground. A rotating pattern makes it possible to keep
the trajectory inside the scene.
The experiment is executed on a Samsung Sync-
Master 2233RZ 22” TFT monitor with a luminosity
of 300 cd/m
2
and a dynamic contrast of 20,000:1. All
videos are rendered and shown in 1680×1050 to pre-
serve aspect ratio. The length of the propeller extends
2.87 degrees of the visual angle.
4.1 Modeling and Setup
The virtual scene is modeled in Autodesk 3ds Max to
the exact measurements of the real scene in order to
achieve realistic lighting. A photometric light source
is set up with a temperature of 3400 Kelvin and an
intensity of 14.4 cd. The light is emitted from a disc
GRAPP2013-InternationalConferenceonComputerGraphicsTheoryandApplications
284

Figure 2: Top: The physical object captured with a 85 mm
SLR camera — aperture of 4.5, shutter time of 1 second
and ISO 100. Bottom: The virtual representation of the real
object. The bright area on the back of the box gets darkened
due to the dynamic contrast on the employed screen.
positioned equivalently to the halogen lamp. Subsam-
pling is set to 4 and the shadowsare rendered with 256
samples. Object motion blur is used for motion blur
rendering.
4.2 Scene Compatibility
To prevent bias of the two scenes being distinguish-
able, an experiment testing a static version of the
scene is conducted. Fifty answers were collected from
ten male subjects in the age of 21–29 with normal or
corrected-to-normal vision. The scenes are shown in
a randomised order and with the propeller pointing ei-
ther up, down, left or right. The test subjects provided
25 wrong guesses and 25 right guesses which is ex-
actly the same ratio as would be expected at random
chance.
5 RELATION BETWEEN FRAME
RATE AND OBJECT VELOCITY
To determine whether or not previous findings (Wat-
son et al., 1986) of relations between frame rate and
object velocity apply to object telepresence tested by
Table 1: Incorrect answers provided out of 40 trials.
2.25
◦
/s 4.5
◦
/s 9
◦
/s 18
◦
/s
60 fps 15 17 8 8
30 fps 10 10 6 2
20 fps 5 3 2 1
a Graphics Turing Test, four different propeller ve-
locities of 2.25, 4.5, 9 and 18 degrees of visual angle
per second (furthest from the center of rotation) are
shown at three different frame rates — 60, 30 and 20
fps. The order of renderings is randomised.
In the experiment, 40 people in the age of 17 to
47 participated, 7 females and 33 males where 33 had
experience with computer graphics. All have normal
or corrected-to-normal vision.
A criterion for successfully passing the Turing
Test has been proposed (Borg et al., 2012) to verify
whether or not the null hypothesis (that people can
see which object is real) can be rejected. This method
complies with true hypothesis testing of rejecting the
null hypothesis. In order to pass the test, the proba-
bility that the test subjects incorrectly identify the vir-
tual object as the genuine object must be greater than
19 % for a significance level of 5 %. This corresponds
to the commonly used threshold of subjects guessing
incorrectly at least 25% of at least 100 trials (McKee
et al., 1985). With 40 trials and p
null
= 0.19, the cor-
responding threshold is slightly higher to compensate
for lower samples sizes.
The probability for a specific number of incorrect
answers, i, can be calculated by the probability mass
function:
f(i|n, p
null
) =
n!
i!(n− i)!
(p
null
)
i
(1− p
null
)
(n−i)
where p
null
is the probability for the null hypothesis
and n is the number of trials. With this function, the
critical value, i
c
, of incorrect answers to pass the test
can be found, such that the null hypothesis is rejected
with a significance level of 5%:
i
c
(n, p
null
) = min{i |
n
∑
j=i
f( j|n, p
null
) < 0.05}
With 40 trials and p
null
= 0.19, the critical num-
ber of incorrect answers is 13. The provided answers
from the experiment can be seen in Table 1.
At low velocities shown at 60 fps, the Graphics
Turing Test can be passed. This corresponds to pre-
vious findings of Watson et al., who suggests that a
frame rate of at least 150 to 250 fps is needed to pass
the test with the highest object velocity (Watson et al.,
UsingaGraphicsTuringTesttoEvaluatetheEffectofFrameRateandMotionBluronTelepresenceofAnimatedObjects
285
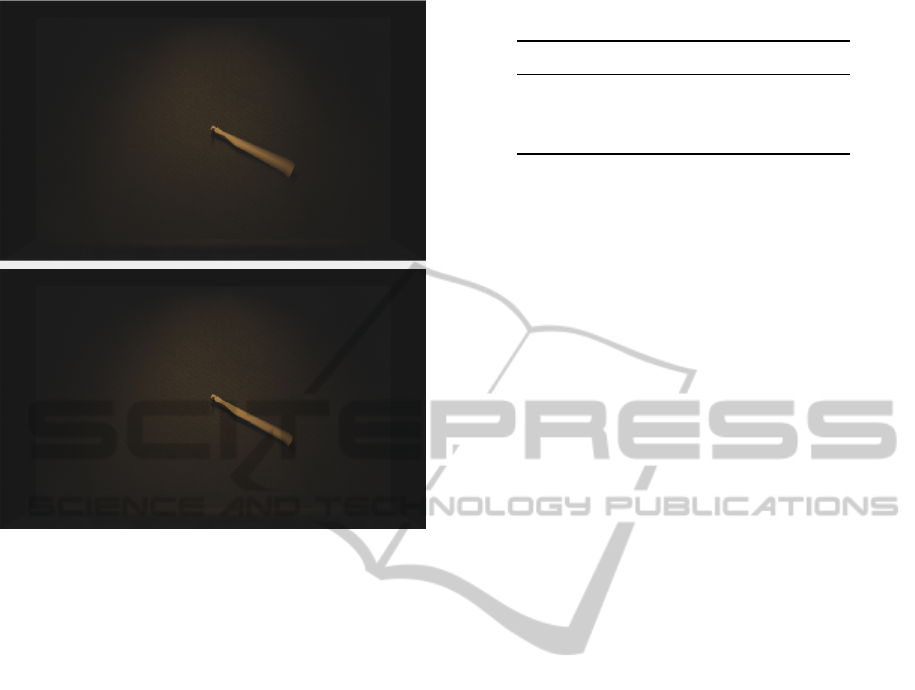
Figure 3: Top: Frame from 30 fps rendering with 1 frame
blur length. Bottom: Frame from 60 fps rendering with 1
frame blur length. At low frame rates motion blur is more
excessive.
1986). The results also correspond to Watamaniuk’s
findings that persistence is decreased solely by step
size and not by object speed (Watamaniuk, 1992), i.e.
the critical object velocity depends on the frame rate.
6 RELATION BETWEEN FRAME
RATE AND MOTION BLUR
It might be possible to pass the test with simulated
motion blur as it has been shown to increase acuity at
high velocities and large separations, i.e. low frame
rates (Fahle and Poggio, 1981; Hammett et al., 1998).
To determine whether or not motion blur can be
used to compensate for low frame rates, two render-
ings with blur lengths corresponding to shutter times
of 0.5 and 1 frame are compared to the three frame
rates. The object velocity is kept fixed at 9 degrees of
visual angle per second.
Ten male test subject in the age 21 to 27 partic-
ipated in the experiment. Eight of them had experi-
ence with computer graphics and all had normal or
corrected-to-normal vision. They compared each ren-
dering twice, giving a total of 20 trials, which can be
seen in Table 2.
A one-tailed Fisher’s exact test between render-
Table 2: Incorrect answers provided out of 20, with a fixed
object velocity of 9 degrees of visual angle per second.
0.5 frame blur 1 frame blur
60 fps 5 8
30 fps 2 0
20 fps 2 0
ings with no blur and their corresponding renderings
with blur reveals no significant difference with the
addition of simulated motion blur for a significance
level of 5%. However, the critial value for 20 tri-
als is 8 which indicates that long streaks of motion
blur might be used to pass the Graphics Turing Test at
higher object velocities than 9 degrees of visual angle
per second for 60 fps.
For 30 fps and 20 fps, the addition of motion blur
had either no effect (Hammett et al., 1998) or allowed
all test subjects to identify the rendering based on ex-
cessive blur (see Figure 3).
7 CONCLUSIONS
The work in this paper tests the relation between ob-
ject velocity and frame rate in a Graphics Turing Test
and the influence of motion blur for various frame
rates. The experiments showed that the only frame
rate that facilitated movements up to 4.5 visual an-
gles per second was 60 fps. In general, the results of
the experiments point towards a tendency that higher
object velocity makes the test subjects more likely
to recognise the 3D model. More specifically, the
amount of visual angles that the object moves from
one frame to the next is roughly sought to be 0.075
visual angles. 0.075 visual angles only apply to 60
fps — and not 30 fps. This indicates that frame rate is
predominant compared to object velocity.
A second experiment was carried out in order to
clarify if it was possible to decrease the frame rate by
adding various amounts of motion blur. In this exper-
iment, the 60 fps rendering with 1 frame blur length
was able to pass; the other renderings did not improve
by the use of simulated motion blur. Although the
60 fps rendering with 1 frame blur length passed the
Graphics Turing Test, the result may be due to the low
number of test subjects as a Fischer’s exact test proved
that there was no significant difference between the
renderings with motion blur and the renderings with
no simulated motion blur. Based on the work pre-
sented in this paper virtual reality systems require at
least 60 fps to pass the Graphics Turing Test if they
include any kind of movement. This indicates that the
previously assumed limit of 30 fps might not be suf-
GRAPP2013-InternationalConferenceonComputerGraphicsTheoryandApplications
286

ficient (McGuigan, 2006). Also, motion blur is un-
likely to help passing the Graphics Turing Test for the
tested object velocities since humans perceivereal ob-
jects at low velocities without much motion blur (as
opposed to cameras with finite shutter times).
8 FUTURE WORK
The experiment for 60 fps and 1 frame blur length
passed the Graphics Turing Test; however, no signif-
icant difference between this result and the result for
the experiment without motion blur was found; thus,
this result is worth further research. The results de-
scribed in this paper show a tendency that higher ob-
ject velocities as well as lower frame rates are less
likely to pass a Graphics Turing Test. Therefore, it
should be researched further whether a higher object
velocity can pass the Graphics Turing Test with the
use of simulated motion blur without having to in-
crease the frame rate of the rendering as it is not re-
alistic in terms of the limitations of today’s consumer
monitors. Lastly, we would also encourage more re-
search in the area of other object trajectories and more
complex scenes.
REFERENCES
Barlow, H. B. (1958). Temporal and Spatial Summation in
Human Vision at Different Background Intensities. J.
Physiol., 141(2):337–350.
Borg, M., Johansen, S., Thomsen, D., and Kraus, M.
(2012). Practical Implementation of a Graphics Tur-
ing Test, volume 7432 of Lecture Notes in Computer
Science, pages 305–313. Springer.
Bowling, A., Lovegrove, W., and Mapperson, B. (1979).
The Effect of Spatial Frequency and Contrast on Vi-
sual Persistence. Perception, 8(5):529 – 539.
Brack, C. D., Clewlow, J. C., and Kessel, I. (2010). Human
Factors Issues in the Design of Stereo-rendered Photo-
realistic Objects: A Stereoscopic Turing Test. In Proc.
SPIE ’10, volume 7524.
Burr, D. (1980). Motion Smear. Nature, 284:164–165.
Chen, S., Bedell, H. E., and
¨
Oˇgmen, H. (1995). A Target in
Real Motion Appears Blurred in the Absence of Other
Proximal Moving Targets. Vision Res., 35(6):2315–
2328.
Di Lollo, V. and Hogben, J. H. (1987). Suppression of
Visible Persistence as a Function of Spatial Separa-
tion Between Inducing Stimuli. Percept Psychphys.,
41(4):345–354.
Efron, R. (1970). The Relationship Between the Duration
of a Stimulus and the Duration of a Perception. Neu-
ropsychologia, 8(1):37–55.
Fahle, M. and Poggio, T. (1981). Visual Hyperacuity: Spa-
tiotemporal Interpolation in Human Vision. In Pro-
ceedings of the Royal Society of London. Series B,
Biological Science, volume 213, pages 451–477. The
Royal Society.
Hammett, S. T., Georgeson, M. A., and Gorea, A. (1998).
Motion Blur and Motion Sharpening: Temporal
Smear and Local Contrast Non-Linearity. Vision Res.,
38(14):2099–2108.
McGuigan, M. D. (2006). Graphics Turing Test. CoRR,
abs/cs/0603132. Informal publication.
McKee, S. P., Klein, S. A., and Teller, D. Y. (1985). Statis-
tical Properties of Forced-Choice Psychometric Func-
tions: Implications of Probit Analysis. Perception &
Psychophysics, 37(4):786–298.
McNamara, A., Chalmers, A., Troscianko, T., and
Gilchrist, I. (2000). Comparing Real & Syn-
thetic Scenes using Human Judgements of Light-
ness. In Proceedings of the Eurographics Work-
shop on Rendering Techniques 2000, pages 207–218.
http://dl.acm.org/citation.cfm?id=647652.732122.
Meyer, G. W., Rushmeier, H. E., Cohen, M. F., Greenberg,
D. P., and Torrance, K. E. (1986). An Experimen-
tal Evaluation of Computer Graphics Imagery. ACM
Transactions on Graphics, 5(1):30–50.
P¨a¨akk¨onen, A. K. and Morgan, M. J. (1994). Effects of
Motion on Blur Discrimination. J. Opt. Soc. Am. A,
11(3):992–1002.
Potmesil, M. (1983). Modeling Motion Blur in Computer-
Generated Images. Computer Graphics, 17:389–399.
Slater, M. and Usoh, M. (1994). Body Cen-
tred Interaction in Immersive Virtual En-
vironments. In Artificial Life and Virtual
Reality, volume 1. http://web.cs.wpi.edu/∼
gogo/hive/papers/Slater Presence 1994 Depth.pdf.
Steuer, J. (1992). Defining Virtual Reality: Dimensions De-
termining Telepresence. Journal of Communication,
42(4):73–93.
Turing, A. M. (1950). Computer Machinery and Intelli-
gence. Mind, LIX(236).
Watamaniuk, S. N. J.(1992). Visible Persistence is Reduced
by Fixed-Trajectory Motion but not by Random Mo-
tion. Perception, 21(6):791 – 802.
Watson, A. B., Ahumada, Jr., A. J., and Farell, J. E. (1986).
Window of Visibility: A Psychophysical Theory of Fi-
delity in Time-Sampled Visual Motion Displays. J.
Opt. Soc. Am. A., 3(3):300–307.
Witmer, B. and Singer, M. (1998). Measuring Presence
in Virtual Environments: A Presence Questionnaire.
Presence, 7(3):225–240.
UsingaGraphicsTuringTesttoEvaluatetheEffectofFrameRateandMotionBluronTelepresenceofAnimatedObjects
287
