
On the Characterization of a Speed-boat Motion for Real-time
Motion Cueing
Sergio Casas, Inmaculada Coma, José V. Riera and Marcos Fernández
Institute of Robotics (IRTIC), University of Valencia, Valencia, Spain
Keywords: Real-time Simulation, Virtual Reality, Speed-boat, Motion Characterization, Motion Platform, Inertial Cues.
Abstract: Motion platforms are not uncommon for car and flight VR simulators. However, the same is not true about
watercraft. This paper presents an experimental characterization of a speed-boat in order to understand the
nature and magnitude of a typical small watercraft motion. Unlike other studies, this work focuses on real-
time simulation instead of on boat design issues. The purpose of the study is to guide the future process of
designing and parameterizing a suitable motion platform for a VR application. The characterization is
performed by placing two accelerometers, two gyroscopes, one GPS logger, one digital compass, and one
digital anemometer on a speed-boat at several ranges of motion and maneuvering. We analyze tilt, speed,
wind, steering, angular speed, acceleration and angular acceleration at both frequency and time domains.
Characterization results show that at least a 3-DoF heave-pitch-roll motion platform should be used.
1 INTRODUCTION
Motion platforms have been used since the
beginning of the VR era. However, their use has
been concentrated on flight and car simulators, and
there are, to our knowledge, much fewer approaches
to apply this technology to watercraft. In an effort to
make this technology usable and affordable for the
simulation of small boats, we present an
experimental characterization of a speed-boat. The
information obtained from this work will help us in
the design of the physics model of our simulator,
and in the design and construction of a suitable
motion platform. Unfortunately, we have not found
any related work that tries to characterize the 6
degrees of freedom (DoF) of a watercraft motion
with the purpose to reproduce it with a motion
platform in a real-time simulator. Nonetheless,
similar studies have been previously performed on
other types of vehicles, mainly land and air vehicles.
Although the behaviour of a marine vehicle is
substantially different to those ones, the procedure
could be extrapolated. One of the best works that
deals with the characterization of a vehicle for real-
time simulation is the one performed by G.
Reymond and A. Kemeny (Reymond and Kemeny,
2000). Throughout this paper, we will perform a
similar analysis but on a speed-boat.
The rest of the paper is organized as follows. In
section 2 we describe the sensors. Section 3 deals
with the analysis itself. Finally, section 4
summarizes the conclusions that we can draw from
our analysis.
2 CHARACTERIZATION SET-UP
In order to record the necessary data, we used a
laptop connected to a number of sensors placed on
the boat. In particular, we used two 3-axis
accelerometers, two 3-axis gyroscopes, one GPS
logger, one digital compass, one anemometer, a
microphone and a camera.
The accelerometers and gyroscopes were
Nintendo Wiimotes (with Motion Plus) used to
obtain linear accelerations and angular velocities
respectively. We used two of these devices, as one
was placed at the Center of Mass (CoM), and the
other one was placed on the rudder in order to track
the steering. The GPS logger selected was the Holux
M-241 (Holux, 2009). To ameliorate the effects of
its large vertical error, we used the GPS only to track
motion and speed over the XY plane. As its 1 Hz
update frequency is also quite poor; we can mix
information from the accelerometers and from the
GPS to obtain a better estimation of speed. The
275
Casas S., Coma I., Riera J. and Fernández M..
On the Characterization of a Speed-boat Motion for Real-time Motion Cueing.
DOI: 10.5220/0004272302750278
In Proceedings of the International Conference on Computer Graphics Theory and Applications and International Conference on Information
Visualization Theory and Applications (GRAPP-2013), pages 275-278
ISBN: 978-989-8565-46-4
Copyright
c
2013 SCITEPRESS (Science and Technology Publications, Lda.)

digital compass was an OS3000 (Ocean, 2007). The
anemometer was a Kestrel 4000 (Nielsen, 2009). We
also used a simple digital microphone and a webcam
in order to have the test recorded. The devices were
arranged as explained in Figure 1. As the data
acquired from the sensors was time-stamped, it was
fairly easy to synchronize it.
Figure 1: Sensor placement.
3 ANALYSIS AND RESULTS
In this analysis, we tested a Duarry Brio 620 speed-
boat propelled by a Suzuki DF 140 Four Stroke 140
hp engine. It has a weight of 911 kg and a size of
6.20 x 2.20 x 1.43 meters (length x width x height).
This can be considered an average speed-boat, and
this is the reason why we chose it. The test consisted
on 2030 seconds of boat manoeuvring near the Port
of Barcelona, which can be divided into certain time
zones (see Table 1).
All the calculations and analysis of the collected
data were performed using MATLAB 2009.
3.1 Global Analysis (Ranges)
Virtual vehicles are not critically affected by peak
values of speed, acceleration, or any other physical
magnitude. Nevertheless, as we intend to reproduce
the boat’s motion with a real motion platform with
real physical limits, measured peak values are
important in order to know whether or not our
motion platform will be able to withstand such
limits. Peak values need to be taken with caution for
they are usually the consequence of a precise and
unique moment, but they reveal some information.
Table 2 shows the peak values observed during our
experiments. Our frame of reference follows the X-
right, Y-forward, Z-up convention.
For instance, from this data, we can see that the
boat leans to positive pitch. This is a direct result of
the design and engineering of the speed-boat. Unlike
the pitch angle, roll angle is symmetrical around the
Y axis. Besides, roll maximum value is a little lower
than pitch (positive) peak value. Yaw angle is, not
surprisingly, unbounded.
Table 1: Test chronology.
Range(secs) Description
0-260
Set-up and testing (discarded)
260-440
Docked
440-550
Manoeuvres inside port
550-800
Slow navigation near port
800-980
Progressive acceleration
980-1320
Full-speed navigation
1320-1355
Braking and then stopped
1355-1553
Open sea moderate navigation
1553-1613
Navigation, braking and reverse motion
1613-1770
A variety of manoeuvres
1770-1885
Full speed turning
1930-2030
Stopped at sea
Forward acceleration peaks around 0.4 Gs and -
0.8 Gs. Negative accelerations are related to fluid
braking. Water is a very tough fluid to move
through, and it is able to stop the boat rapidly.
Positive accelerations should be related with engine
propelling. However, a further analysis will reveal
that both are a result of water hits instead of the
engine. Lateral acceleration peaks around ±0.5 G,
which is not much. It is symmetric as expected
because it is produced by turns and water hits.
Vertical acceleration ranges from -2 Gs to 1 G,
which is quite a larger range. This shows that one of
the most noticeable effects of being on a speed-boat
is water hitting when jumping from wave to wave.
Both positive and negative peaks are caused by
water waves hitting the boat. These accelerations are
very short but also very sharp, and thus, noticeable.
Angular velocities are also consistent with the
boat’s motion for they are lower around the Z axis
(yaw) than around the other two. Indeed, a boat
suffers high-frequency rotations around pitch and
roll axes, but although it is able to turn (yaw)
quickly, it cannot reach the angular velocities of the
other two axes. Angular velocity around Y axis is a
little greater (the difference is in fact greater because
of outliers) than around X axis. This is also
consistent with the boat design, because the boat is
longer than wider. Travel speed ranges from a few
knots when travelling backwards to more than 25
knots on forward advance. The boat is not designed
to travel backwards because it tends to sink, so
maximum backward speed is very limited.
GRAPP2013-InternationalConferenceonComputerGraphicsTheoryandApplications
276
Apparent wind speed ranges from 0 to more than 30
knots. It is similar to forward speed, as expected.
Table 2: Observed ranges.
Magnitude Min Max Units
Yaw
0.0 359.99 °
Pitch
-5.3 +21.73 °
Roll
-19.18 +19.86 °
Forward acceleration
-0.83 +0.42 Gs
Lateral acceleration
-0.45 +0.61 Gs
Vertical acceleration
-2.11 +1.15 Gs
Angular speed X
-118.1 +132.9 °/sec
Angular speed Y
-144.8 +110.9 °/sec
Angular speed Z
-42.6 +58.85 °/sec
Forward speed
-5.64 26.71 knots
Apparent wind speed
0.32 32.46 knots
3.2 Time Domain Analysis
A time-domain analysis of the data reveals some
interesting facts. The first one is that pitch and roll
show a different behaviour. They both depend on
swell and speed, but on a different fashion. While
pitch tends to increase with speed (because the
engine generates an off-axis force that creates a
lifting torque) and gets affected by waves, roll seems
to have an opposite behaviour, because roll is much
higher when the boat is stopped and at swell’s
mercy. To corroborate this, we computed the
Pearson correlation between forward speed and pitch
and the result was 0.826. The roll-speed correlation
was -0.218 that reveals some degree of inverse
correlation.
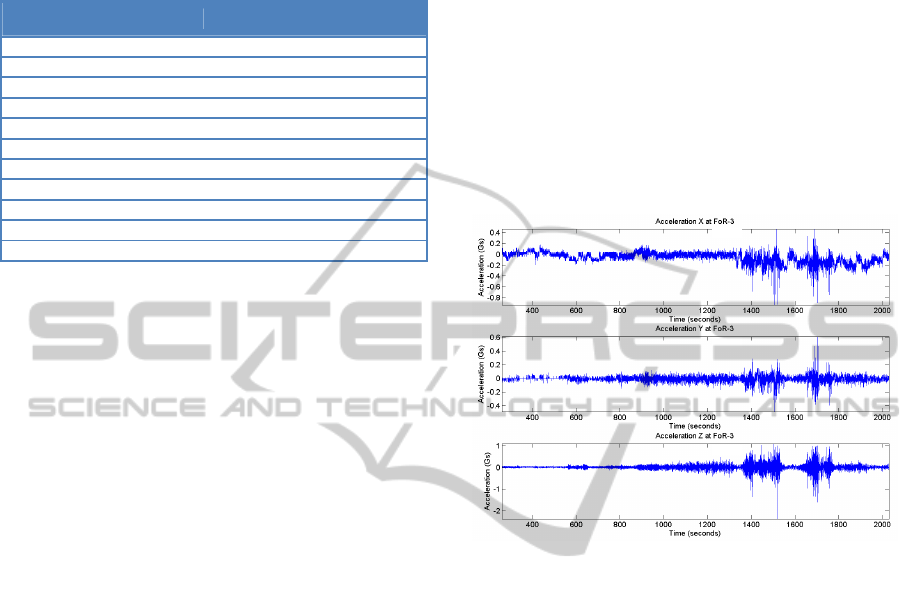
The time-domain analysis of the linear
acceleration reveals that, in spite of testing a speed-
boat with a 140 hp engine, no trace of a sustained Y
acceleration caused by the engine is found. We can
see that in Figure 2 (where we show time vs.
acceleration). Although a speed-boat could reach 30-
40 knots, it takes several seconds to reach that speed,
and the average Y acceleration is even smaller than
that of a utility car. If we compute the average
forward acceleration from 890 to 910 seconds
(maximum acceleration zone) the result is less than
0.2 Gs. The absence of high sustained accelerations
on the Y axis is good for the design of a motion
platform, because sustained accelerations produce
long displacements. X and Z accelerations show a
similar behaviour, although the Z acceleration is
larger and sometimes sharper.
The analysis of the angular acceleration shows
that all three components present a sinusoidal shape,
with some very sharp peaks, that are the result of
water hits, but, again, no trace of sustained angular
acceleration is found. This means that if we want a
motion platform to reproduce X and Y turns, we
need powerful engines to reproduce sharp changes,
but the absence of sustained acceleration assures us
to be within the limits. Regarding the Z axis, there is
some sustained angular speed that indicates that to
simulate that kind of motion we need a motion
platform with as large excursion as possible. In any
case, as the angular accelerations are not sustained
(not even on the Z axis), the motion platform could
trick that with an appropriate washout algorithm
(Reid and Nahon, 1985). For the sake of brevity we
cannot show graphs of all the tested magnitudes.
Figure 2: Linear acceleration.
3.3 Frequency Domain Analysis
Although on time domain we can see the behaviour
on different situations, the analysis of the spectral
distribution of the measures is necessary to asses
which motion cues will be compliant with the future
motion platform rendering performances. The best
way to analyse this is to calculate the cut-off peak-
to-peak maximum displacements. The peak-to-peak
amplitude of the displacement signals were
computed by applying a second-order high-pass
filter of cut-off frequency f
, to the accelerations,
and then double-integrating into positions, exactly
like Reymond and Kemeny did (Reymond and
Kemeny, 2000). The resulting curves of peak-to-
peak amplitudes for different cut-off frequencies are
shown in Figure 3.
As we can see, eliminating all frequencies lower
than 3 Hz the excursion needed for the motion
platform is (22.9, 13.7, 52.7) cm (X, Y, Z) which is
feasible. If we eliminate all frequencies lower than 5
Hz the excursion needs to be (12.3, 7.4, 28) cm,
which could be easier to achieve. As we decrease the
cut-off frequency under the 3 Hz limit, the limits
OntheCharacterizationofaSpeed-boatMotionforReal-timeMotionCueing
277

raise exponentially. As we can see, Z excursion
needs to be higher than X and Y. This is a
consequence of the absence of sustained X and Y
accelerations, and also a consequence of sea tide,
which lifts the boat whenever a wave passes under
it, creating a short but more sustained Z motion.
The same can be done with peak-to-peak angles.
In this case, pitch (X) and roll (Y) angles do not
need to be larger than (approximately) 20° and the
yaw angle (Z) is unbounded. This means that pitch
and roll movements could be simulated directly
without filtering provided that the motion platform
withstands those limits (Nahon, 1990). Z turns have
to be filtered because yaw motion is not constrained
but the motion platform usually is. This is consistent
with the measurements of Section 3 and with the
nature of the motion. Following with the analysis,
with a 3 Hz cut-off frequency, the excursion needed
is (12.18, 10.9, 9.4)° (X, Y, Z). With a 5 Hz limit,
the excursion needs to be (10.8, 9.7, 6.6)°, and with
a 10 Hz limit, we need (8.52, 8.53, 3.87)°. Here, an
increase in the cut-off frequency does not change as
much as it did with the translational limits (with the
exception of yaw) and the 3 Hz limit is totally
feasible without losing much information.
4 CONCLUSIONS
Some conclusions can be drawn from our study. On
the qualitative side, we can affirm that the four
major cues when sailing a speed-boat are pitch, wind
speed, roll and heave. Pitch is the major cue because
it is directly linked to the throttle and, at full speed,
considerable pitch angles are reached. Wind speed is
quite important because, unlike in a car, no
windshield protects you from the air, and the feeling
of the wind is fairly intense. Roll is less significant
at high speeds but when the boat is turning or
stopped, it is also quite noticeable. And heave is also
important when the boat hits a wave. These
qualitative conclusions are consistent with our data.
On the quantitative side, the most important
conclusion is that sustained accelerations (low
frequencies) are rather small and that water, and not
the propeller, is the main cause of inertial cues. This
is a significant result because it means that it is more
important to be able to produce fast but sharp
movements than long accelerations. Therefore, the
motion platform excursions do not have to be very
long. However, the engines should be strong enough
to move the platform as quickly as possible. Another
conclusion that can be extracted is that motion along
Z axis is the most important of the linear motions.
As aforementioned, pitch and roll rotations also
reveal very important, because they change sharply
and they define the behaviour of the boat. On the
contrary, yaw rotations tend to be less important
compared to the former. Thus, if we were to choose
a motion platform design, we would build a 3-DoF
pitch-roll-heave motion platform. In our opinion,
this is the minimum necessary to reproduce the
major inertial cues of the boat.
Figure 3: Cut-off peak-to-peak maximum linear
displacements.
Future work includes, of course, building a
suitable motion platform and a real-time simulator to
use it. Some of the future work is already published
in (Casas et al., 2012).
REFERENCES
HOLUX Technology Inc. Holux M-241 Spec., 2009. Web
page: http://www.holux.com/JCore/en/products/
products_spec.jsp?pno=341. Visited: 07/2012.
Nahon, M.A. and Reid, L.D., 1990. Simulator Motion
Drive Algorithms: A Designer’s Perspective. In
Journal of Guidance, Control, and Dynamics, Vol. 13,
No. 2. , pp. 356-362.
Nielsen Kellerman (Kestrel official site), 2009. Kestrel
4000 Data Sheet. http://www.nkhome.com/
pdfs/Kestrel_specs.pdf. Visited: 07/2011.
Ocean Server Technology Inc. ,2007. OS3000 Features.
http://www.oceanserver.com/download/Release_OSI_
060107.pdf. Visited 07/2012.
Reid, L.D. and Nahon, M.A., 1985. Flight Simulation
Motion-Base Drive Algorithms: Part 1 – Developing
and Testing the Equations. In UTIAS Report No. 296.
Reymond, G. and Kemeny, A., 2000. Motion cueing in the
Renault Driving Simulator. In Vehicle System
Dynamics, pp. 249-259.
Casas S. et al., 2012. On the Real-time Physics Simulation
of a Speed-boat Motion. In GRAPP 2012, pp. 121-128
GRAPP2013-InternationalConferenceonComputerGraphicsTheoryandApplications
278
