Can Feature Points Be Used with Low Resolution Disparate Images?
Application to Postcard Data Set for 4D City Modeling
Lara Younes, Barbara Romaniuk and
´
Eric Bittar
SIC - CReSTIC, University of Reims Champagne Ardenne, Rue des Cray
`
eres, 51687 REIMS Cedex 2, France
Keywords:
3D Reconstruction, Feature, Matching, Homography, Epipolar Geometry.
Abstract:
We propose an experimental design for the comparison of state-of-the art feature detector-descriptor combina-
tion. Our aim is to rank potential detector-descriptor that best performs in our project. We deal with disparate
images that represent building evolution of the city of Rheims over the time. We obtained promising results
for matching buildings that evolve temporally.
1 INTRODUCTION
The advances in computer vision opened lots of op-
portunities in the field of 3D reconstruction and vir-
tual reality. Since, many projects address the problem
of reconstructing and geo-referencing archaeological
sites using photographic data.
Commonly a large data collection of ground-level
images are used that represent many images of the
same urban area taken at different exposures and
within a time interval of about 10 years since the pop-
ularization of digital photography. A system using
such data collection for the reconstruction process is
called Image-based system. (Debevec et al., 1996)
uses a set of calibrated images to accurately compute
the geometric model combining geometric informa-
tion with images content. Fully image based systems
rely on uncalibrated images. (Pollefeys et al., 2000)
uses a sequence of images taken by the same camera.
(Snavely et al., 2006; Agarwal et al., 2011) broaden
the images sources. They gather a dense collection of
unorganized contemporaneous images from the web
to construct their 3D model.
Our project goes beyond the existing reconstruc-
tion aspects. It deals with a more complicated set of
photographs that are postcards harvested from collec-
tors archives. Those cards witness the urbanism evo-
lution over time. We aim at the conception of an in-
teractive and collaborative tool for a dynamic spacio-
temporal modeling of the city of Rheims. Rheims
was founded 80 BC by Gauls and played a prominent
role in French monarchical history as the traditional
site where the kings of France where crowned. Be-
cause of this rich historical past, various documents
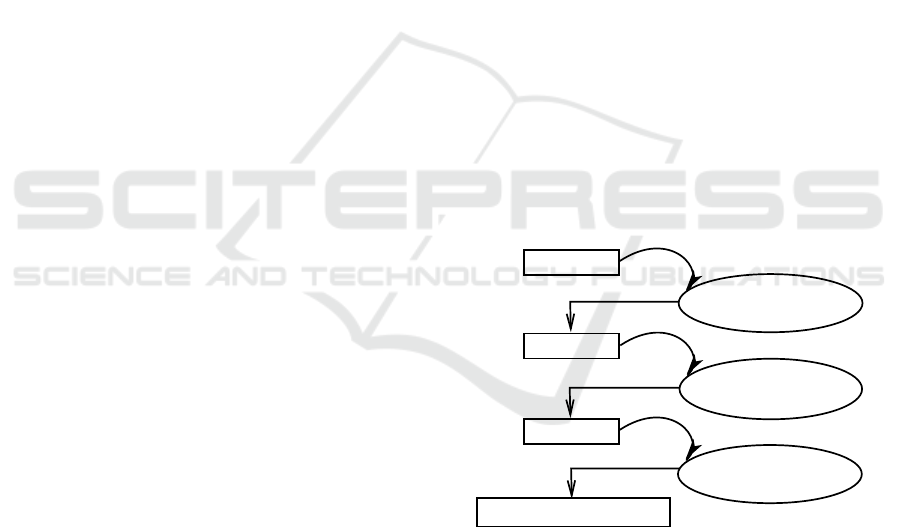
Postcards
Image analysis:
Feature extraction
Features
Image understanding:
Feature matching
Matches
SFM:
Geometry estimation
Camera and scene poses
Figure 1: Structure from Motion (SfM) process pipeline.
testify to the evolution of this city and more particu-
larly old postcards for the period from the beginning
to the middle of the 20
th
century. Those cards rep-
resent the changeability of the monuments in the city
some of which were destroyed and reconstructed over
time. We consider to give citizen the opportunity to
virtually visit the city through space and time using
an interactive Geographic Information System (GIS)
leading to a spatio-temporal cadastral map of Rheims.
This will ease the comprehension of the filed away old
postcards of the city.
Alike the work of (Agarwal et al., 2011; Snavely
et al., 2006), we investigate the structure from mo-
tion process to recover the 3D geometry from the
2D-images content. The pipeline of this process is
presented in figure 1. For an automated system,
the choice of the most convenient feature detector is
dramatically important for an accurate matching that
gives a robust estimation of the 3D geometry of a
481
Younes L., Romaniuk B. and Bittar E..
Can Feature Points Be Used with Low Resolution Disparate Images? - Application to Postcard Data Set for 4D City Modeling.
DOI: 10.5220/0004302304810486
In Proceedings of the International Conference on Computer Vision Theory and Applications (VISAPP-2013), pages 481-486
ISBN: 978-989-8565-47-1
Copyright
c
2013 SCITEPRESS (Science and Technology Publications, Lda.)

scene given a set of images. Seen the challenging data
set on which we rely for our reconstruction project,
we concentrated in this work on an experimental pro-
cess for the choice of the best features that we will fur-
ther analyze. We dispose of the following character-
istics in our postcard collection: (1) Data are sparse,
Figure 2: Illustration of the challenging data collection.
and few images are available for the same time pe-
riod. (2) Images are printed and not digital docu-
ments amongst some represent photos that were hand-
colored by archaeologists. (3) Text, stamps and post-
marks can layover the postcards.We can comprehend
from figure 2 the challenges of our data collection.
This paper will be organized as follows. In the
section two we present the evaluated detectors and de-
scriptors. The experimental design is described in de-
tails in the third section. The fourth section shows the
different results obtained and a detailed discussion of
their impact on our application. We finish by a con-
clusion and some further perspectives for the evolu-
tion of our project.
2 FEATURE COMPARISON
In the image analysis step, a feature detection method
is used for the localization of interest points that rep-
resent invariant location with respect to geometric and
photometric transformations. The distinctiveness of
the detected interest point is indexed through a de-
scriptor vector that holds the information content in
the local region centered at the interest point.
Several comparative studies of local region detec-
tors have been presented in the literature. (Miko-
lajczyk and Schmid, 2005) extract affine invariant
regions using different detectors and then compare
different description methods. (Moreels and Peron,
2007) compare several interest point detectors and de-
scriptors to match 3D objects features across view
points and lighting conditions. Other authors compare
them in the context of visual SLAM(vision-based
simultaneous localization and mapping) (Gil et al.,
2010), historic repeat photography (Gat et al., 2011)
or real-time visual tracking (Gauglitz et al., 2011).
We evaluate four different detectors and three
descriptors that were tested in the literature. The
choice was made relatively to our data set applica-
tion. Reckon with the quality of the images we have
selected the detectors that calculate a dense set of effi-
cient features and some relevant descriptors that per-
formed a robust matching.
2.1 Interest Point Detectors
Harris Laplace (Mikolajczyk and Schmid, 2005).
This approach detects corner-like points that are in-
variant to similarity group transformations. They are
detected using a scale-adapted Harris function, then
selected in scale-space by the Laplacian-of-Gaussian
operator.
Hessian Laplace (Mikolajczyk and Schmid, 2005).
This approach detects blob-like structures that are in-
variant to similarity group transformations. Points are
localized in space at the local maxima of the Hessian
determinant and in scale at the local maxima of the
Laplacian-of-Gaussian operator.
Harris Affine (resp. Hessian Affine) (Mikolajczyk
and Schmid, 2005). These detectors are invariant to
affine transformations. The interest points are com-
puted using the Harris Laplace detector (resp. Hes-
sian Laplace detector) then an affine neighborhood is
determined by the affine adaptation process based on
the second moment matrix.
SIFT (Scale Invariant Feature Transform) (Lowe,
2004; Younes et al., 2012). This detector is invari-
ant to affine transformations. It detects distinctive
points using a difference of Gaussian function (DoG)
applied in scale space. Points are selected as local
extrema of the DoG function, while low contrasted
points and points localized on low curvature contours
are rejected.
2.2 Local Descriptors
Steerable Filters (Mikolajczyk and Schmid, 2005).
Designing steerable filters consists in computing up
to 4th order derivatives of a Gaussian function. Cor-
relations between rotated version of the filters with
the image leads to a 14-dimensional descriptor.
PCA-SIFT (Ke and Sukthankar, 2004; Mikolajczyk
and Schmid, 2005). This descriptor is based on a
SIFT-like descriptor on which a PCA (Principal Com-
ponent Analysis) is applied. To compute the 36 di-
mensional vector corresponding to this descriptor, x
and y gradient images are computed in a support re-
gion, sampled at 39×39 locations and then reduced
by PCA.
SIFT (Lowe, 2004; Younes et al., 2012). This de-
scriptor assigns a dominant orientation to each feature
point based on local image gradient directions. The
descriptor is deduced from orientation histograms
VISAPP2013-InternationalConferenceonComputerVisionTheoryandApplications
482

computed in sub-regions around the point. The result-
ing descriptor of dimension 128 is then normalized to
ensure an illumination invariance.
3 EXPERIMENTAL DESIGN
We chose to evaluate the quality of feature points ex-
traction in two stages: first by testing their invariance
to known affine transformations and occlusions, and
secondly in real cases where the ground truth trans-
formation between two images in unknown.
In the first stage, we rely on a certain ground truth
by controlling the following independent variables in
a partial factorial design
1
: input image, interest point
detector, local descriptor, transformation, occlusion.
We compute the detectors-descriptors in the original
image and in the image after applying a known affine
transformation, and match them according to an Eu-
clidean or Mahalanobis distance. After rejection of
erroneous matches on a two nearest neighbor ratio cri-
terion as in (Lowe, 2004), we obtain the set of the
matches to be evaluated. We measure the percent-
age of correct matches (Precision) relatively to the
ground truth transformation. This percentage of cor-
rect matches and their number are the dependent vari-
ables at this stage of the evaluation process.
In the second stage, two different images are com-
pared. The difficulty of this stage is that no ground
truth transformation exists to validate the matches.
We overcome this problem by using user-guided eval-
uation methods that we present in 3.2.1 and 3.2.2. The
independent variables are: two input images, interest
point detector, local descriptor, a posteriori evaluation
method.
3.1 Certain Ground Truth
In this part we chose to differentiate the experimental
data in 2 categories: Frontal buildings and sideways
buildings. We mean by frontal buildings the images
where the buildings occupy the largest space of the
image. It can present straight facades perpendicular
to the observer point of view as well as facades seen
from an oblique perspective (Figure 3(a)).
Sideways buildings (Figure 3(b)) refer to images
where we observe building facades on both sides of a
1
The ASQC (1983) Glossary and Tables for Statistical
Quality Control defines fractional factorial design in the fol-
lowing way:
A factorial experiment in which only an ade-
quately chosen fraction of the treatment combina-
tions required for the complete factorial experiment
is selected to be run.
(a) Frontal buildings
(b) Sideways buildings
Figure 3: Examples of buildings in the dataset.
street. We thought it important to do this categoriza-
tion of the images to show the impact of occlusion on
architectural details in the buildings.
3.1.1 Affine Transformations and Occlusions
We have tested successively two images from
the Rheims theater, with two different kinds
of transformations: a change of scale, with 9
values {0.4,0.6,...,1.8,2.0}, and a rotation,
with an angle taking successively 10 values
{−50
◦
,−30
◦
,...,40
◦
,50
◦
}. Occlusion is a con-
trolled independent variable with two values
{0,1/3}, meaning the image is complete or its right
third is replaced by black color.
3.2 Estimated Ground Truth
In this second stage, we look forward to obtain, for
every pair of images, a list of the correct feature
point matches. Since the detectors generate a mul-
titude of feature points per image, manually iden-
tifying matches for a large database would be ex-
tremely time-consuming and will potentially intro-
duce a great variability making the expertise not re-
producible. Fortunately, knowing the mapping be-
tween two images enables to automatically resolve
the matching evaluation problem.
3.2.1 Homography
To evaluate the detector/descriptor couples working
on two postcards of the same building at different time
periods, we first estimate the ground truth transfor-
mation existing between the two images as a homog-
raphy. Four couples of correspondences are interac-
tively defined to estimate a ground truth homography
matrix.
CanFeaturePointsBeUsedwithLowResolutionDisparateImages?-ApplicationtoPostcardDataSetfor4DCity
Modeling
483
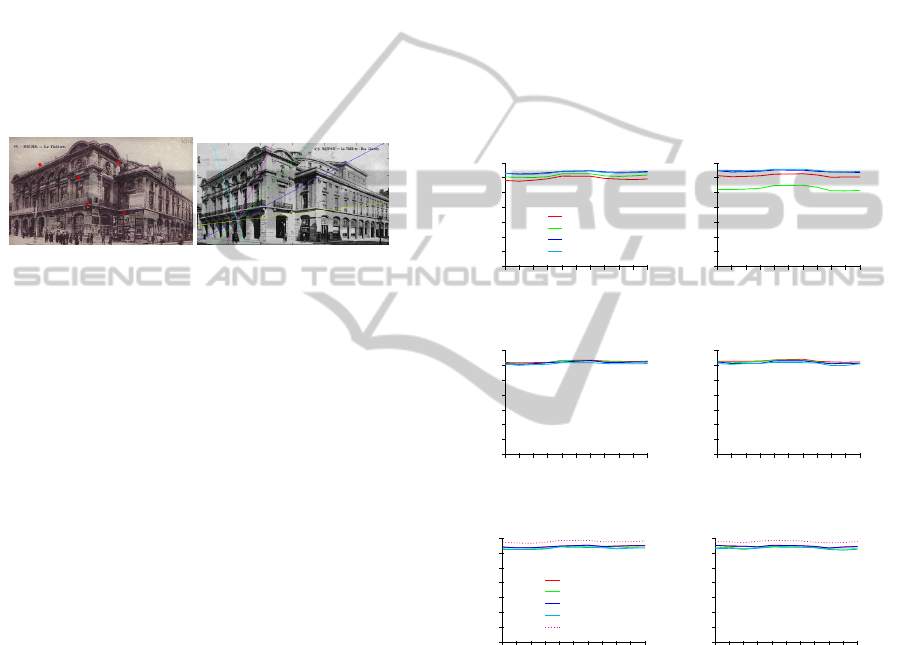
3.2.2 Epipolar Geometry
Since in computer vision homography relates to any
two images of the same planar surface in space, this
transformation is not sufficient to represent the defor-
mations of a 3D scene. In return, epipolar geome-
try models 3D geometry occurring when two cameras
take a photo of the same 3D object scene. It allows
a point-to-line correspondence associating a point in
a reference image with an epipolar line to which be-
longs the real corresponding point in the query image
(figure 4). This can be obtained by computing the
fundamental matrix corresponding to the epipolar ge-
ometry and requires eight couples of correspondences
between the two images.
Figure 4: Epipolar lines (right) of the red points (left).
4 RESULTS and DISCUSSION
In this section we present the results obtained along
our evaluation process. We study the mean precision
of every descriptor computed for all detectors. We
observe that when working on the complete image
with no imposed occlusion, any detector-descriptor
has roughly the same behavior for both images cat-
egories (comparison between first and second row
of figures 7 and 5). For scale changes, the perfor-
mances of steerable filters descriptors and PCA-SIFT
descriptors (figures 7(a),(c),(b),(d)) drop down when
scale shifts farther then 1. The SIFT descriptor (fig-
ures 7(e)(f)) still returns good results for scale vary-
ing between 0.4 and 1.4, and even until a scale of
2.0 when this descriptor is computed for SIFT interest
points.
For rotation changes the overall detector-
descriptor performance is more stable than for the
scale changes case. Amongst the three evaluated
descriptors, SIFT leads to the higher precision mean
(figure 5). The performance of the SIFT descriptor is
the best when combined with the SIFT detector.
We then study the influence of the occlusion.
For frontal buildings, the performance curves have
roughly the same behavior in both transforma-
tion types (scale and rotation) for all the descrip-
tors as in the case of the full image test (fig-
ures 7(a), 7(c), 7(e), 5(a), 5(c), 5(e) compared re-
spectively to figures 8(a), 8(c), 8(e), 6(a), 6(c), 6(e)),
though the mean percentages of good matches de-
crease. For sideways buildings, the occlusion changes
the detector response in the case of steerable filters
(figures 8(b) vs 7(b) and 6(b) vs 5(b)). PCA-
SIFT and SIFT behave similarly, as for the full im-
age, with a decrease in precision (figures 8(d)vs 7(d),
6(d)vs 5(d), 8(f)vs 7(f), 6(f)vs 5(f)).
In the case of partial occlusion, the main differ-
ence between frontal and sideways buildings arises in
the scale tests where the matching quality of steerable
filters and PCA-SIFT is lower for sideways category
(figures 8(a)vs 8(b) and 8(c)vs 8(d)).
For both categories, the obtained results attest
a coherence with the previous comparative studies.
The SIFT detector-descriptor over-performs the other
combinations for all cases.
-50
-40
-30
-20
-10
0
10
20
30
40
50
30
40.0
50
60
70
80
90
100
Rotation Angle
Precision
Harris Affine
Hessian Affine
Harris Laplace
Hessian Laplace
(a) Steerable filter descriptor
-50
-40
-30
-20
-10
0
10
20
30
40
50
30
40.0
50
60
70
80
90
100
Rotation Angle
Precision
(b) Steerable filter descriptor
-50
-40
-30
-20
-10
0
10
20
30
40
50
30
40.0
50
60
70
80
90
100
Rotation Angle
Precision
(c) PCA-SIFT descriptor
-50
-40
-30
-20
-10
0
10
20
30
40
50
30
40.0
50
60
70
80
90
100
Rotation Angle
Precision
(d) PCA-SIFT descriptor
-50
-40
-30
-20
-10
0
10
20
30
40
50
30
40.0
50
60
70
80
90
100
Rotation Angle
Precision
Harris Affine
Hessian Affine
Harris Laplace
Hessian Laplace
SIFT
(e) SIFT descriptor
-50
-40
-30
-20
-10
0
10
20
30
40
50
30
40.0
50
60
70
80
90
100
Rotation Angle
Precision
(f) SIFT descriptor
Figure 5: Rotation tests for frontal buildings (left column)
and sideways buildings (right column).
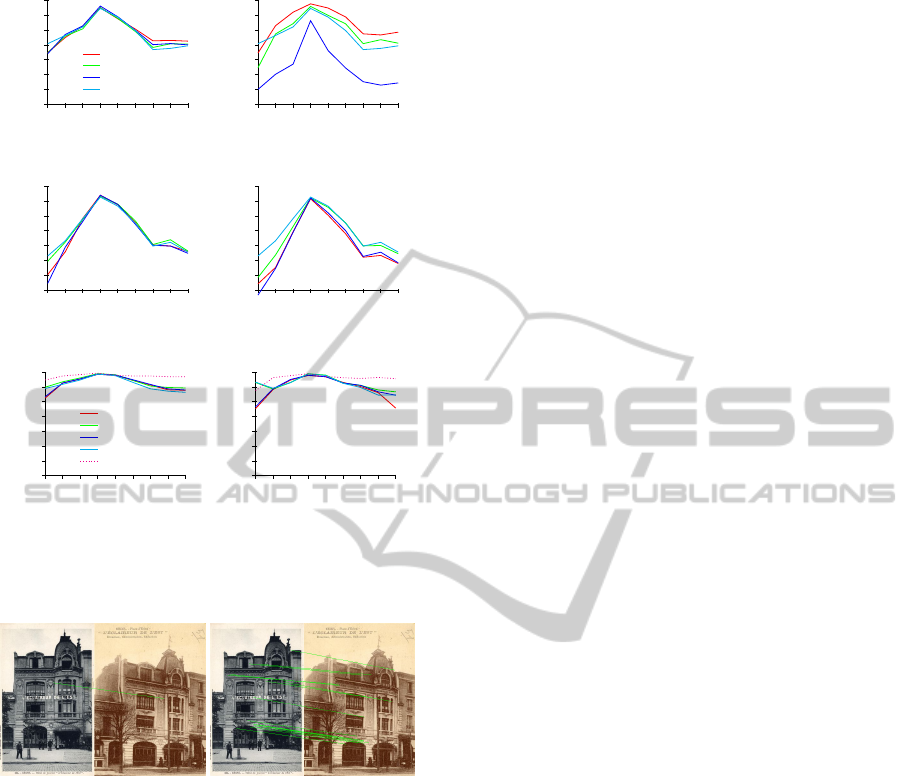
4.1 Estimated Ground Truth
In this section we present the matching result of two
images taken at different epochs. The angle of view
and the scale of the views can be different. An es-
timated ground truth is interactively computed based
on the choice of major correspondences for every pair
of images. We estimate a homography matrix as well
as a fundamental matrix that describes the epipolar
geometry of the scene. Thanks to what we got as
VISAPP2013-InternationalConferenceonComputerVisionTheoryandApplications
484
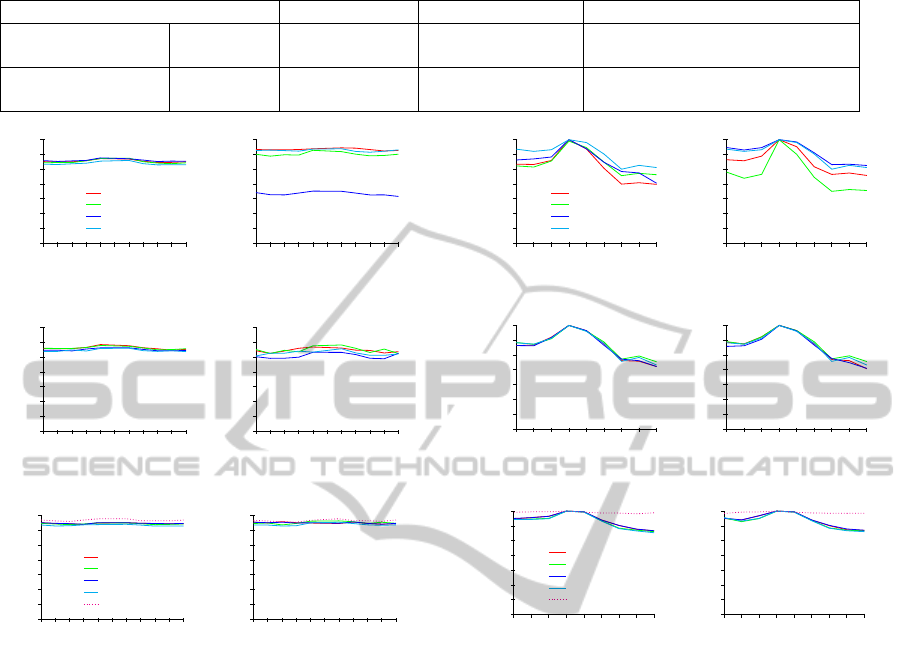
Table 1: Result table for homography and epipolar geometry ground truth estimated for pairs of dissimilar images.
Features Precision mean Precision Variance Mean number of correct Matches
Homography
SIFT-Lowe 60.1% 26.4 69.6
ASIFT 32.7% 31.4 137.8
Epipolar Geometry
SIFT-Lowe 61.7% 25.8 70.9
ASIFT 33.5% 24.1 130.1
-50
-40
-30
-20
-10
0
10
20
30
40
50
30
40.0
50
60
70
80
90
100
Occlusion Rotation Angle
Precision
Harris Affine
Hessian Affine
Harris Laplace
Hessian Laplace
(a) Steerable filter descriptor
-50
-40
-30
-20
-10
0
10
20
30
40
50
30
40.0
50
60
70
80
90
100
Occlusion Rotation Angle
Precision
(b) Steerable filter descriptor
-50
-40
-30
-20
-10
0
10
20
30
40
50
30
40.0
50
60
70
80
90
100
Occlusion Rotation Angle
Precision
(c) PCA-SIFT descriptor
-50
-40
-30
-20
-10
0
10
20
30
40
50
30
40.0
50
60
70
80
90
100
Occlusion Rotation Angle
Precision
(d) PCA-SIFT descriptor
-50
-40
-30
-20
-10
0
10
20
30
40
50
30
40.0
50
60
70
80
90
100
Occlusion Rotation Angle
Precision
Harris Affine
Hessian Affine
Harris Laplace
Hessian Laplace
SIFT
(e) SIFT descriptor
-50
-40
-30
-20
-10
0
10
20
30
40
50
30
40.0
50
60
70
80
90
100
Occlusion Rotation Angle
Precision
(f) SIFT descriptor
Figure 6: Rotation tests with occlusion for frontal buildings
(left column) and sideways buildings (right column).
results in the previous section, we limit our test in
this section to the SIFT features that gave the best
performance and invariance. Since we utilize images
from different perspectives, we introduce the ASIFT
method (Yu and Morel, 2011), a variant of the SIFT
detector. It simulates a set of sample views of the im-
age obtained by varying camera axis orientation from
a frontal position, and performs the SIFT matching
within the set of simulated samples. In order to give a
fair comparison we disable the last step of the ASIFT
algorithm that performs a probabilistic method for
the rejection of outliers based on an epipolar geo-
metrical model fitting for the set of established cor-
respondences. We present in table 1 the results for
the matching precision (its mean and variance) and
the mean number of correct matches. Both types of
estimated ground truth geometry (homography and
epipolar geometry (table 1)) are presented.
We observe the performance of the SIFT based
descriptors in the matching process for the dissimi-
0.4
0.6
0.8
1.0
1.2
1.4
1.6
1.8
2.0
30
40.0
50
60
70
80
90
100
Scale
Precision
Harris Affine
Hessian Affine
Harris Laplace
Hessian Laplace
(a) Steerable filter descriptor
0.4
0.6
0.8
1.0
1.2
1.4
1.6
1.8
2.0
30
40.0
50
60
70
80
90
100
Scale
Precision
(b) Steerable filter descriptor
0.4
0.6
0.8
1.0
1.2
1.4
1.6
1.8
2.0
30
40.0
50
60
70
80
90
100
Scale
Precision
(c) PCA-SIFT descriptor
0.4
0.6
0.8
1.0
1.2
1.4
1.6
1.8
2.0
30
40.0
50
60
70
80
90
100
Scale
Precision
(d) PCA-SIFT descriptor
0.4
0.6
0.8
1.0
1.2
1.4
1.6
1.8
2.0
30
40.0
50
60
70
80
90
100
Scale
Precision
Harris Affine
Hessian Affine
Harris Laplace
Hessian Laplace
SIFT
(e) SIFT descriptor
0.4
0.6
0.8
1.0
1.2
1.4
1.6
1.8
2.0
30
40.0
50
60
70
80
90
100
Scale
Precision
(f) SIFT descriptor
Figure 7: Scale tests for frontal buildings (left column) and
sideways buildings (right column).
lar images. SIFT performs better then ASIFT both
in terms of precision and computation time. How-
ever, it fails in some cases to find a sufficient number
of matches (figure 9) needed for the last step of the
structure from motion process.
5 CONCLUSIONS
We proposed a two stage methodology for the eval-
uation of the matching responses of feature points
detector-descriptor couples, in the specific context
where images are old postcards of buildings. This
evaluation is the first step toward an 3D reconstruction
of Rheims city over time. We seek temporal evolution
of the buildings in the city. On one hand, we evalu-
ated different combinations of state-of-the-art detec-
tors and descriptors. We imposed known affine trans-
formations to a test set of old post cards. The SIFT
detector was the most invariant for affine transforma-
CanFeaturePointsBeUsedwithLowResolutionDisparateImages?-ApplicationtoPostcardDataSetfor4DCity
Modeling
485
0.4
0.6
0.8
1.0
1.2
1.4
1.6
1.8
2.0
30
40.0
50
60
70
80
90
100
Scale
Precision
Harris Affine
Hessian Affine
Harris Laplace
Hessian Laplace
(a) Steerable filter descriptor
0.4
0.6
0.8
1.0
1.2
1.4
1.6
1.8
2.0
30
40.0
50
60
70
80
90
100
Scale
Precision
(b) Steerable filter descriptor
0.4
0.6
0.8
1.0
1.2
1.4
1.6
1.8
2.0
30
40.0
50
60
70
80
90
100
Scale
Precision
(c) PCA-SIFT descriptor
0.4
0.6
0.8
1.0
1.2
1.4
1.6
1.8
2.0
30
40.0
50
60
70
80
90
100
Scale
Precision
(d) PCA-SIFT descriptor
0.4
0.6
0.8
1.0
1.2
1.4
1.6
1.8
2.0
30
40.0
50
60
70
80
90
100
Scale
Precision
Harris Affine
Hessian Affine
Harris Laplace
Hessian Laplace
SIFT
(e) SIFT descriptor
0.4
0.6
0.8
1.0
1.2
1.4
1.6
1.8
2.0
30
40.0
50
60
70
80
90
100
Scale
Precision
(f) SIFT descriptor
Figure 8: Scale tests with occlusion for frontal buildings
(left column) and sideways buildings (right column).
Figure 9: Valid matches obtained with the homography
ground truth estimate, using the SIFT detector-descriptor
(left) and the ASIFT algorithm (right).
tion and tilts in the images as well as for occlusions.
On the other hand, we processed to more disparate
images for buildings at different epochs. The SIFT
algorithm responds to the need of our application in
most of the cases. When it fails to get the necessary
number of matches we will use the ASIFT extension
followed by a model fitting probabilistic filtering.
ACKNOWLEDGMENTS
The authors are grateful to Olivier Rigaud for pro-
viding old Rheims postcards, Krystian Mikolajczyk,
David Lowe, Guoshen Yu and Jean-Michel Morel for
providing part of all of their detectors and descriptors
implementations.
REFERENCES
Agarwal, S., Furukawa, Y., Snavely, N., Simon, I., Curless,
B., Seitz, S., and Szeliski, R. (2011). Building rome in
a day. Communications of the ACM, 54(10):105–112.
Debevec, P. E., Taylor, C. J., and Malik, J. (1996). Mod-
eling and rendering architecture from photographs:
A hybrid geometry- and image-based approach. In
Proceedings of the ACM SIGGRAPH Conference on
Computer Graphics, pages 11–20.
Gat, C., Albu, A. B., German, D., and Higgs, E. (2011). A
comparative evaluation of feature detectors on historic
repeat photography. In Proceedings of the 7th Interna-
tional Conference on Advances in Visual Computing -
Volume Part II, ISVC’11, pages 701–714.
Gauglitz, S., H
¨
ollerer, T., and Turk, M. (2011). Evaluation
of interest point detectors and feature descriptors for
visual tracking. International Journal of Computer
Vision, 94(3):335–360.
Gil, A., Mozos, O. M., Ballesta, M., and Reinoso, O.
(2010). A comparative evaluation of interest point de-
tectors and local descriptors for visual SLAM. Ma-
chine Vision Applications, 21(6):905–920.
Ke, Y. and Sukthankar, R. (2004). PCA-SIFT: a more dis-
tinctive representation for local image descriptors. In
Proceedings of IEEE Conference on Computer Vision
and Pattern Recognition, volume 2, pages 506–513,
Washington, DC, USA.
Lowe, D. G. (2004). Distinctive image features from scale-
invariant keypoints. International Journal of Com-
puter Vision, 60(2):91–110.
Mikolajczyk, K. and Schmid, C. (2005). A perfor-
mance evaluation of local descriptors. IEEE Trans-
actions on Pattern Analysis & Machine Intelligence,
27(10):1615–1630.
Moreels, P. and Peron, P. (2007). Evaluation of features
detectors and descriptors based on 3D objects. Inter-
national Journal of Computer Vision, 73(3):263–284.
Pollefeys, M., Koch, R., Vergauwen, M., and Van Gool, L.
(2000). Automated reconstruction of 3D scenes from
sequences of images. ISPRS Journal of Photogram-
metry and Remote Sensing, 55(4):251–267.
Snavely, N., Seitz, S. M., and Szeliski, R. (2006). Photo
tourism. page 835. ACM Press.
Younes, L., Romaniuk, B., and Bittar, E. (2012). A com-
prehensive and comparative survey of the SIFT algo-
rithm (feature detection, description, and characteri-
zation). In Proceedings of the 7th International Con-
ference on Computer Vision Theory and Applications,
VISAPP’12.
Yu, G. and Morel, J.-M. (2011). ASIFT: An algorithm for
fully affine invariant comparison. Image processing
online.
VISAPP2013-InternationalConferenceonComputerVisionTheoryandApplications
486
