
Development of an Analysis System and Class Recordings linked
to More than One Course Evaluation Data using Smartphones
Akihiro Aoyagi
1
, Darold Davis
2
, Takuya Kato
3
and Akinobu Ando
4
1
Miraitos, Inc., 6F Kitame-machi 2-39, Aoba-ku, Sendai, Japan
2
Replicant AD, LLC 1145 Walnut Street, Berkeley, CA 94707-2616,U.S.A.
3
Iwanuma Elementary School, Chuo2-1-1,Iwanuma, Japan
4
Miyagi University of Education, 149Aramaki-Aoba,Aoba-ku, Sendai, Japan
Keywords: Lesson Analysis, Smartphone, Video Collaboration, Immediacy, Lesson Visualization.
Abstract: In this present research, we have developed a class analysis system with the goal of lesson improvement.
The system is web-based application, and works by general hardware, for example standard laptop, USB
cameras, and smartphones. The characteristics of this system are, while recording the lesson with two USB
cameras, more than one classroom observer can record lessons using three buttons (“good!”, “what?”, “!?”)
and one text field with the smartphone as an information evaluation input terminal. Using this lesson
analysis system, you can reduce the specialized equipment that is needed when recording and analysis of the
class. So, when the teacher is reflecting back on his own class and making refinements to the lessons, they
can do it quickly and easily. In this study, at an actual elementary school in Japan, for the teacher to reflect
upon their lessons, it will be beneficial in actually using this system to make improvements to the class.
1 INTRODUCTION
"Lesson Research" has long been conducted in
Japan. In lesson research in Japan, after the class is
over, it's common for the teachers who conduct
classes, and the person who sits in on the lesson (for
inspection) to have an open meeting reflecting back
about the lesson that took place. In the meeting, the
participants will have a discussion about the good
points and bad points of the lesson. Through this
review, the teacher is able to refine the technology
for conducting lessons in a class. The technique of
using audio-visual equipment for the analysis of
classroom lessons came into the field of educational
technology in the 1970s. Since that time, methods to
record lessons using a video camera and for
reflecting on those lessons using video have been
developed. This method that had been used of the
teacher and class inspector reflecting on the lesson
after class using recorded video was called “class
analysis by stop motion method”. In particular,
"VTR interruption strategy" several video cameras
are prepared, recording teachers and students at the
same time, then at the class review meeting that
video footage is paused for discussion. With a
method of using recorded video lessons like this,
many can share the video scenes more concretely.
So, rather than a meeting about the lesson that relies
solely on memory, it can be discussed based on the
images that can be commonly understood by
everyone which is an advantage. However, looking
at the video from the beginning to the end of class
requires more time, or about the same as the class
time. And, even if you want to see only the class
scenes of concern, it is difficult even to fast-forward
to the scene in the video. When recording with a
single camera, you can only record from one point
of view. In the introspection meeting, it’s important
to grasp not only what the teacher is doing, but also
what the students are doing as well.
For that reason, it certainly is better if multiple
video cameras were installed in the classroom. But
eventually, because the preparation is an enormous
task, there is no opportunity to use this setup on a
daily basis. It is in these recent years by a dedicated
data input terminal that marking above the recorded
video’s timeline to cue distinguishing scenes and a
system that can also look back on the each lessons
evaluation information has been developed (Photron,
2012). This is available for a wide range of training,
such as teaching nursing practice and job interviews.
However, although the function is good however
43
Aoyagi A., Davis D., Kato T. and Ando A..
Development of an Analysis System and Class Recordings linked to More than One Course Evaluation Data using Smartphones.
DOI: 10.5220/0004384500430047
In Proceedings of the 5th International Conference on Computer Supported Education (CSEDU-2013), pages 43-47
ISBN: 978-989-8565-53-2
Copyright
c
2013 SCITEPRESS (Science and Technology Publications, Lda.)

because of the high price it is not easily available in
the general education setting. Furthermore, in
addition to the evaluation information input terminal
and special equipment, you must purchase the
required number of devices.
In this study, we aimed to develop a class
analysis system that can use ordinary smartphones as
evaluation information input terminals
2 SYSTEM OVERVIEW
2.1 Development Concept
The concept of this development system is to reduce
the burden on the user as much as possible without
the use of a special environment or equipment.
Therefore, a Centrino spec Windows laptop with a
Core2 CPU, and 1 GB of memory, can run iPhone
and Android smartphones or phones as a cheap
ordinary USB camera, and evaluation of information
input device. The operating environment was
composed of all freeware. As a development idea,
we expect to formulate a “good!” lesson and to
promote the improvement of teaching classes. So we
named this system Good Processor.
2.2 Structure of the System
The system configuration can be broadly divided
into the following components:
1. Web server
2. Recording process
3. Screen drawing
4. Evaluation input process
5. Composed of the data storage unit
As mentioned previously, the system is
configured with all freeware. The Web server is
using Apache, the recording process is managed
using Red5; the data storage is handled by PHP and
MySQL, and Flex is used for graph drawing and
operation screen (Figure 1). Once installed, it’s not
necessary to adjust the settings for everything in
order to start the OS service level. When you want to
use the system, if you connect a USB camera to a
PC it’s possible to start taking recordings of the
lessons.
By way of a Wi-Fi connection, possibly a 3G,
evaluation data is sent to the system from the
smartphone or mobile phone in use by the inspector.
Since the system provides no constraints with regard
to the number of connections, it’s possible to make
connections up to the limit of the physical Wi-Fi
Figure 1: Structure of the System.
2.3 System Functionality
The system consists of a component that displays the
analysis result from the recorded data and a part that
records the lesson data. In order to record data, the
person inspecting the class holds a smartphone or
tablet PC and an evaluation input page for
instructional use is display (Figure 2).
Figure 2: An evaluation input page on a smartphone.
The evaluation input page, has 3 kinds of buttons,
and a comments field. The inspector while observing
the lesson presses the “good!” button when they
think it’s good and presses the “what?” button when
they think it’s not so good, and after it’s confirmed
the “!?” is pressed when they think it’s good. If,
when you want to record something of note, you can
also send comments. While receiving evaluation
data from each terminal, the systems records what
kind of evaluation data was sent, when, and from
which terminal into a database. When the class
concludes, the analysis results screen appears
(Figure 3).
Web Serve
r
CSEDU2013-5thInternationalConferenceonComputerSupportedEducation
44
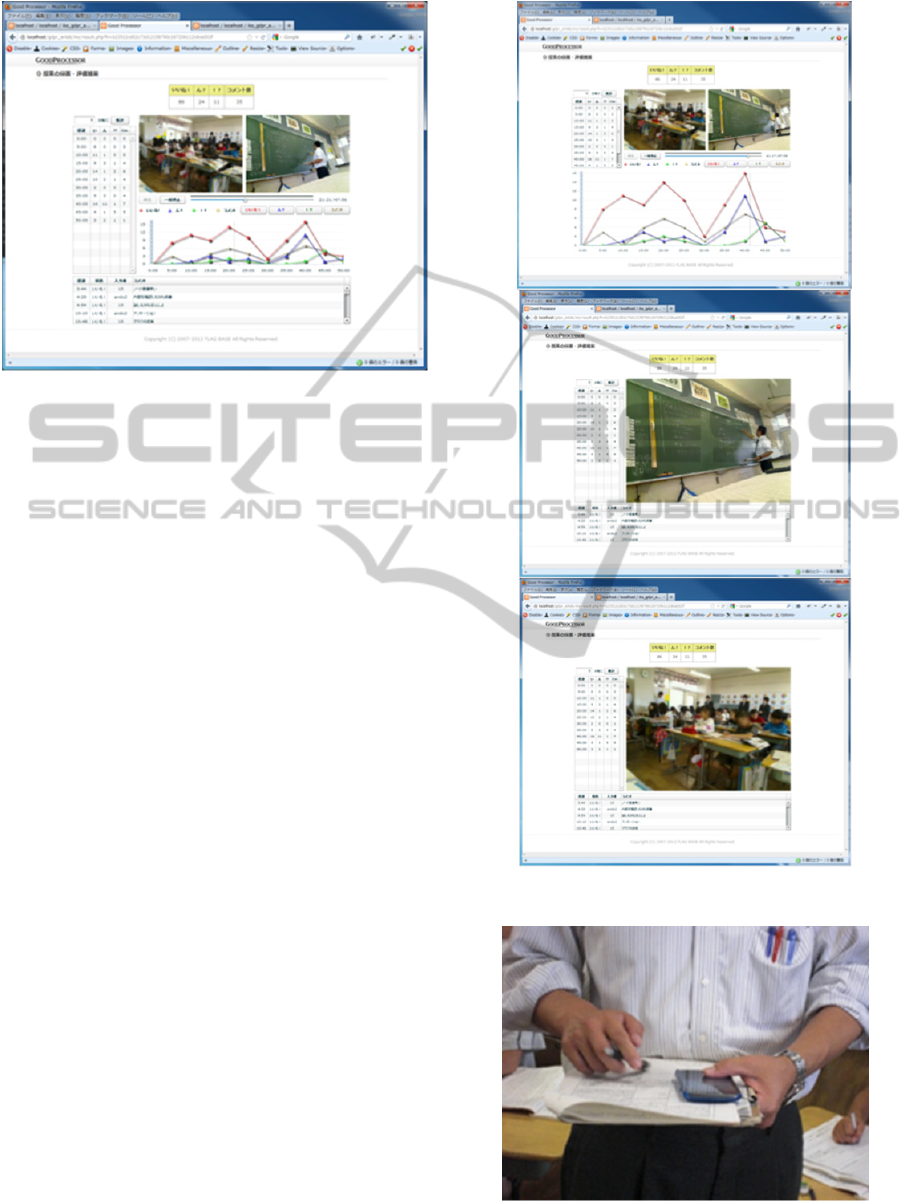
Figure 3: A sample of an analysis results screen.
At the analysis screen, evaluation information that
was recorded is added up, and a comment and graph
display is performed. By the data display, there is a
recorded video lesson and comments, a chart that
can add up each data at any time interval and, one
can grasp the state of the class by the time series line
chart graph that’s connected with that. When each
data is clicked, the video is cued to the scene that
was sent to that data. The evaluation information
time that was sent is recorded in seconds in order to
make a graph seek the aggregate results minute by
minute by the initial settings. This time, the options
are modifiable depending on the purpose. For
example, if a graph is made for the aggregate results
every 10 minutes, one is able to grasp the rough state
of the class. On the other hand, if we aggregate
every 30 seconds one will understand the lesson in
finer detail. By clicking on the video, graph or
comment the display can be enlarged. By using this,
one can see easier when reflecting on class lessons
(Figure 4).
3 CLASS ANALYSIS CASE
Good Processor has been adopted as a means to
improve the teacher's lecture in Miyagi Prefecture
Iwanuma city school. In this paper, a case that took
place on 9/28/2012 is described. The class was a
second grade Japanese language class. In this class,
“watch for scenes in the story, and being able to read
the feeling and state of a person” are the goals.
There were 22 teachers who sat in on classes and
entered the evaluation information. Evaluators, with
smartphone in hand, visited classes while taking
notes with a pen, as shown in figure 5.
Figure 4: Views of enlarged each element.
Figure 5: An evaluator, with smartphone in hand, inputting
comments and remarks while taking notes with a pen.
DevelopmentofanAnalysisSystemandClassRecordingslinkedtoMorethanOneCourseEvaluationDatausing
Smartphones
45
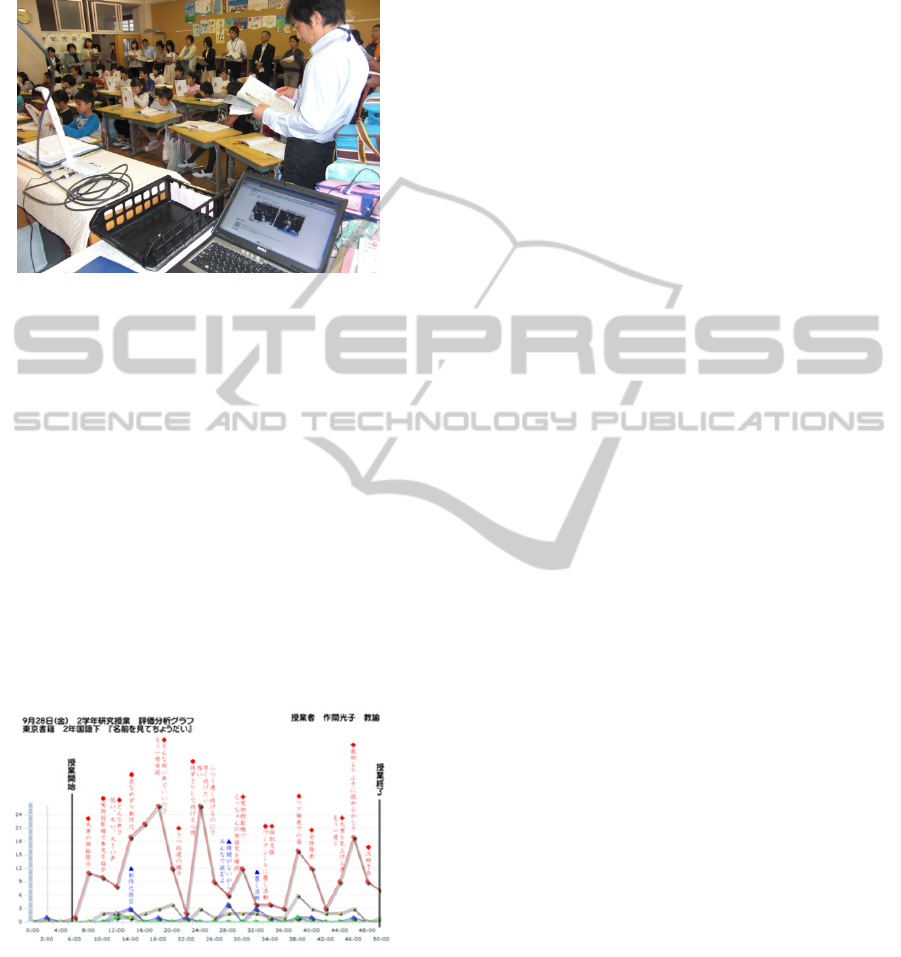
Figure 6 shows the state of class in an actual
situation. In the foreground, a notebook that has the
system installed is pictured.
Figure 6: A state of class in an actual situation.
After the lesson, all the teachers who sat in on
classes had a meeting reflecting on the lessons at the
Board of Education. At this conference a description
was given about the classes that day from the
teachers that made the first lessons.
Next, the teachers who participated were divided
into groups and discussed good points,
improvements and the points that have been devised
based on the results of the analysis about the lessons.
And then we present the results that were discussed,
and a concrete improvement plan was discussed with
all the participants. Finally, we received advice from
the Board of Education committee.
Figure 7 is a line chart shown in a time series of
the lesson evaluation data.
Figure 7: Time series line graph.
This diagram has the aggregation set for every 2
minutes. The line has changed considerably;
however “good!” shows changes that were pressed.
Although we see there are some mountainous peeks,
those parts mean the places many people thought
were ″ good ″ scenes. Near the bottom of the
diagram, another graph can be seen. “what?” button
is the state of how little has changed can be seen at
the bottom of the figure.
In this class, around 20 minutes after the start of
the lesson, there is a scene in which the inspectors
received a ″not so good″ impression. We know that
there was something wrong with that part of the
lesson, since the graph of “good!” has fallen. On the
other hand, around 38 minutes after the start of the
lesson, despite the increasing number of “good!” we
have found many people who received the ”not so
good” impression.
In summary, since the evaluation is divided, this
scene can be said to be a scene that is worth
discussing concerning what someone would think. In
the class, there are times where the best scenes that
were evaluated where in the middle of the first half
of the class. Here, some scenes the teacher
questioned the students regarding reading. These
scenes are an important influence that greatly affects
the success or failure of this class. These scenes,
which are the top rated, can be said to have the
desired results. On the other hand, after 28 minutes,
the number of “good!” reduces and “what?”
increases. This part is, is the place many people in
the class thought “what?” since we have less time
than the rest of the lesson plan, this part is a scene in
which the teacher has changed the schedule of
classes. Before this scene, the students were talking
about when reading, how to tell a story vividly to the
listener. However we were not able to take
advantage of the results of that discussion.
In the case of the debate by the inspectors, when
using the system it was easy to understand if it were
a scene where you needed to hold discussions. But if
this system is not used, the inspectors would just say
the point that they were worried about and would
have spoken only what they thought. However,
using the system, the differences of opinion and
other people's thoughts appear in the shape of a
graph. When using a survey by questionnaire
available in a 5-point scale, the readability of the
screen had an average rating of 4.4, and the
readability of the results was 3.9. The main
comments of “it’s interesting and could be evaluated
quantitatively in class”, “other teachers could
understand how their feelings changed while
observing the class”, and “they could grasp the most
critical point of the lessons” was the positive
assessment of the class. On the other hand as for
improvement points, “because I’m not accustomed
to the operation of a smartphone I wouldn’t know
how to use it”, “the weight of the smartphone is a bit
heavy”, “I want to also see the analysis result screen
on a tablet PC” were some of the things mentioned.
CSEDU2013-5thInternationalConferenceonComputerSupportedEducation
46

4 CONCLUSIONS
In this study, a system for analysis and reflection of
class lessons was developed. The goal was to make
it easy as possible in a practical classroom and for an
investigative review committee to examine. The
system can record lesson from two point of view and
evaluation data from more than one classroom
observer inputted by smartphone. By using a
smartphone made to correspond to the input
terminal, the preparation was possible in a short time
even when using a laptop and USB camera. From
the graph and chart that aggregates the data, the
flexible visualization of the class could be realized.
At an actual elementary school, it was used as a
means to look back on the lessons and I was able to
get high ratings from teachers. And, the main
comments from teacher were the positive assessment
of the class. However, there were several comments
as for improvement points of the system. For that
reason, In the future, it is necessary to proceed with
the support in the form of a tablet PC and other
devices.
ACKNOWLEDGEMENTS
This work was supported by KAKENHI (24730721).
REFERENCES
Fujioka, N., 1988. One-hour Class Technology with Stop-
Motion Method. Japan Book Publishers Association.
Yoshizaki, S., 1983. Teacher Decision-Making while
Conducting Classroom Instructions. Japan Journal of
Educational Technology, 8(2), 61-70
Nakajima, T., 2008. Supporting for Teaching
Improvement by Integrating Video Recording with
Real-time Feedback through Response Analyzers.
Japan journal of educational technology, 32(2), 169-
179
Ogawa, H., Kakegawa, J., Ishida, T., Morihiro, K., 2012.
A study of trial use of a video sharing system for
collaborative lesson improvement. Educational
Technology Research, 35, 81-89
Miura, K., Nakajima, T., Watanabe, S., 2012. A study on
teaching reflection methods using Tegaki PAD and the
class improvement. RESEARCH REPORT OF JSET
CONFERENCES, 2012(2), 57-60
Photron PF-NOTE. (2012). Retrived from
http://www.photron.co.jp/pf-note/index.html
DevelopmentofanAnalysisSystemandClassRecordingslinkedtoMorethanOneCourseEvaluationDatausing
Smartphones
47
