
A Formal Passive Performance Testing Approach for Distributed
Communication Systems
Xiaoping Che and Stephane Maag
Telecom SudParis, CNRS UMR 5157, 9 rue Charles Fourier, 91011 Evry Cedex, France
Keywords:
Performance Testing, Distributed Framework, Formal Methods.
Abstract:
Conformance testing of communicating protocols is a functional test which verifies whether the behaviors
of the protocol satisfy defined requirements, while the performance testing of communicating protocols is a
qualitative and quantitative test, aiming at checking whether the performance requirements of the protocol
have been satisfied under certain conditions. It raises the interesting issue of converging these two kinds of
tests by using the same formal approach. In this paper, we present a novel logic-based approach to test the
protocol performance through real execution traces and formally specified properties. In order to evaluate
and assess our methodology, we have developed a prototype and present experiments with a set of IMS/SIP
properties. Finally, the relevant verdicts and discussions are provided.
1 INTRODUCTION
In the recent years, many studies on checking the be-
havior of an Implementation Under Test (IUT) have
been performed. Important works are about the record
of the observation during run-time and its comparison
with the expected behavior defined by either a for-
mal model (Lee and Miller, 2006) or a set of formally
specified properties (Lalanne and Maag, 2012) ob-
tained from the requirements of the protocol. The ob-
servation is performed through Points of Observation
(PO) set on monitored entities composing the Sys-
tem Under Test (SUT). These approaches are com-
monly identified as Passive Testing approaches (or
monitoring). With these techniques, the protocol mes-
sages observed in execution traces are generally mod-
eled and analyzed through their control parts (Hierons
et al., 2009). In (Lalanne et al., 2011) and (Che et al.,
2012), a data-centric approach is proposed to test the
conformance of a protocol by taking account the con-
trol parts of the messages as well as the data values
carried by the message parameters contained in an ex-
tracted execution trace.
However, within the protocol testing process, con-
formance and performance testing are often associ-
ated. They are mainly applied to validate or verify the
scalability and reliability of the system. Many bene-
fits can be brought to the testing process if both inherit
from the same approach. Our main objective is then
to propose a novel passive distributed performance
testing approach based on our formal conformance
testing technique (Che et al., 2012). Although some
crucial works have been done in conformance testing
area (Bauer et al., 2011), they study run-time verifica-
tion of properties expressed either in linear-time tem-
poral logic (LTL) or timed linear-time temporal logic
(TLTL). Different from their work focusing on test-
ing functional properties based on formal models, our
work concentrates on formally testing non-functional
properties without formal models. Also note that, our
work is absorbed in the performance testing, not in
performance evaluation. While performance evalua-
tion of network protocols focuses on the evaluation of
its performance, performance testing approaches aim
at testing performance requirements that are expected
in the protocol standard.
Generally, the performance testing characteris-
tics are: volume, throughput and latency (Weyuker
and Vokolos, 2000), where volume represents ”to-
tal number of transactions being tested,” throughput
represents ”transactions per second the application
can handle” and latency represents ”remote response
time.” In this work, we firstly extend a proposed
methodology to present a passive testing approach for
checking the performance requirements of communi-
cating protocols. Furthermore, we define a formalism
to specify performance and time related requirements
represented as formulas tested on real protocol traces.
Finally, since several protocol performance require-
ments need to be tested on different entities during a
74
Che X. and Maag S..
A Formal Passive Performance Testing Approach for Distributed Communication Systems.
DOI: 10.5220/0004444000740084
In Proceedings of the 8th International Conference on Evaluation of Novel Approaches to Software Engineering (ENASE-2013), pages 74-84
ISBN: 978-989-8565-62-4
Copyright
c
2013 SCITEPRESS (Science and Technology Publications, Lda.)

common time period, we design a distributed frame-
work for testing our approach on run-time execution
traces.
Our paper’s primary contributions are:
• A formal approach is proposed for formally test-
ing performance requirements of Session Initia-
tion Protocol (SIP).
• A distributed testing framework is designed based
on an IP Multimedia Subsystem (IMS) environ-
ment.
• Our approach is successfully evaluated by experi-
ments on the Session Initiation Protocol.
The reminder of the paper is organized as follows.
In Section 2, a short review of the related works are
provided. In Section 3, a brief description of the syn-
tax and semantics used to describe the tested prop-
erties is presented. In Section 4, our framework has
been implemented and relevant experiments are de-
picted in Section 5. It has been performed through a
real IMS framework to test SIP properties. The dis-
tributed architecture of the IMS allows to assess our
approach efficiently. Finally, we conclude and pro-
vide interesting perspectives in Section 6.
2 RELATED WORKS
While a huge number of papers are dedicated to per-
formance evaluation, there are very few works tack-
ling performance testing. We however may cite the
following ones.
Many studies have investigated the performance
of distributed systems. A method for analyzing the
functional behavior and the performance of programs
in distributed systems is presented in (Hofmann et al.,
1994). In the paper, the authors discuss event-driven
monitoring and event-based modeling. However, no
evaluation of the methodology has been performed.
In (Dumitrescu et al., 2004), the authors present
a distributed performance-testing framework, which
aimed at simplifying and automating service perfor-
mance testing. They applied Diperf to two GT3.2 job
submission services, and several metrics are tested,
such as Service response time, Service throughput,
Offered load, Service utilization and Service fairness.
Besides, in (Denaro et al., 2004), the authors pro-
pose an approach based on selecting performance rel-
evant use-cases from the architecture designs, and ex-
ecute them as test cases on the early available soft-
ware. Finally, they conclude that the software per-
formance testing of distributed applications has not
been thoroughly investigated. An approach to perfor-
mance debugging for distributed systems is presented
in (Aguilera et al., 2003). This approach infers the
dominant causal paths through a distributed system
from traces. In addition, in (Yilmaz et al., 2005),
a new distributed continuous quality assurance pro-
cess is presented. It uses in-house and in-the field re-
sources to efficiently and reliably detect performance
degradation in performance-intensive systems.
In (Yuen and Chan, 2012), the authors present a
monitoring algorithm SMon, which continuously re-
duces network diameter in real time in a distributed
manner. Through simulations and experimental mea-
surements, SMon achieves low monitoring delay, net-
work tree, and protocol overhead for distributed ap-
plications. Similarly, in (Taufer and Stricker, 2003),
they present a performance monitoring tool for clus-
ters of PCs which is based on the simple concept of
accounting for resource usage and on the simple idea
of mapping all performance related state. They iden-
tify several interesting implementation issued related
to the collection of performance data on a Clusters of
PCs and show how a performance monitoring tool can
efficiently deal with all incurring problems. Neverthe-
less, these two last approaches do not provide a for-
malism to test a specific requirement. Our approach
allows to formally specified protocol performance re-
quirements to be tested on real distributed traces in
order to check whether the tested performance is as
expected by the protocol standard.
3 FORMAL APPROACH
3.1 Basics
A communication protocol message is a collection of
data fields of multiple domains. Data domains are de-
fined either as atomic or compound (Che et al., 2012).
An atomic domain is defined as a set of numeric or
string values. A compound domain is defined as fol-
lows.
Definition 1. A compound value v of length n > 0, is
defined by the set of pairs {(l
i
,v
i
) | l
i
∈ L ∧ v
i
∈ D
i
∪
{ε},i = 1...n}, where L = {l
1
,...,l
n
} is a predefined
set of labels and D
i
are data domains. A compound
domain is then the set of all values with the same set
of labels and domains defined as
h
L,D
1
,...,D
k
i
.
Once given a network protocol P, a compound do-
main M
p
can generally be defined by the set of labels
and data domains derived from the message format
defined in the protocol specification/requirements. A
message of a protocol P is any element m ∈ M
p
.
For each m ∈ M
p
, we add a real number t
m
∈ R
+
which represents the time when the message m is re-
ceived or sent by the monitored entity.
AFormalPassivePerformanceTestingApproachforDistributedCommunicationSystems
75

Example 1. A possible message for the SIP protocol,
specified using the previous definition could be
m = {(method,‘INVITE’),(time,‘644.294133000’),
(status,ε),( f rom,‘alice@a.org’),(to,‘bob@b.org’),
(cseq,{(num,7),(method,‘INVITE’)})}
representing an INVITE request from alice@a.org
to bob@b.org. The value of time ‘644.294133000’
(t
0
+ 644.294133000) is a relative value since the
PO started its timer (initial value t
0
) when capturing
traces.
A trace is a sequence of messages of the same
domain containing the interactions of a monitored
entity in a network, through an interface (the PO),
with one or more peers during an arbitrary period
of time. The PO also provides the relative time set
T ⊂ R
+
for all messages m in each trace.
3.2 Syntax and Semantics of our
Formalism
In our previous work, a syntax based on Horn clauses
is defined to express properties that are checked
on extracted traces. We briefly describe it in the
following. Formulas in this logic can be defined with
the introduction of terms and atoms, as it follows.
Definition 2. A term is defined in BNF as
term ::= c | x | x.l.l...l where c is a constant in
some domain, x is a variable, l represents a label, and
x.l.l...l is called a selector variable.
Example 2. Let us consider the following message:
m = {(method,‘INVITE’),(time,‘523.231855000’),
(status,ε),( f rom,‘alice@a.org’),(to,‘bob@b.org’),
(cseq,{(num,10),(method,‘INVITE’)})}
In this message, the value of method inside cseq
can be represented by m.cseq.method by using the
selector variable.
Definition 3. A substitution is a finite set of bindings
θ = {x
1
/term
1
,...,x
k
/term
k
} where each term
i
is
a term and x
i
is a variable such that x
i
6= term
i
and
x
i
6= x
j
if i 6= j.
Definition 4. An atom is defined as
A ::= p
k
z }| {
(term, ...,term)
| term = term
| term 6= term
| term < term
| term +term = term
where p(term, ...,term) is a predicate of label p and
arity k. The timed atom is a particular atom defined
as p
k
z }| {
(term
t
,...,term
t
), where term
t
∈ T .
Example 3. Let us consider the message m of the
previous example. A time constraint on m can be de-
fined as ‘m.time < 550’. These atoms help at defining
timing aspects as mentioned in Section 3.1.
The relations between terms and atoms are stated
by the definition of clauses. A clause is an expression
of the form
A
0
← A
1
∧ ... ∧ A
n
where A
0
is the head of the clause and A
1
∧ ... ∧ A
n
its
body, A
i
being atoms.
A formula is defined by the following BNF:
φ ::= A
1
∧ ... ∧ A
n
| φ → φ | ∀
x
φ | ∀
y>x
φ
| ∀
y<x
φ | ∃
x
φ | ∃
y>x
φ | ∃
y<x
φ
where A
1
,...,A
n
are atoms, n ≥ 1 and x,y are vari-
ables.
In our approach, while the variables x and y are
used to formally specify the message of a trace, the
quantifiers commonly define “it exists” (∃) and “for
all” (∀). Therefore, the formula ∀
x
φ means “for all
messages x in the trace, φ holds”.
The semantics used in our work is related to the
traditional Apt–Van Emdem–Kowalsky semantics for
logic programs (Emden and Kowalski, 1976), from
which an extended version has been provided in order
to deal with messages and trace temporal quantifiers.
Based on the above described operators and quanti-
fiers, we provide an interpretation of the formulas to
evaluate them to > (‘Pass’), ⊥ (‘Fail’) or ‘?’ (‘Incon-
clusive’).
We formalize the timing requirements of the IUT
by using the syntax above described, and the truth
values {>,⊥,?} are provided to the interpretation
of the obtained formulas on real protocol execution
traces. We can note that most of the performance
requirements are based on relative conformance
requirements. For testing some of the performance
requirements, both conformance and performance
formulas as well as a ‘?’ operator are used to resolve
eventual confusing verdicts.
Example 4. The performance requirement “the mes-
sage response time should be less than 5ms” (can be
formalized to formula ψ) is based on the conformance
requirement “The SUT receives a response message”
(can be formalized to formula ϕ).
Once a ‘>’ truth value is given to a performance
requirement, without doubt, a ‘Pass’ testing verdict
ENASE2013-8thInternationalConferenceonEvaluationofNovelSoftwareApproachestoSoftwareEngineering
76

should be returned for both the performance require-
ment and its relative conformance requirement. In the
Example 4, if a ‘>’ is given to the formalized perfor-
mance requirement ψ, it means the SUT received a
response message and the response time of this mes-
sage is less than 5ms, and the formalized relative con-
formance requirement ϕ also holds.
However, if a ‘⊥’ or ‘?’ truth value is returned for
a performance requirement, we can not distinguish
whether it does not satisfy the performance require-
ment or it does not satisfy the relative conformance
requirement. For instance, in Example 4, if a ‘⊥’ is
given to this formalized performance requirement ψ,
we can not distinguish whether it is owing to “The
message response time is greater than 5ms” or “The
SUT did not receive a response message”. Moreover,
once we have a ‘?’ result, it is tough to resolve it by
seeking the real cause. For solving these problems,
we define the function eval
?
providing a truth value
based on the evaluation of ϕ and ψ.
Definition 5. Let ϕ and ψ be two formulas, eval
?
is
defined as follows:
eval
?
(ϕ,ψ) =
> if eval(ϕ,θ, ρ) = >
and eval(ψ,θ, ρ) = >
? if eval(ϕ,θ, ρ) = ?
and eval(ψ,θ, ρ) = ?
⊥ otherwise
where eval(ϕ,θ, ρ) expresses the evaluation of a
formula ϕ, θ represents a substitution and ρ a finite
trace. Due to a lack of space, we do not herein present
our already published algorithm evaluating a formula
ϕ on trace ρ. However, the interested reader may
refer to our previous publication (Che et al., 2012).
As above mentioned, some of the performance re-
quirements need to be tested in a distributed way. We
focus on this aspect in the next section.
4 DISTRIBUTED FRAMEWORK
OF PERFORMANCE TESTING
4.1 Framework
For the aim of distributively testing conformance
and performance requirements, we use a passive dis-
tributed testing architecture. It is defined based on
the standardized active testing architectures (9646-1,
1994) (master-slave framework) in which only the PO
are implemented.
As Figure 1 depicts, it consists to one global mon-
itor and several sub testers. In order to capture the
transporting messages, the sub testers are linked to
the nodes to be tested. Once the traces are captured,
they will be tested through the predefined requirement
formulas, and the test results will be sent back to the
global monitor. On the other side, the global monitor
is attached to the server to be tested, aiming at collect-
ing the traces from the server and receiving statistic
results from sub testers. The collected aggregate re-
sults will be analyzed. This should intuitively reflects
the real-time conformance and performance condition
of the protocol during testing procedures.
Figure 1: Distributed testing architecture.
Initially, as the Figure 2 shows, the global monitor
sends initial bindings (formalized requirement formu-
las, testing parameters) to the sub testers. When the
testers receive these information, they initialize cap-
turing packets and save the traces to readable files dur-
ing each time slot. Once the readable files are gener-
ated, the testers will test the traces through the prede-
fined requirements formulas and send the results back
to the global monitor. The analyzer mentioned here is
a part of the Global Monitor, for precisely describing
the testing procedure, we illustrate it separately. This
testing procedure will keep running until the global
monitor returns the Stop command.
Figure 2: Sequence diagram between testers.
AFormalPassivePerformanceTestingApproachforDistributedCommunicationSystems
77

4.2 Synchronization
Several synchronization methods are provided in dis-
tributed environment (Shin et al., 2011). Besides,
Network Time Protocol (NTP) (Mills, 1991) is the
current standard for synchronizing clocks on the In-
ternet. Applying NTP, time is stamped on packet k by
the sender i upon transmission to node j (T
k
i j
). The
receiver j stamps its local time both upon receiving a
packet (R
k
i j
), and upon re-transmitting the packet back
to source (T
k
ji
). The source i stamps its local time upon
receiving the packet back (R
k
ji
). Each packet k will
eventually have four time stamps on it T
k
i j
, R
k
i j
, T
k
ji
and R
k
ji
. The computed round-trip delay for packet
k is RT T
k
i j
= (R
k
i j
− T
k
i j
) + (R
k
ji
− T
k
ji
). Node i esti-
mates its own clock offset relative to node j’s clock
as (1/2)[(R
k
i j
− T
k
i j
) + (R
k
ji
− T
k
ji
)], and the transmis-
sion process is shown in Figure 3.
Figure 3: Synchronization.
NTP is designed for synchronizing a set of enti-
ties in the networks. In our framework, relative timers
are used for all the testers. However, the mismatches
between these timers are ineluctable, especially the
mismatches between the global monitor timer and sub
tester timers would affect the results, when real-time
performance is being analyzed under the influence
of network events. Accordingly, the global monitor
and sub testers need to be synchronized, and synchro-
nizations between neighbor testers are not required.
For satisfying the needs, slight modifications have
been made to the transmission process. Rather than
exchanging the four time stamps in NTP, two time
duration are computed and exchanged. We choose
an existing successful transaction from the captured
traces, since the messages are already tagged with
time stamps when captured by the monitors, the re-
dundant tag actions can be omitted.
As illustrates in the Figure 3, the T
s
represents the
service time of the server (time for reacting when re-
ceiving a message), and T
1
represents the time used
for receiving a response in the client side. Benefit-
ing from capturing traces from both Server and Client
sides, the sum (R
k
i j
− T
k
i j
) + (R
k
ji
− T
k
ji
) can be trans-
formed to (R
k
i j
−T
k
ji
)−(T
k
i j
−R
k
ji
) = T
1
−T
s
. Although
relative timers are still used for each device, they are
merely used for computing the time duration.
After capturing the traces, two sets of messages
generated: Set
server
=[Req
i
,Res
i
,...,Req
i+n
, Res
i+n
] and
Set
client
=[Req
j
,Res
j
,...,Req
j+m
,Res
j+m
| j ≤ i, j+m ≤
i + n]. As we mentioned before, a successful transac-
tion (Req
k
, Res
k
| k ≤ j + m) will be chosen from the
Set
client
for the synchronization. The time duration
T
1
of the transaction can be easily computed and sent
to the global monitor with the testing results. Once
the chosen transaction sequence has been found in the
Set
server
, the time duration T
s
can be obtained, and the
time offset (1/2)(T
1
−T
s
) between the global monitor
and a sub tester can be handled. In the experiments,
the average time used for the synchronization is about
5ms, which provides satisfying results for our method.
4.3 Testing Algorithm
The testing algorithms are described in 1 and 2. Al-
gorithm 1 describes the behaviors of sub testers when
receiving different commands. When the tester re-
ceives a ”Start” command, firstly it initializes the
testing parameters (line 4). Then it starts capturing
the traces and tests them (as mentioned in Section 3)
when traces are translated to readable xml files (lines
23-40). Finally the results are sent back to the global
monitor with the chosen transaction for synchroniza-
tion.
The Algorithm 2 sketches the global monitor be-
haviors and the synchronization function. Initially,
the monitor starts to capture and test as the other
testers do. Meanwhile, it sends initial bindings to all
the sub testers and waits for their responses (lines 1-
5). Once the server receives the response, it reacts
according to the content of the response, and the syn-
chronization is made during this time (lines 20-37).
In the synchronize() procedure, the monitor finds the
chosen transaction in its captured traces, and rectifies
the time offset (1/2)(T
1
− T
s
).
5 EXPERIMENTS
5.1 Environment
The IMS (IP Multimedia Subsystem) is a standard-
ized framework for delivering IP multimedia services
to users in mobility. It aims at facilitating the access
to voice or multimedia services in an access indepen-
dent way, in order to develop the fixed-mobile conver-
gence.
The core of the IMS network consists on the Call
Session Control Functions (CSCF) that redirect re-
quests depending on the type of service, the Home
ENASE2013-8thInternationalConferenceonEvaluationofNovelSoftwareApproachestoSoftwareEngineering
78

Algorithm 1: Algorithm for Testers.
Input: Command
Output: Statistic Logs
1 Listening Port n;
2 switch Receive do
3 case Start & Initial bindings:
4 Set Initial bindings to f ormulas, TimeSlot;
5 Capture(), Test();
6 Send log(i) to Global Monitor;
7 //Send log file to the Global Monitor;
8 Pending;
9 endsw
10 case Continue:
11 Capture(), Test();
12 Send log(i) to Global Monitor;
13 Pending;
14 endsw
15 case Stop:
16 return;
17 endsw
18 case others:
19 Send UnknownError to Global Monitor;
20 Pending;
21 endsw
22 endsw
23 Procedure Capture(timeslot)
24 for (timer=0;timer≤time maximum;timer++) do
25 Listening Port (5060) & Port (5061);
26 //Capture packets;
27 if timer%timeslot==0 then
28 Buffer to Tester(i).xml;
29 //Store the packets in testable formats;
30 end
31 end
32 Procedure Test( f ormulas)
33 for (j=0;j≤max;j++) do
34 Test formula(j) through Tester(i).xml;
35 //Test the predefined requirement formulas;
36 Record results to log(i);
37 //Save the results to log file;
38 Record first transaction to log(i);
39 //Use the first transaction for synchronization;
40 end
Subscriber Server (HSS), a database for the provision-
ing of users, and the Application Server (AS) where
the different services run and interoperate. Most com-
munication with the core network and between the
services is done using the Session Initiation Proto-
col (Rosenberg et al., 2002). Figure 4 shows the core
functions of the IMS framework and the protocols
used for communication between the different enti-
ties.
The Session Initiation Protocol (SIP) is an
application-layer protocol that relies on request and
response messages for communication, and it is an es-
sential part for communication within the IMS frame-
work. Messages contain a header which provides ses-
sion, service and routing information, as well as an
Algorithm 2: Algorithm for Global Monitor.
Input: Log files
Output: Performance Graphs
1 Capture(), Test();
2 Display graphs;
3 for (i=0;i<tester-number;i++) do
4 Send Initial bindings to Tester[i];
5 //Send initial bindings to all sub testers
6 end
7 switch receive do
8 case log:
9 if command==Continue then
10 Send Continue to Tester[i];
11 end
12 else
13 Send Stop to Tester[i];
14 end
15 Synchronize(Log[i].transaction);
16 Analyze(Log[i].results);
17 Display graphs;
18 endsw
19 case others:
20 Send Continue to Tester;
21 endsw
22 endsw
23 Procedure Synchronize(Log[i].transaction)
24 for (a=0; a≤Message-Number, quit!=1; a++) do
25 find Client.Request(k) in Server.Request(a);
26 if (exists==True) then
27 for (b=a; b≤Message-Number, quit!=1;
b++) do
28 find Client.Response(k) in
Server.Response(b);
29 if (exists==True) then
30 Calculate T
s
;
31 Handle timer deviation
T
1
−T
s
2
;
32 quit=1;
33 end
34 else
35 Return transaction error;
36 quit=1;
37 end
38 end
39 end
40 end
body part to complement or extend the header infor-
mation. Several RFCs have been defined to extend
the protocol to allow messaging, event publishing and
notification. These extensions are used by services of
the IMS such as the Presence service (Alliance, 2005)
and the Push to-talk Over Cellular (PoC) service (Al-
liance, 2006).
For our experiments, traces were obtained from
SIPp (Hewlett-Packard, 2004). SIPp is an Open
Source test tool and traffic generator for the SIP pro-
tocol, provided by the Hewlett-Packard company. It
includes a few basic user agent scenarios and estab-
lishes and releases multiple calls with the INVITE
AFormalPassivePerformanceTestingApproachforDistributedCommunicationSystems
79

Figure 4: Core functions of IMS framework.
and BYE methods. It features the dynamic display
of statistics on running tests, TCP and UDP over mul-
tiple sockets or multiplexed with retransmission man-
agement and dynamically adjustable call rates. SIPp
can be used to test many real SIP equipments like SIP
proxies, B2BUAs and SIP media servers (Hewlett-
Packard, 2004). The traces obtained from SIPp con-
tain all communications between the client and the
SIP core. Tests were performed using a prototype
implementation of the formal approach above men-
tioned, using algorithms introduced in the previous
Section.
5.2 Architecture
As Figure 5 shows, a distributed architecture is per-
formed for the experiments. It consists on one cen-
tral server and several nodes. Global Monitor and sub
testers are implemented to the server and nodes re-
spectively, each node carries the traffic of numerous
clients. Due to the limitation of pages, we here only
illustrate the detailed results of the server and two sub
testers (1&2).
Figure 5: Environment.
5.3 Tests Results
In our approach, the conformance and performance
equirement properties are formalized to formulas.
These formulas will be tested through the testers. Af-
ter evaluating each formula φ on a trace ρ, N
p
,N
f
and N
in
will be given to global monitor as the results,
which represent the number of ‘Pass’, ‘Fail’ and ‘In-
conclusive’ verdicts respectively. Besides, t
slot
repre-
sents the time used for capturing a trace ρ, which is
the time duration between the last and the first cap-
tured messages, where ρ = {m
0
,...,m
n
}. We may
write:
N
p
(φ) =
∑
[eval(φ,θ, ρ) = ‘>’]
N
f
(φ) =
∑
[eval(φ,θ, ρ) = ‘⊥’]
N
in
(φ) =
∑
[eval(φ,θ, ρ) = ‘?’]
t
slot
= m
n
.time − m
0
.time
We classify the conformance and performance re-
quirements into three sets: Session Establishment in-
dicators, Global indicators and Session Registration
indicators.
Session Establishment Indicators. In this set,
properties relevant to session establishment are tested.
Conformance requirements ϕ
a
1
,ϕ
a
2
(“Every INVITE
request must be responded”, “Every successful IN-
VITE request must be responded with a success
response”) and performance requirement ψ
a
1
(“The
Session Establishment Duration should not exceed
T
s
= 1s”) are tested. They can be formalized as the
following formulas:
ϕ
a
1
=
∀(request(x) ∧ x.method = ‘INVITE’
→ ∃
y>x
(nonProvisional(y) ∧ responds(y,x)))
ϕ
a
2
=
(
∀(request(x) ∧ x.method = ‘INVITE’
→ ∃
y>x
(success(y) ∧ responds(y,x)))
ψ
a
1
=
∀(request(x) ∧ x.method = ‘INVITE’
→ ∃
y>x
(success(y) ∧ responds(y,x)
∧withintime(y, x,T
s
)))
By using these formulas, the performance indicators
of session establishment are defined as:
• Session Attempt Number: N
p
(ϕ
a
1
)
• Session Attempt Rate: N
p
(ϕ
a
1
) / t
slot
• Session Attempt Successful Rate: N
p
(ϕ
a
1
) / N
p
(ϕ
a
2
)
• Session establishment Number: N
p
(ϕ
a
2
)
• Session establishment Rate: N
p
(ϕ
a
2
) / t
slot
ENASE2013-8thInternationalConferenceonEvaluationofNovelSoftwareApproachestoSoftwareEngineering
80

• Session establishment Duration: N
p
(ψ
a
1
).
The results of sub tester1 are illustrated in Table 1. A
number of ‘Fail’ verdicts can be observed when test-
ing ϕ
a
2
and ψ
a
1
. This could indicate that during the
testing time, the server refused some ‘INVITE’ re-
quests and some session establishments exceeded the
required time. Nonetheless, all of them can be per-
fectly detected by using our approach.
Table 1: Every INVITE request must be responded, Ev-
ery successful INVITE request should be responded with a
success response and The Session Establishment Duration
should not exceed T
s
.
ϕ
a
1
ϕ
a
2
ψ
a
1
Tr No.Msg Pass Fail Incon Pass Fail Incon Pass Fail Incon
1 1164 101 0 0 85 16 0 85 16 0
2 3984 339 0 0 270 69 0 270 69 0
3 6426 520 0 0 425 95 0 425 95 0
4 7894 615 0 0 473 142 0 473 142 0
5 7651 600 0 0 477 123 0 477 123 0
6 7697 604 0 0 492 112 0 490 114 0
7 7760 607 0 0 491 166 0 490 167 0
8 7683 601 0 0 492 159 0 491 160 0
9 7544 587 2 0 464 123 0 461 126 0
10 7915 620 0 0 487 133 0 487 133 0
Figure 6 illustrates the successful session estab-
lishment rates of the server and two sub testers dur-
ing the testing times. Benefited from the synchroniza-
tion process, from the figure, we can observe that the
curve of sub tester1 begins 1.5s later than the others.
In other words, the sub tester1 started the testing pro-
cess 1.5s later than the others, it might be caused by
the delay of transportation or the slow response of the
processor. However, it successfully shows the usage
of our synchronization to precisely reflect the results
of testing in distributed environment.
0 20 40 60 80 100 120 140 160 180 200
0
20
40
60
80
100
120
140
160
180
Testing Time (s)
Session Establishement Rates /second
SubTester1
SubTester2
GlobalMonitor
Figure 6: Session establishment rates.
Global Parameters. In this set, relevant properties
to general network performance are tested. Confor-
mance requirement ϕ
b
1
(“Every request must be re-
sponded”) and performance requirement ψ
b
1
(“Every
request must be responded within T
1
= 0.5s”) are used
for the test, and they can be formalized as it follows.
ϕ
b
1
=
∀
x
(request(x) ∧ x.method! = ‘ACK’
→ ∃
y>x
(nonProvisional(y) ∧ responds(y,x)))
ψ
b
1
=
∀
x
(request(x) ∧ x.method! = ‘ACK’
→ ∃
y>x
(nonProvisional(y) ∧ responds(y,x)
∧withintime(x,y,T
1
)))
By using these formulas, several performance indica-
tors related to general packet analysis can be formally
described.
• Packet Throughput: N
p
(ϕ
b
1
) / t
slot
• Packet loss Number: N
f
(ϕ
b
1
)
• Packet loss Rate: N
f
(ϕ
b
1
) / N
p
(ϕ
b
1
) + N
f
(ϕ
b
1
) +
N
in
(ϕ
b
1
)
• Packet Latency: N
p
(ψ
b
1
)
The testing results of sub tester1 are shown in Ta-
ble 2.
Table 2: Every request must be responded & Every request
must be responded within T
1
= 0.5s.
ϕ
b
1
ψ
b
1
Trace No.of msg Pass Fail Incon Pass Fail Incon
1 1164 258 0 0 258 0 0
2 3984 899 0 0 899 0 0
3 6426 1481 0 0 1481 0 0
4 7894 1858 0 0 1858 0 0
5 7651 1793 0 0 1791 2 0
6 7697 1802 0 0 1795 7 0
7 7760 1829 0 0 1820 9 0
8 7683 1799 0 0 1792 7 0
9 7544 1782 4 0 1766 20 0
10 7915 1855 2 0 1855 2 0
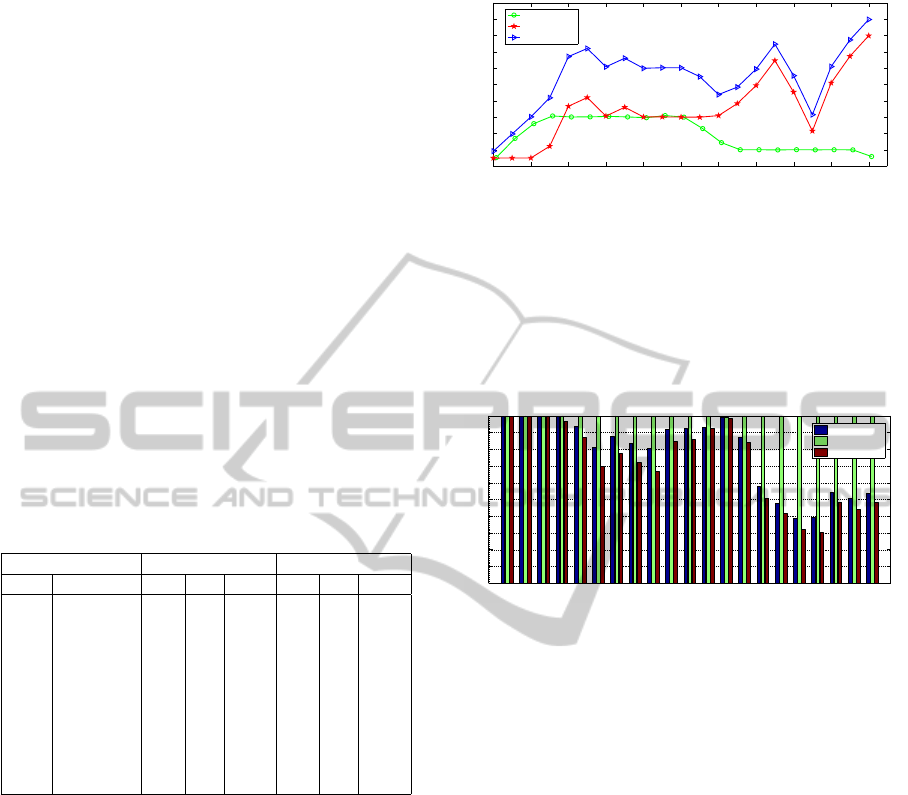
From Figure 7, during the time 130s to 200s, an
upsurge of request rates can be observed. This one
is mainly due to the burst increase of requests in sub
tester2 especially since the request throughput of sub
tester1 remains steady.
However, compared to Figure 6, no evident incre-
ment of session establishment can be observed during
the same time (130s to 200s). Indeed, during a ses-
sion establishment, ‘INVITE’ requests represent the
major part of the total number of requests. It raises
a doubt about the source of the increase on these re-
quests. With this doubt we step over to test the session
registration properties.
0 20 40 60 80 100 120 140 160 180 200
0
100
200
300
400
500
600
Testing Time (s)
Requests Throughput /second
SubTester1
SubTester2
GlobalMonitor
Figure 7: Request throughput.
AFormalPassivePerformanceTestingApproachforDistributedCommunicationSystems
81
Session Registration. In this set, properties on ses-
sion registration are tested. Conformance requirement
ϕ
c
1
(“Every successful REGISTER request should
be with a success response”) and performance re-
quirement ψ
c
1
(“The Registration Duration should not
exceed T
r
= 1s”) are used for the tests.
ϕ
c
1
=
(
∀(request(x) ∧ x.method = ‘REGISTER’
→ ∃
y>x
(success(y) ∧ responds(y,x))))
ψ
c
1
=
∀(request(x) ∧ x.method = ‘REGISTER’
→ ∃
y>x
(success(y) ∧ responds(y,x)
∧withintime(x,y,T
r
)))
By using these formulas, some performance indica-
tors related to session registration can be formally de-
scribed.
• Registration Number: N
p
(ϕ
c
1
)
• Registration Rate: N
p
(ϕ
c
1
)/t
slot
• Registration Duration: N
p
(ψ
c
1
)
The results of sub tester1 are shown in Table 3.
Table 3: Every successful REGISTER request should be
with a success response & Registration Duration.
ϕ
c
1
ψ
c
1
Trace No.of Msg Pass Fail Incon Pass Fail Incon
1 1164 105 0 0 105 0 0
2 3984 340 0 0 340 0 0
3 6426 520 0 0 520 0 0
4 7894 614 0 0 614 0 0
5 7651 602 0 0 602 0 0
6 7697 603 0 0 599 4 0
7 7760 609 0 0 597 12 0
8 7683 602 0 0 596 6 0
9 7544 593 2 0 579 16 0
10 7915 619 2 0 619 2 0
As Figure 8 depicts, there do exists an increment
of registration requests during 130s to 200s. But these
increased requests are not sufficient enough for elim-
inating the previous doubt, since deviation still exists
on the number of requests. Take the peak rate at 160s
for example, the server throughput nearly reaches to
600 requests/s in Figure 7, while in Figure 8 and 6, the
sum of two throughput is only over 200 requests/s,
even counting the ‘BYE’ requests, the source of the
300 other requests/s can not be defined by this analy-
sis.
Nevertheless, when thinking about packet losses,
our test-bed may be led to a high rate of requests with
low effectiveness. In order to confirm this intuition,
we check the test results of ‘Request packet loss rate’
property. The results are illustrated in the Figure 9.
As expected, there is a high rate packet loss both in
the Global monitor and sub tester2 during the time in-
ternal [130s,200s]. By taking, for instance, the same
0 20 40 60 80 100 120 140 160 180 200
0
20
40
60
80
100
120
140
160
180
200
Testing Time (s)
Registration Rates /second
SubTester1
SubTester2
GlobalMonitor
Figure 8: Registration rates.
160s sample, almost 50% of the requests are lost. It
means that the actual effective throughput should be
the half number of the previous test results. This fi-
nally allows to define the source of the 300 other re-
quests/s. This also successfully shows the usage of
our indicators for analyzing abnormal conditions such
as burst throughput, high rate packet loss, etc.
0 2 4 6 8 10 12 14 16 18 20 22
0
0.1
0.2
0.3
0.4
0.5
0.6
0.7
0.8
0.9
1
Testing Time (10s)
Percentage of Packet Loss
GlobalMonitor
SubTester1
SubTester2
Figure 9: Packet loss rate.
6 PERSPECTIVES AND
CONCLUSIONS
This paper introduces a novel approach to passive dis-
tributed conformance and performance testing of net-
work protocol implementation. This approach allows
to define relations between messages and message
data, and then use such relations in order to define
the conformance and performance properties that are
evaluated on real protocol traces. The evaluation of
the property returns a Pass, Fail or Inconclusive re-
sult, derived from the given trace.
To verify and test the approach, we design sev-
eral SIP properties to be evaluated by our approach.
Our methodology has been implemented into a dis-
tributed framework which provides the possibility to
test individual nodes of a complex network environ-
ment, and the results from testing several properties
on large traces collected from an IMS system have
been obtained with success.
Furthermore, instead of simply measuring the
global throughput and latency, we extended several
performance measuring indicators for SIP. As Fig-
ure 10 shows, these indicators are used for testing the
ENASE2013-8thInternationalConferenceonEvaluationofNovelSoftwareApproachestoSoftwareEngineering
82

Figure 10: Real-time testing results.
conformance and performance of SIP in a distributed
network. The real time updated results displayed in
the screen can precisely reflect the performance of
the protocol in different network conditions. Con-
sequently, extending more indicators and building a
standardized performance testing benchmark system
for protocols would be the work we will focus on in
the future. In that case, the efficiency and processing
capacity of the system when massive sub testers are
performed would be the crucial point to handle, lead-
ing to an adaptation of our algorithms to more com-
plex situations.
REFERENCES
9646-1, I. (1994). ISO/IEC information technology -
open systems interconnection - conformance testing
methodology and framework - part 1: General con-
cepts. Technical report, ISO.
Aguilera, M. K., Mogul, J. C., Wiener, J. L., Reynolds, P.,
and Muthitacharoen, A. (2003). Performance debug-
ging for distributed systems of black boxes. SIGOPS
Oper. Syst. Rev., 37(5):74–89.
Alliance, O. M. (2005). Internet messaging and presence
service features and functions.
Alliance, O. M. (2006). Push to talk over cellular require-
ments.
Bauer, A., Leucker, M., and Schallhart, C. (2011). Run-
time verification for ltl and tltl. ACM Transactions on
Software Engineering and Methodology, 20(4):14.
Che, X., Lalanne, F., and Maag, S. (2012). A logic-based
passive testing approach for the validation of com-
municating protocols. In ENASE 2012 - Proceedings
of the 7th International Conference on Evaluation of
Novel Approaches to Software Engineering, Wroclaw,
Poland, pages 53–64.
Denaro, G., Bicocca, U. D. M., Polini, A., and Emmerich,
W. (2004). Early performance testing of distributed
software applications. In SIGSOFT Software Engi-
neering Notes, pages 94–103.
Dumitrescu, C., Raicu, I., Ripeanu, M., and Foster, I.
(2004). Diperf: An automated distributed perfor-
mance testing framework. In 5th International Work-
shop in Grid Computing, pages 289–296. IEEE Com-
puter Society.
Emden, M. V. and Kowalski, R. (1976). The semantics of
predicate logic as a programming language. Journal
of the ACM, pages 23(4):733–742.
Hewlett-Packard (2004). SIPp. http://sipp.sourceforge.net/.
Hierons, R. M., Krause, P., Luttgen, G., and Simons, A.
J. H. (2009). Using formal specifications to support
testing. ACM Computing Surveys, page 41(2):176.
Hofmann, R., Klar, R., Mohr, B., Quick, A., and Siegle, M.
(1994). Distributed performance monitoring: Meth-
ods, tools and applications. IEEE Transactions on
Parallel and Distributed Systems, 5:585–597.
Lalanne, F., Che, X., and Maag, S. (2011). Data-
centric property formulation for passive testing of
communication protocols. In Proceedings of the
13th IASME/WSEAS, ACC’11/MMACTEE’11, pages
176–181.
Lalanne, F. and Maag, S. (2012). A formal data-centric
approach for passive testing of communication pro-
tocols. In IEEE / ACM Transactions on Networking.
Lee, D. and Miller, R. (2006). Network protocol sys-
tem monitoring-a formal approach with passive test-
ing. IEEE/ACM Transactions on Networking, pages
14(2):424–437.
Mills, D. L. (1991). Internet time synchronization: the net-
work time protocol. IEEE Transactions on Communi-
cations, 39:1482–1493.
Rosenberg, J., Schulzrinne, H., Camarillo, G., Johnston, A.,
and Peterson, J. (2002). Sip: Session initiation proto-
col.
Shin, M., Park, M., Oh, D., Kim, B., and Lee, J. (2011).
Clock synchronization for one-way delay measure-
ment: A survey. In Kim, T.-h., Adeli, H., Robles,
R., and Balitanas, M., editors, Advanced Communi-
cation and Networking, volume 199 of Communica-
tions in Computer and Information Science, pages 1–
10. Springer Berlin Heidelberg.
Taufer, M. and Stricker, T. (2003). A performance monitor
based on virtual global time for clusters of pcs. In
In Proceedings of IEEE International Conference on
Cluster Computing, pages 64–72.
Weyuker, E. J. and Vokolos, F. I. (2000). Experience with
performance testing of software systems: Issues, an
approach, and case study. IEEE Trans. Software Eng.,
26(12):1147–1156.
AFormalPassivePerformanceTestingApproachforDistributedCommunicationSystems
83

Yilmaz, C., Krishna, A. S., Memon, A., Porter, A., Schmidt,
D. C., Gokhale, A., and Natarajan, R. (2005). Main ef-
fects screening: a distributed continuous quality assur-
ance process for monitoring performance degradation
in evolving software systems. In ICSE 05: Proceed-
ings of the 27th international conference on Software
engineering, pages 293–302. ACM Press.
Yuen, C.-H. and Chan, S.-H. (2012). Scalable real-
time monitoring for distributed applications. IEEE
Transactions on Parallel and Distributed Systems,
23(12):2330 –2337.
ENASE2013-8thInternationalConferenceonEvaluationofNovelSoftwareApproachestoSoftwareEngineering
84
