
Component Oriented Modeling of Biomass Incineration Plants
Fethi Belkhir
1
, Christian Gierend
2
and Georg Frey
3
1
Zentrum für Mechatronik und Automatisierungstechnik, Saarbrücken,Germany
2
Fakultät für ingenieurwissenschaften/Energieverfahrentechnik, HTWSaar, Saarbrücken, Germany
3
Chair of Automation, Saarland University, Saarbrücken, Germany
Keywords: Incineration Plant, Combustion, Energy from Biomass, Modeling, Simulation, Process Control, Modelica.
Abstract: The thermal treatment of biomass in the so called incineration plants represents one of the most appealing
ways for biomass treatment. It reduces not only the volume of the disposed biomass, but also it can convert
the heat produced by the combustion into electrical energy or steam for the district heating. Any organic
non-fossil fuel can be considered as a biomass such as industrial and municipal waste and any material that
was created by a photosynthesis reaction. Hence, it can contribute considerably in the global energy supply,
as it can be collected from different sources. However, the variability in biomass composition, the complex
thermochemical reactions and heat transfer phenomena occurring during the combustion have justified the
development of multiple mathematical models to investigate the process as precisely as possible. Usually,
they aim to achieve a better combustion chamber design. Unfortunately, these models are very complex and
very detailed, composed mainly of a set of partial differential equations that cannot be considered if the
intent is the control of the plant. Hence, the goal of the proposed work in a first step is to reduce the present
complexity by proposing a simplified mathematical model that captures the main dynamics present inside
the incineration chamber. The model takes the heterogeneous solid phase and the homogeneous gas phase
into account, and it considers the large unsteady variation in the biomass composition. The control part of
the plant is also addressed by giving an overview on the current control schemes that are used in the context
of biomass combustion control. Finally, the model is implemented using the object-oriented language
Modelica in order to investigate the dynamic behavior of the system.
1 INTRODUCTION
In the last decades, the energy recovery from
biomass took a special attention. The driving force
for this is its availability in abundant amount, as it
can be collected from different sources (ranked
fourth as energy source after coil, oil, and natural
gas. Any organic non-fossil fuel can be considered
as a biomass fuel such as crop residues, industrial
and municipal refuse or any material that was
created by a photosynthesis reaction. Therefore, it
contributes considerably to the global energy supply
(over 14% of the total global energy) and can be
more exploited than it has been so far (Van Loo and
Koppejan, 2008).
One of the most appealing ways for energy
recovery from biomass is via grate combustion
which represents the state-of-art technology for the
thermal treatment of biomass (Yin et al., 2008). It
combines efficiency with low investment costs.
Furthermore, grate combustion of biomass reduces
the landfill volume and mitigates the environmental
impact of active organic compounds which can leach
and affect the underground water, or creates an odor
nuisance otherwise. Due to the variability of the
biomass composition such as the moisture content,
its calorific value, and the intrinsic complexity of the
combustion process which consists of heterogeneous
and homogeneous reactions (Nussbaumer, 2003),
this will lead to a variability in the operating
conditions of the incineration plant, which would
compromise the combustion efficiency (Rovaglio et
al., 1998). Therefore, a need for suitable control is
important to account for these variations.
The main emphasis of this work is to give a
concise introduction to the biomass combustion
process and to motivate the development of a
simplified mathematical model which is simple
enough to be used as a basis for an advanced model-
based control strategy, as there is only few work that
has been reported in the control part of the plant.
The paper is organized as follows: in Section 2, a
396
Belkhir F., Gierend C. and Frey G..
Component Oriented Modeling of Biomass Incineration Plants.
DOI: 10.5220/0004475503960404
In Proceedings of the 10th International Conference on Informatics in Control, Automation and Robotics (ICINCO-2013), pages 396-404
ISBN: 978-989-8565-70-9
Copyright
c
2013 SCITEPRESS (Science and Technology Publications, Lda.)
brief description of the plant where the incineration
of the biomass takes place is given followed by an
introduction to the main thermal decomposition
elements which the biomass undergoes in the
moving grate. In Section 3, a mathematical modeling
concept for the process is proposed along with a
brief overview on the control part of the plant.
Section 4 deals with the implementation and the
simulation of a part of the system.
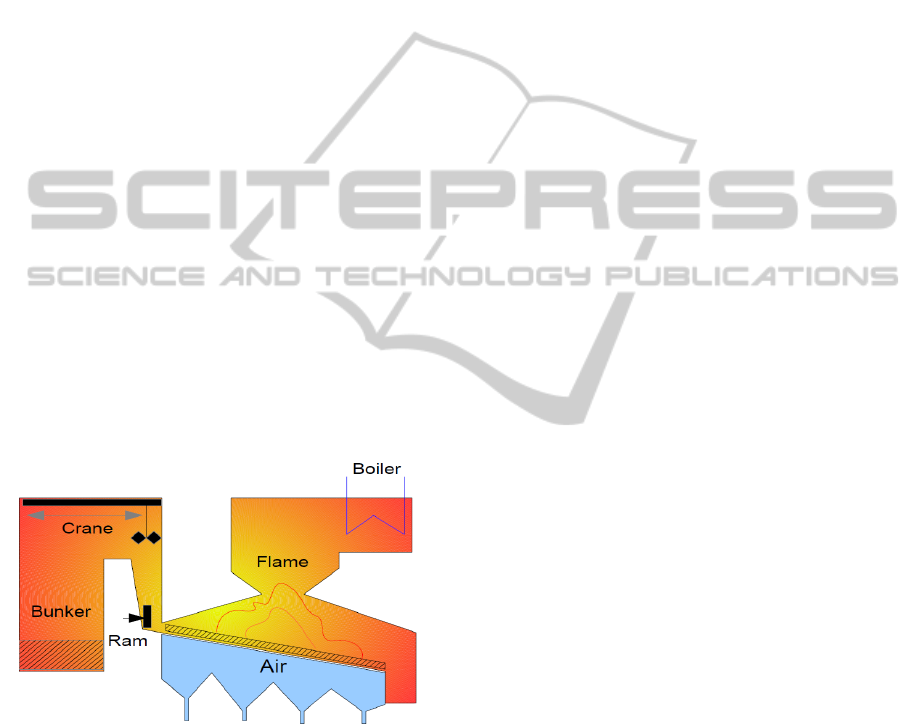
2 PROCESS DESCRIPTION
As already mentioned, an efficient way to convert
biomass into a usable energy is through combustion
that takes place in so called incineration plants. The
biomass or the municipal waste is transported by
means of a truck or a train to the plant where it is
discharged into a storage unit called Bunker.
Consequently, the disposal is gripped and moved to
a large chute where it is thrown (see Figure 1).
At the bottom, the biomass, referred to as fuel, is
fed into the incineration chamber by a horizontally
moving ram and transported through the combustion
chamber by a moving grate. The grate has in
addition a rich oxygen air installation beneath, from
which air is gradually added through existing holes
in order to provide good stoichiometric combustion
conditions inside the chamber.
Figure 1: Incineration plant.
2.2 Biomass Thermal Decomposition
Process
While the biomass is traveling along the combustion
chamber by the moving grate, two main phases can
be distinguished: a solid phase and a gas phase. The
solid phase can be further divided into 4 steps: the
drying, pyrolysis/gasification, char burning, and
finally ash as an end product. In the gas phase, a
secondary air is introduced above the grate in order
to achieve good mixing conditions of the volatiles
and unburned gases released in the previous step, i.e.
the solid phase. The obtained hot gas, referred to as
flue gas, is further transferred to a boiler where the
steam is produced, that can be used as either in
district heating or in electricity production by a
turbine.
2.2.1 Drying
This step is very crucial and can have a strong
influence on the overall behavior of the combustion
in general and the temperature distribution inside the
chamber in particular. Moreover, as the
pyrolysis/gasification, char oxidation and ash take
place at a predefined position on the grate, a biomass
with high moisture content requires a longer time to
be dried. As a consequence, they shift their position
on the grate as reported in (Bauer et al., 2010).
Therefore, it can be concluded that the moisture
content in the biomass is an important variable.
The biomass moisture content evaporates at
temperatures >100 °C. This can be achieved by
radiation at the top of the fuel bed or by heat
conduction through the grate bars. Other plant
suppliers use a pre-heated primary air to speed up
the drying process. Consequently, the evaporated
water is transported by the primary air mass flux to
the upper part of the waste bed. Lastly, it should be
noted that the moist evaporation is an endothermic
process in the sense that it absorbs heat from the
chamber. (Van Loo and Koppejan, 2008) reported
that for a moist content above 60% the flame cannot
be maintained in the combustion chamber.
2.2.2 Pyrolysis/Gasification
After the wet biomass is dried in the previous step,
the temperature in the chamber starts to rise
considerably. As soon as the temperature reaches a
certain level, another thermal degradation of the fuel
takes place, namely the pyrolysis and its associate
the gasification. The pyrolysis occurs under oxygen
deficient conditions and high temperature levels,
which break up the hydrocarbons of the form
CH
x
O
y
N
z
into smaller species such as methane
(CH
4
), carbon monoxide (CO), hydrogen (H
2
),
nitrogen (N
2
), and residual carbon called char.
In contrast to pyrolysis where no oxygen exists
in order to oxidize the gasified hydrocarbons, the
gasification takes place in the presence of a limited
amount of oxygen, i.e. the thermal decomposition is
kept under stoichiometric levels. The product of this
phase is a combustible gas that will be burned in a
ComponentOrientedModelingofBiomassIncinerationPlants
397

homogeneous reaction step above the fuel bed.
Besides the difference in the oxygen amount used in
these two thermo-chemical processes, the pyrolysis
is maximized in terms of the char and tar produced,
while the gasification phase is maximized in terms
of combustible gas produced. Figure 2 shows the
levels of the oxygen present during the thermo-
chemical degradation of the biomass fuel as well as
the obtained products from both the pyrolysis and
gasification processes, and in the homogeneous gas
phase, i.e. combustion.
Figure 2: Oxygen levels during the thermo-chemical
degradation of the biomass fuel and the associated
products (Nussbaumer, 2003).
2.2.3 Char Oxidation
After the pyrolysis step is finished and the amount of
carbon yield, called char, is maximized, the
oxidation process of char begins. The char oxidation
is undergone under high temperature levels and
oxygen-rich conditions. It is useful to illustrate this
process by a particle which is heated from the outer
surface surrounded by a high oxygen pressure in
order to allow for the oxygen diffusion to the inner
core of the char particle. This thermal process
releases a considerable amount of the remaining
energy. Hence, it is an exothermic reaction. The
gases released in char oxidation consist mainly of
carbon monoxide (CO), and carbon dioxide (CO
2
).
2.2.4 Ash
This is the last step of the biomass thermo-chemical
decomposition. It consists of the remaining residues
from the combustion process, such as unburned
matters, or the by-product from the char combustion
called ash. This residue is generally collected at the
output of the plant in a collection pit.
3 PROCESS MODELLING
AND CONTROL
In order to build the set of the mathematical
equations used in the model, two common modelling
approaches in the context of combustion process
modelling are mainly presented: lumped modeling,
and distributed modeling. In the lumped modelling
approach the governing equations are merely based
on first-order principles, i.e. mass and energy
balances. As a result, the equations will be a set of
ordinary differential equations (ODE’s). In contrast
to the lumped model, the distributed modeling
approach, referred to as two-dimensional modeling,
depends not only on time, but also on space leading
to partial differential equations (PDE’s) (Yang et al.,
2004).
The former approach is used if the intent of the
model is to be deployed in model-based control
strategies (Rovaglio et al., 1996), (Bauer et al.,
2011), (Van Kessel and Van Loo, 2011), (Paces and
Kozek, 2011). The latter approach is largely used to
simulate the phenomena present in a combusting
fuel bed (evaporation, pyrolysis/gasification, char
burring and ash) leading to a model with set of
equations of a high complexity that prohibit its use
as a basis for a model-based design of control
systems. Nevertheless, the distributed modelling
is a commonly adopted approach to simulate the gas
phase and to optimize the design of the incineration
chamber in order to achieve better combustion
efficiency by using Computational Fluid Dynamics
software (CFD).
Figure 3: Biomass thermal decomposition processes
occurring on the moving grate.
3.1 Mathematical Modeling Concept
The main core of this work is the development of a
mathematical model for the combustion process in a
biomass incineration plant, which is simple and
ICINCO2013-10thInternationalConferenceonInformaticsinControl,AutomationandRobotics
398

accurate enough to capture the main dynamics
occurring during the thermal decomposition of the
biomass on the moving grate, as well as in the gas
phase. As a consequence, the elaborated model can
be used as a basis for a model-based control strategy
and to investigate the influence of the control
parameters on the combustion process. Hence, the
temperature inside the chamber and the amount of
steam delivered to the turbines for electricity
generation.
The combustion process of biomass on the
moving grate is divided into different zones
depending on the individual thermal decompositions
occurring on the grate, i.e. drying,
pyrolysis/gasification, char oxidation, and ash.
These steps occur at distinct positions on the grate
and might overlap with each other to some extent
(see Figure 3). Therefore, in the building of the
mathematical model concept, it is advantageous to
represent each of these zones by a number of the
well-known Continuous Stirred Tank Reactors
(Schmidt, 1998) arranged with each other in cascade
as shown in Figure 4.
Figure 4: The proposed modeling concept of biomass
combustion process.
Such a representation of the combustion model
enables a simplified mathematical description of the
process leading to a first-order principle based
model, since the governing equations describing the
dynamics on the firing grate will be based solely on
mass and energy balances.
Figure 5: Mass entering a zone (i) of the fuel on a moving
grate.
Figure 5 represents the mass entering a zone (i),
which is represented by a CSTR, at time t+t. It
should be noted that the mass
,
, given in [kg], is
mainly composed of moisture, volatile matters,
carbon and ash.
and
represent the primary air and
recirculated gas mass flow respectively given in
[kg/s]. The amount of primary air as well as the
recirculated gas can vary depending on each zone air
requirement. Hence, they can be formulated as
follows:
,
Ω
,
⋅
(1)
,
Ω
,
⋅
(2)
,
,
,
(3)
Where Ω
,
andΩ
,
are the air distributions at a
zone (i).
From Figure 5 it is clear that the mass balance
equation can be formulated as:
,
,
,
,
(4)
and
,
,
(5)
,
represents the mass substance which is
converted from solid to gas phase, that can be
presented by an Arrhenius type reaction rate.
τ
i
represents the time which the mass spends inside a
given reactor (residence time).
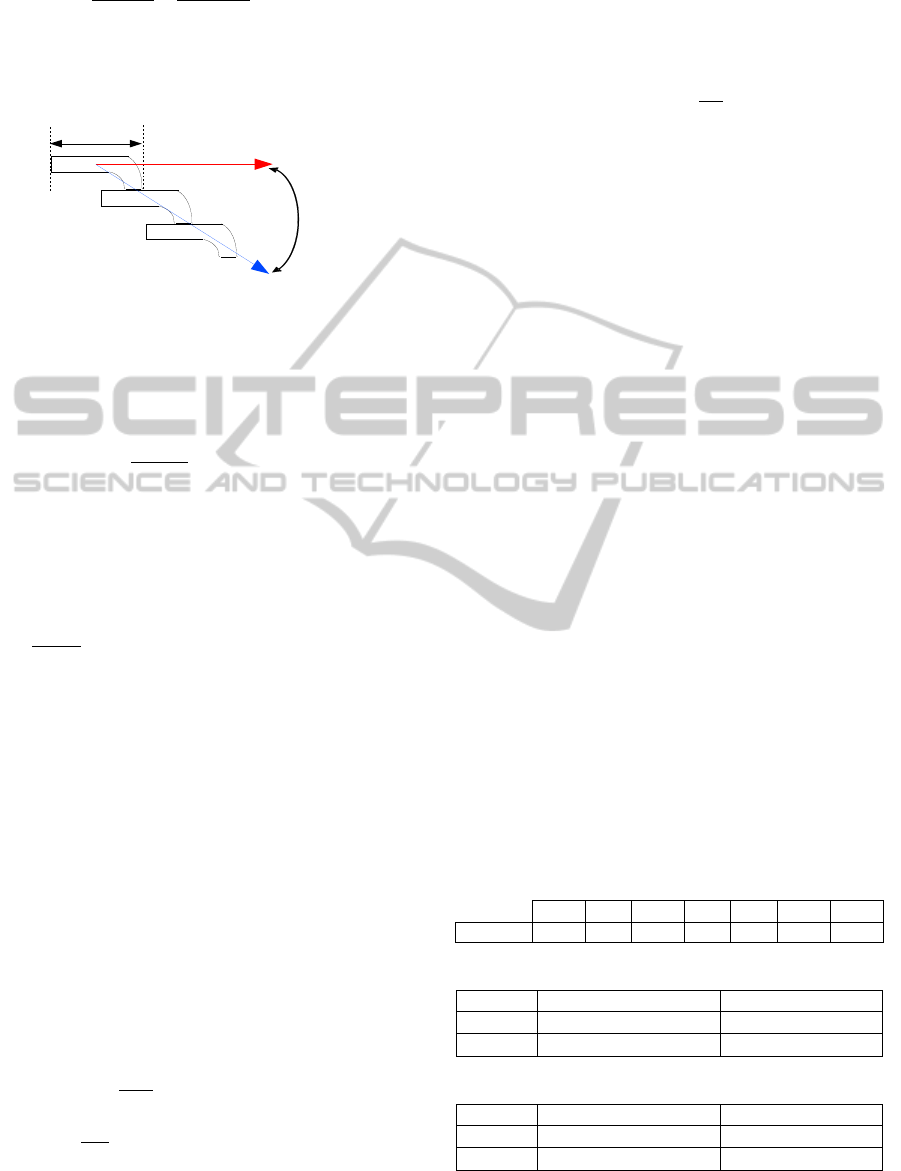
The overall residence time of the biomass inside
the system τ
total
[s] can be modeled by the following
approach:
The horizontal grate is assumed to be moving
with a velocity V
grate
[m/s] and has a length D[m],
whereas the biomass moves along the incineration
chamber with a velocityV
biomass
[m/s].
α [deg] is the inclination angle of the moving
grate relative to the horizon which can be obtained
from the plant construction data (see Figure 6).
Hence, V
biomass
is related to V
grate
by:
V
1
cos
⋅V
(6)
with
V
D⋅
(7)
Finally,
iin
m
,
iout
m
,
igas
m
,
irecipa
mm
,,
in
m
pa
m
ashout
m
x
x
ComponentOrientedModelingofBiomassIncinerationPlants
399
L
V
L⋅cosα
V
(8)
where L [m] is the total length of the grate system,
Freq [1/s] is the frequency with which a given grate
moves.
Figure 6: The grate system.
Consequently, the residence time τ
i
can be directly
computed by dividing the total residence time by the
number of the CSTRs used as follow:
τ
#CSTR
(9)
Similar to the solid phase, a mass balance for the gas
phase can be drawn. It should be noted that in the
gas phase, a secondary air mass flow rate
[kg/s] is injected together with the amount of
primary air blown under the grate.
,
,
,
(10)
Where
(11)
[kg/s] is the sum of the mass flow rate of the
secondary as well as the recirculation gas.
To enclose the proposed modelling approach, the
energy balance for both solid and gas phases are
derived. For simplicity, it is assumed that the main
heat exchange process is the radiation between the
gas cloud on top of the combusting bed and its
surface, since it is the most dominating heat transfer
mechanism inside the combustion chamber.
The energy balance equation for both mass and
energy balance are given by:
,
⋅
,
,
,
(12)
⋅
⋅
,
,
(13)
where
⋅
(14)
and
⋅
⋅
⋅
(15)
is the mass flow rate of the solid biomass
fed into the incineration chamber [kg/s],
and
are the lower and higher heating value of the
feed fuel [kJ/kg] that can be determined from the
approximate or the ultimate analysis of the biomass
(see Figure 7),
is the evaporation enthalpy of
water (2443kJ/kg).
modelEnthalpy
extendsComponents.Constants;
Connectors.RealInputC,H,O,N,S,W,A"Ultimate
analysis";
Connectors.RealInputK;
Connectors.RealInputOmega;
Connectors.RealOutputH_HHV;
Connectors.RealOutputH_LHV;
equation
//LoweHeatingValueLHV
H_HHV=32.79*C+120.9*(H‐(O/8))+9.28*S‐
2.443*W;
//UpperHeatingValueHHV
H_HHV=H_LHV+Enthalpy_H2O*((K*Omega)/V_n)*
M_H2O;
endEnthalpy;
Figure7: Modelica code for computing the lower heating
value of biomass.
For the following exemplary ultimate composition
of the biomass (see Table 1), some valuable results
can be extracted from the global combustion model
(see Figure 8):
Table 1: Biomass ultimate analysis composition [%].
C H O N S W A
Biomass
38.25 5.49 29.95 1.22 0.30 10.00 13.78
Lower and Higher biomass heating values:
Value Unit
H
HHV
1465.97 MJ/kg biomass
H
LHV
14.5838 MJ/kg biomass
Air quantity L
min
and L:
Value Unit
L
min
3.9106 m
3
Air/kg biomass
L
6.6481 m
3
Air/kg biomass
L
min
is the minimum required air quantity to burn
one kilogram of the biomass fuel.
V
grate
D
VBiomass
ICINCO2013-10thInternationalConferenceonInformaticsinControl,AutomationandRobotics
400

Figure 8: A global biomass combustion model
implemented in Modelica.
3.2 Plant Control: Overview
The control of an incineration plant is a complex,
multi-objective and elaborative task due to the
intrinsic complexity of the combustion process, as
well as the fuel components and its calorific value
variation. This is further complicated by the
stringent environmental laws on the allowed gaseous
emissions (Rovaglio et al., 1998). Such concerns
have strong consequences on the operating
conditions of the process leading to disturbances and
fluctuations in the temperature inside the chamber if
the process is not stabilized by an appropriate
control action. This calls for the implementation of a
reliable control system that is robust enough to reject
the aforementioned disturbances and to maximize
the energy recovery from the biomass, in the
meantime assuring acceptable levels of emission
(Bardi and Astofli, 2010).
Clearly, the process control system should
integrate both environmental and energy production
aspects, and its efficiency should be evaluated based
on (El Asri and Baxter, 2004):
-The achieved burnout in the solid and gas phases.
-The achieved plant throughput and energy recovery.
-The achieved emission control of the gaseous gases.
The associated indicator for this is the amount of
oxygen concentration in the flue gas which should
be limited to 8% for the case where the emission
level has to be controlled. For the plant throughput
and consequently the energy recovery, the main
indicator to be controlled is the steam temperature
and the steam flow rate. These two indicators, i.e.
the oxygen concentration and the steam flow are
referred to as the controlled variables, which are the
variables that have to be influenced by the control
action in order to achieve constant and uniform
operating conditions. The following manipulated as
well as the controller variables in an incineration
plant are reported in Figure 9.
Figure 9: Control scheme of a biomass incineration plant.
The present situation indicates that the control
systems present in an incineration plant are a
network of the classical PID controllers, which
allows the plant operators to intervene by parameter
tuning of these controllers (Pirouti et al., 2010). As a
matter of fact, the plant can be run in sub-optimal
operating conditions due to the non-optimized
structure of aforementioned control scheme, which
can contradict the economical objective imposed by
the plant managers, i.e. maximizing the revenue of
the plant by increasing the throughput. Hence,
generating more steam for electricity generation or
for district heating.
Therefore, the classical control schemes turn out
to be inferior in comparison to existing advanced
control techniques such as model predictive control
(MPC) (Leskens et al., 2005), (Paces and Kozek,
2011), Neural Networks and Fuzzy logic. A detailed
discussion of these techniques would be out of the
scope of this paper. These three control strategies are
so far the most appealing advanced control strategies
that would assist the plant operators and compensate
the sub-optimal operating conditions generated by
the classical PIDs.
4 SIMULATION
In a first step of the proposed model (see Figure 10),
only one continuous stirred tank reactor has been
tested to investigate the assumptions done on the
modeling concept of the plant. The Modelica
®
model of the CSTR is simulated using Dymola
®
,
which is an objected-oriented language for modeling
complex physical systems (Tiller, 2004), where the
overall model is broken down into sub models,
referred to as components. A component has a
predefined set of connectors that determine the
interaction between other components sharing the
same type of connectors. Since the developed
mathematical model in the previous section consists
merely of mass and energy balances for the different
material composition of the fuel, i.e. water, volatile
matters, carbon and ash, the connectors can be
defined as follows:
Steam flow
Biomass feed rate
Grate velocity
Secondary air flow
Primary air flow
Incineration
plant
Advanced
Controller
Oxygen[%]
Oxygen[%]
Steam flow
-
-
ComponentOrientedModelingofBiomassIncinerationPlants
401
connectorMultiplePort_In/Out"MultipleIn/OutPortInterface"
importModelica.SIunits.*;
parameterIntegernConnector=1
flowMassFlowRatemdot[nConnector];
TemperatureTemp;
endMultiplePort_In/Out
;
and
connectorHeatPort"HeatPort"
extendsInterfaces.HeatPort;
endHeatPort;
These are the two kinds of connectors that are
present in the illustrated concept for modeling an
incineration plant. The waste flow components
between the different zones, i.e., reactors, is
implemented as an array of size nConnectors where
nConnectors is equal to 4 in this case. Finally, The
HeatPort connector allows the heat exchange
between gas phase and solid phase.
Figure 10: Overall Process.
Since the different sub models can be tested
individually in Modelica, and for simplicity, the
reactor model has been tested for the case of
moisture drying and volatile matters. The mass flow
rate of both the water and volatiles is set to a given
reference value, and the temperature of the reactor
was set initially to the ambient temperature of the
incoming fresh fuel (25
o
C). The radiation was
dynamically varied from 500
o
C to 1000
o
C for a
duration of 50 seconds (see Figure 11). Lastly, the
kinetic data for the Arrhenius parameters are
illustrated in Table 2, where A [s
-1
] is the pre-
exponential factor and E [kJ.mol
-1
] is the activation
energy.
Table 2: Kinetics data for water evaporation and volatiles.
A E
Water Vapour 5.13x10
10
88
VolatileGas 5.16x10
6
84
Figure 11: Testing scheme of the CSTR model.
modelInput"referenceMassFlow"
parameterIntegerN=2;
Interfaces.MultiplePort_OutmultiplePort_Out1(nConnector=N)
equation
multiplePort_Out1.mdot[1]=30"Water";
multiplePort_Out1.mdot[2]=30"Volatiles";
endInput;
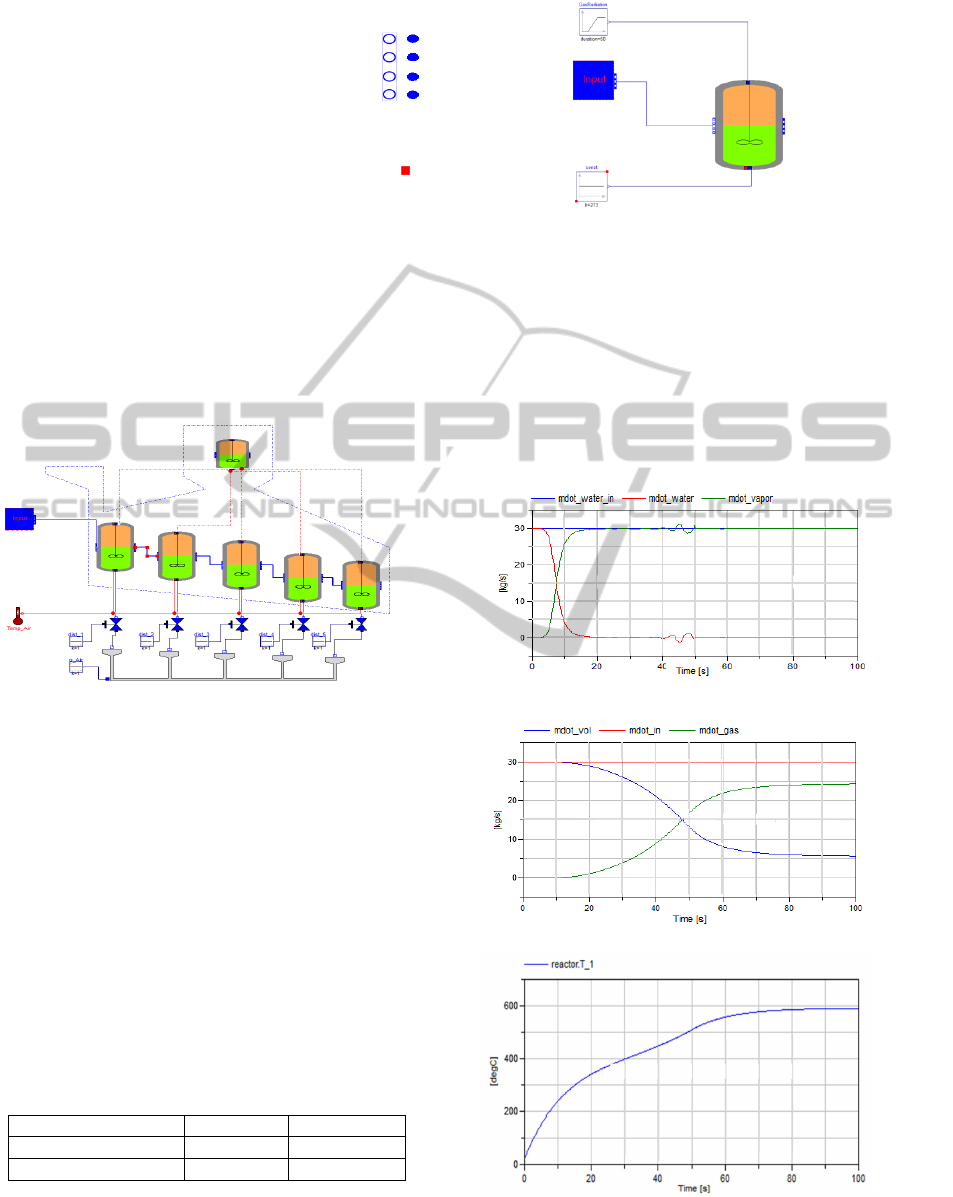
The results obtained from the CSTR for moisture
evaporation and volatiles gasification are illustrated
in Figure 12.
(a)
(b)
(c)
Figure 12: Simulation results.
ICINCO2013-10thInternationalConferenceonInformaticsinControl,AutomationandRobotics
402
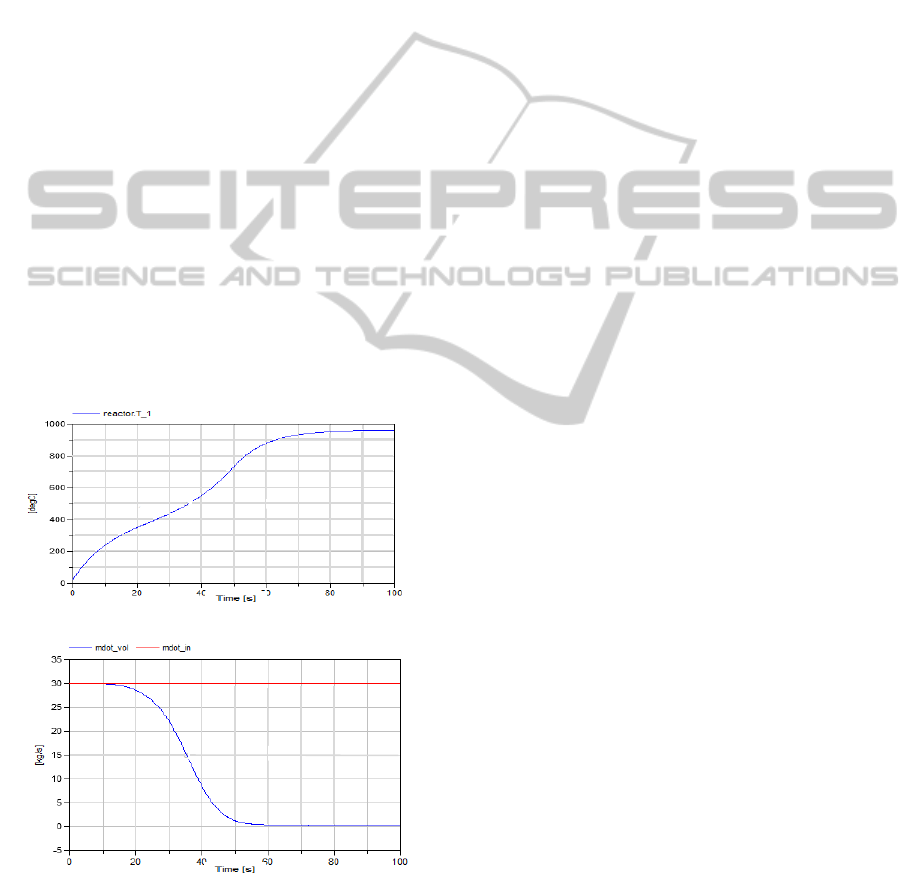
Figure 12.a represents the evolution of the water
content in the liquid phase (red curve) and in the gas
phase, i.e. vapor, (green curve). Clearly as depicted
in the figure, the water starts to vaporize as soon as
the temperature in the reactor reaches 100
o
C at 2.8
seconds, whereas the water in liquid phase decreases
until it is totally consumed
as expected. Similarly,
the Figure 12.b illustrates the gasification of the
volatile matters. It should be noted that the
gasification of volatiles is activated at higher
temperature, here about 266
o
C after 12 seconds for
rate parameters which are in agreement with the
parameters used for a faster devolatilization in
(Yang et al., 2004). But compared to the water
vaporization case, the devolatilization is not
completed; this can be checked from the offset
present between the reference input in red and the
green curve which represents the gasified volatiles.
This is in accordance with the reported results on the
gasification of volatile matters, which state that the
gasification of volatiles is accomplished at higher
temperatures. Here, the maximum achieved reactor
temperature is 600
o
C as shown in Figure 12.c. This
remark can be validated by increasing the radiating
temperature of the gas phase to 1500
o
C as shown in
Figure 13.a, which represents the gasified volatiles
over time.
(a)
(b)
Figure 13: Effect of temperature on the volatile matters.
5 CONCLUSIONS
In this work, a rudimentary introduction to the
process of energy recovery from biomass was
presented. The process consists merely of different
thermo-chemical reactions for the degradation of
biomass on the moving grate. Furthermore, two
main phases can be distinguished: a heterogeneous
solid combustion (solid phase) followed by
secondary homogenous combustion (gas phase).
Secondly, a simplified mathematical modeling
concept was proposed, that is based on the well-
known continuous stirred tank reactor (CSTR).
Hence, the governing mathematical equations are
merely based on energy and mass balances, which
are suitable for the simulation of the process using
the component-oriented Modelica modelling
scheme. The motivating reason for this work is that
the incineration process is run sub-optimally due to
the currently used classical control techniques. The
developed model will be the basis for testing more
advanced control schemes in order to increase the
process efficiently and reduce the emitted levels of
exhaust gases.
Future work will include the implementation of
the overall component-based model of the plant, and
to test its robustness against the variation of biomass
composition.
ACKNOWLEDGEMENTS
The presented results are a part of the project
O
3
Thella at Zentrum für Mechatronik und
Automatisierung funded by the Saarland Ministry
for Economics and Science and the European
Regional Development Fund.
REFERENCES
Bardi, S., and Astofli, A., 2010. Modeling and Control of
a Waste-to-Energy Plant Regulation. IEEE Control
system, vol. 30, issue 6, pp. 27-37.
Bauer, R., Gölles, M., Brunner, T., Dourdoumas, I., and
Obernberger, I., 2010. Modeling of grate combustion
in a medium scale biomass furnace for control
purposes. Biomass and Bioenergy, vol. 34, pp.417-
427.
El Asri, E., and Baxter, D., 2004. Process Control in
Municipal Solid Waste Incinerators: Survey and
Assessment, Waste manag Res, 22(3): 177-85.
Bauer, R., Gölles, M., Brunner, T., Dourdoumas, N., and
Obernberger, I., 2011. Model based control of a
ComponentOrientedModelingofBiomassIncinerationPlants
403

biomass furnace. European Conference on Industrial
Furnaces and Boilers.
Leskens, M., Van Kessel, L., L.B.M., and Bosgra. O.H.
2005. Model predictive control as a tool for improving
the process operation of MSW combustion plants.
Waste management journal, vol. 25, nr. 8, pp. 788-
798.
Nussbaumer, T., 2003. Combustion and Co-combustion of
biomass: Fundamentals, Technologies, and Primary
Measures for Emission Reduction. Energy&Fuels, vol.
17, pp 1510-1521.
Paces, N., and Kozek, M., 2011. Modeling of a Grate-
Firing Biomass Furnace for Real-Time Application.
Proceedings of the MMMse.
Paces, N., Voigt, N., Jakubek, S., Schirrer, A., and
Kozek, M., 2011. Combined Control of Combustion
Load and Combustion Position in a Moving Grate
Biomass Furnace. 18th Mediterranean Conference
Control and Automation, Corfu, Greece.
Pirouti, M., Wu, J., Ekanayke J., and Jenkins, N., 2010.
Dynamic modeling and control of a direct combustion
biomass CHP unit. Universities power engineering
conference (UPEC).
Rovaglio, M., Manca, D., Pazzaglia, G., and Serafini,
G., 1996. Inverse Response compensation for the
optimal control of municipal incineration plant:
Models synthesis and experimental validation.
Computers chem. Engng, vol. 20, pp.1461-1467.
Rovaglio, M., Manca, D., and Biardi, G., 1998. Dynamic
modeling of waste incineration plants with rotary
kilns: Comparisons between experimental and
simulation data. Chemical Engineering Science, vol.
53, No. 15, pp. 2727-2742.
Schmidt, L., 1998. The Engineering of Chemical
reactions, Oxford University press, 2
nd
Edition.
Tiller, M., 2004. Introduction to Physical Modeling with
Modelica. Kluwer Academic Publishers,
Massachusetts, 2
nd
Edition.
Van Kessel, R., and Van Loo, S., 2011. Dynamic
mathematical combustion models applied to practical
systems. Presented at the Joint International
Combustion Symposium, Hawaii.
Van Loo, S., and Koppejan, K., 2008. The handbook of
biomass combustion and co-firing. Earthscan James.
Yang, Y. B., Ryu, C., Goodfellow, J., Nasserzadeh, V.,
and Swithenbank J., 2004. Modelling Waste
Combustion In Grate Furnaces. IChemE, Part B,
Process Safety and Environmental Protection, 82(B3),
pp 208-222.
Yin, C., Rosendahl, L. A., and Kaer, S. K., 2008. Grate-
firing of biomass for heat and power production.
Progress in Energy and Combustion Science, vol. 34,
nr. 6, pp. 725-754.
ICINCO2013-10thInternationalConferenceonInformaticsinControl,AutomationandRobotics
404
