Extracting Characteristics of Speaker’s Voice Harmonic Spectrum
Design of Human Voice Feature Extraction Technique
Oldřich Horák and Jan Čapek
Faculty of Economics and Administration, University of Pardubice, Studentská 84, 532 10 Pardubice, Czech Republic
Keywords: Speaker Identification, Fundamental Frequency, Harmonic Spectrum, Signal Processing.
Abstract: This paper describes the design of a technique used to extract harmonic spectrum characteristics of human
voice. The voice characteristic can be used for a speaker identification process. The cepstral analysis is the
most popular method, which uses a Mel-Frequency Cepstral Coefficient vector as unique characteristics of
given speaker voice. This method provides only limited reliability. The harmonic spectrum based on
fundamental frequency of speaker’s voice can extend the characteristic vector by more values. The extended
characteristics can provide better reliability of the speaker identification.
1 INTRODUCTION
The task of speaker identification can be commonly
used to identification of the user by an information
system. This method is a special type of voice signal
analysis, and it belongs into the group of biometric
identification methods. It is a non-invasive method;
it means it is user friendly. But, the reliability of this
type of identification doesn’t reach the sufficient
level to be able to use as the primary and standalone
method of user identification. The option is to
combine it with another method, or to increase its
reliability using more voice characteristics.
2 PRESENT METHODS
The features extraction is the base task of most
speaker identification methods. Besides that, the
extraction techniques are used also in more tasks of
the speech analysis, i.e. artificial speech processing
or speech recognition. The speaker recognition is not
the main direction of these methods development,
but some of them can be used as the support
techniques in the speaker recognition process.
2.1 MFCC – based Method
The Mel-Frequency Cepstral Coefficient (MFCC)
method uses the real cepstrum of the voice signal to
extract the characteristic vector of coefficients. As
well, this method provides the possibility to find the
fundamental frequency of the speaker’s voice. The
basic frequency of human voice is present in the
voiced parts of the speech (Campbell, 1997), (Petry
et al., 2008).
The Figure 1 shows the real cepstrum of the
voiced part of the speech. The values of cepstral
coefficient c(n) are marked out as well as the
fundamental frequency peak focused by the vertical
line.
0 50 100 150 200 250 300
-0.8
-0.6
-0.4
-0.2
0
0.2
0.4
0.6
0.8
n
c(n)
Figure 1: The fundamental frequency found in the voiced
segment of speaker’s voice.
The coefficients are calculated using Fast Fourier
Transform FFT and its inverse function IFFT (1).
)]([lnRe)(
Re
nsFFTIFFTnc
(1)
273
Horák O. and Capek J..
Extracting Characteristics of Speaker’s Voice Harmonic Spectrum - Design of Human Voice Feature Extraction Technique.
DOI: 10.5220/0004593502730277
In Proceedings of the 8th International Joint Conference on Software Technologies (ICSOFT-EA-2013), pages 273-277
ISBN: 978-989-8565-68-6
Copyright
c
2013 SCITEPRESS (Science and Technology Publications, Lda.)
2.2 LPC – based Method
The method of Linear Prediction Coding (LPC)
provides the spectral envelope of the voice signal. It
uses an inverse filtering technique to remove the
formant frequencies from the voice signal. Rest part
of the signal is the spectral envelope characterizing
vocal tract parameters of the given speaker. The
spectral envelope is described by a set of the LPC
coefficients (Campbell, 1997), (Tadokoro et al.,
2007).
2.3 Autocorrelation Method
The autocorrelation can be used to determine the
fundamental frequency of the speaker’s voice. This
method is faster, but the efficiency and precision is
worse than the cepstral analysis (Atassi, 2008),
(Horák, 2012).
0 200 400 600 800 1000
-0.4
-0.3
-0.2
-0.1
0
0.1
0.2
0.3
n
s[n]
Figure 2: The voiced segment of the signal.
0 200 400 600 800 1000
-1.5
-1
-0.5
0
0.5
1
1.5
2
2.5
3
3.5
n
R[n]
Figure 3: The autocorrelation of the voiced segment.
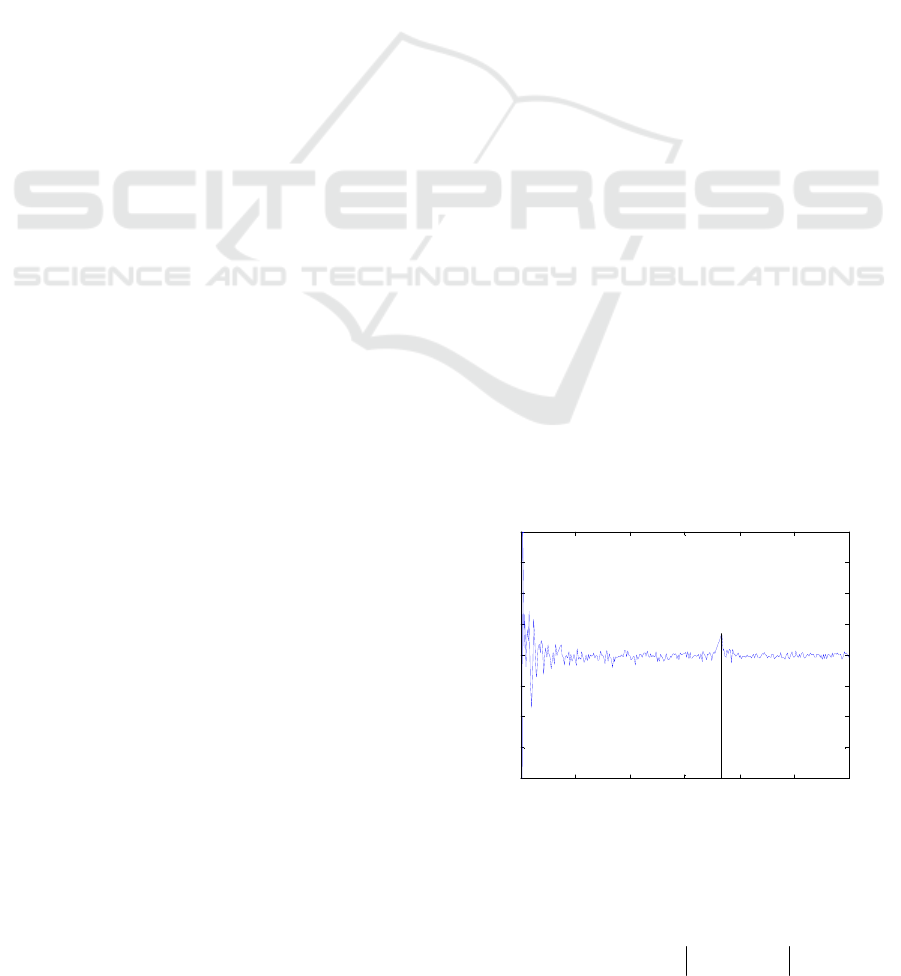
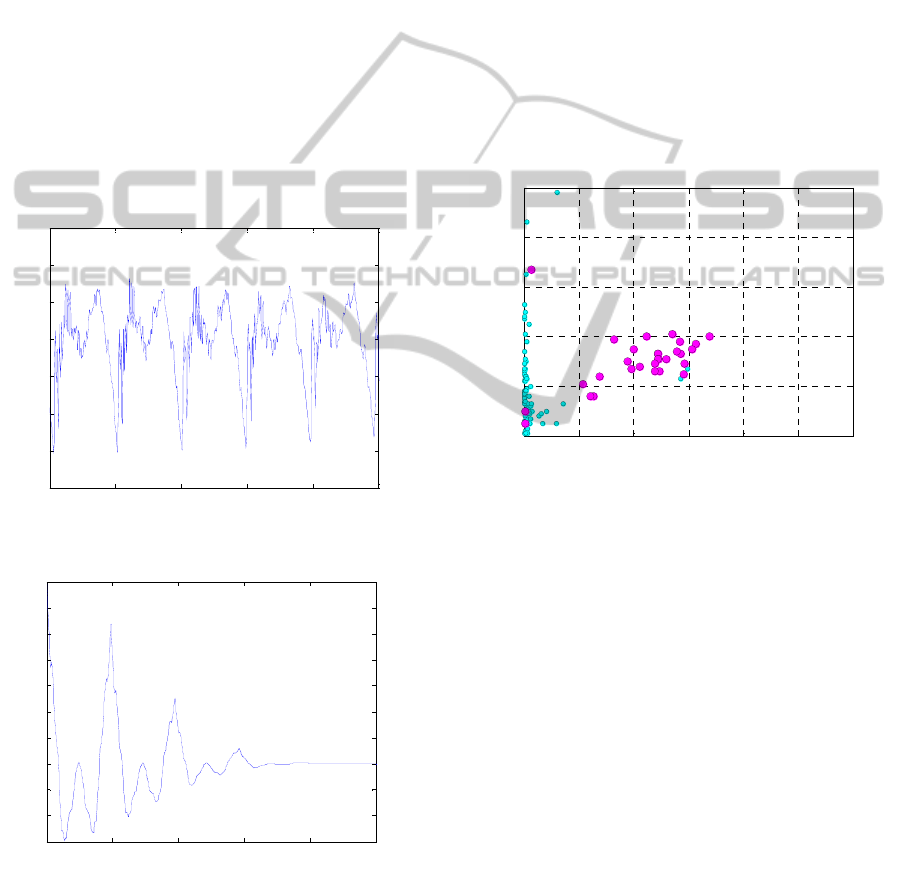
The voiced segment signal shows a periodicity
(Figure 2) that provides typical flow of the
autocorrelation graph (Figure 3). There can be seen
the primary peak of the fundamental frequency.
The proper value of the coefficient providing the
peak varies in some conditions, but the presence of
the fundamental frequency peak can be sufficient for
the determination of the type of the voice segment.
The method determines the voiced or surd segments
very well (Marchetto et al., 2009), (Horák, 2012).
2.4 ZCR to Short-Time Energy
Comparison of Zero-Crossing Rate to Short-Time
Energy determines the type of the segment by the
relation of these characteristics.
The ZCR and Short-Time Energy are simple to
calculate from the digitally sampled voice. The
evaluation is complicated and has to be processed by
advanced statistical methods (Campbell, 1997,
Abdulla, 2002, Atassi, 2008).
0 0.005 0.01 0.015 0.02 0.025 0.03
0
20
40
60
80
100
E
ZCR
Figure 4: The segment type determination using the ZCR
and Short-Time Energy.
The relation of the ZCR and Short-Time Energy can
be seen in Figure 4. The processed speech signal
was divided to segments. The small circles represent
the surd segments. Voiced segments are marked by
the bigger circles. The mostly separated group of
segments can be seen.
2.5 Energy Spread
The spread of Short-Time Energy provides next
technique to determine the type of the voice
segment. Three or more frequency ranges are used to
trigger the values of the energy. The voiced and surd
segments have a typical energy spread in the
frequency ranges that is used to determine its types
(Campbell 1997), (Moisa et al., 2010).
The pre-processing has to be used to set the
proper frequency ranges, which leads to time
consumption.
ICSOFT2013-8thInternationalJointConferenceonSoftwareTechnologies
274
3 DESIGN OF NEW METHOD
As described above, the increasing of the reliability
can be reached using more characteristics. The
harmonic spectrum based on speaker’s fundamental
frequency can provide additional coefficient vector.
The certain rate of uniqueness of this vector is
expected.
3.1 Harmonic Spectrum
A harmonic spectrum contains discrete harmonic
frequency component. The frequencies of these parts
are whole number multiples (2) of the given
fundamental frequency. The ratios of the signal
power in relation to the fundamental frequency
power constitute the harmonic spectrum vector.
nfnF
fund
(2)
The fundamental frequency of human voice is
variable in the longer period during the sentence or
speech. But, the relative ratios related to the
fundamental frequency are expected without any
cardinal changes. It follows from the voice timber
dependency on the specific vocal tract of the given
speaker like the tract of the musical instruments
(Jung et al., 2004).
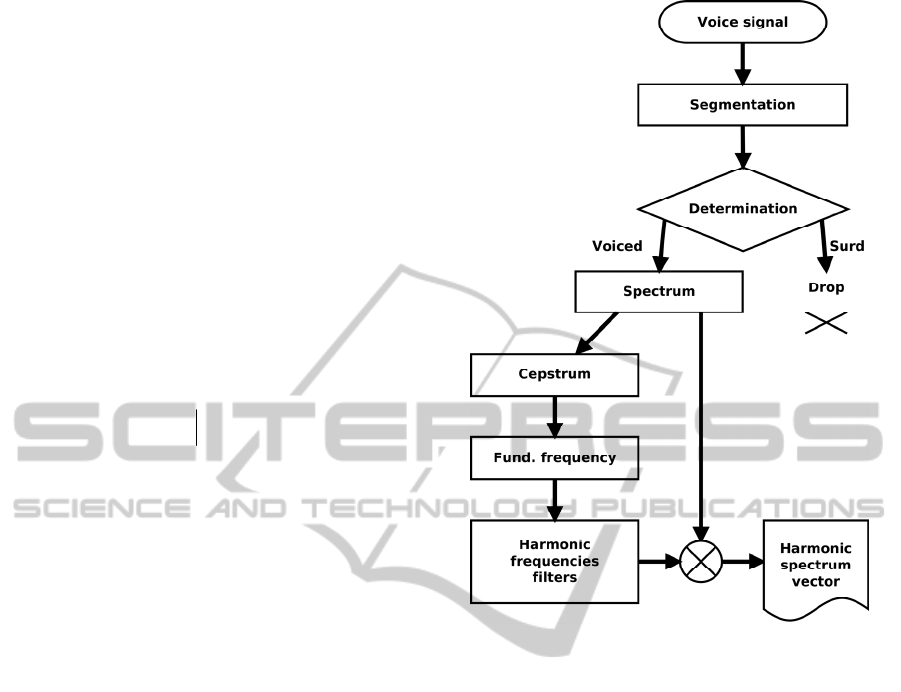
3.2 Process of Extraction
The harmonic spectrum vector consists of values
measured as the power on the given harmonic
frequencies related to the power of the fundamental
frequency. Figure 5 shows the steps of the extraction
process.
The voice signal is recorded using sampling
frequency and processed step-by-step.
3.2.1 Segmentation
The first step of the extraction process is
segmentation. The voice signal has to be divided to
small segments with duration of some tens of
milliseconds. The specific length of the segment
depends on the method of segment type
determination.
The extracting of the harmonic spectrum vector
is based on the value of the fundamental frequency.
This frequency is to be found in the voiced part of
the speech only. It means, the voiced segments of
the speech signal have to be passed to the next steps
of the extraction process.
Figure 5: The harmonic spectrum vector extraction.
3.2.2 Segment Type Determination
As written above, the segment type must be
determined for the voiced segments selection for the
next processing. There are more methods to choose
for determination of the type, as described above:
Cepstral Analysis
Autocorrelation Method
ZCR to Short-Time Energy Relation
Energy Spread Analysis
For this experiment, the autocorrelation method of
the segment type determination is used. The
occurrence or absence of the fundamental frequency
is used to determine the voiced or surd type of the
segment. We don’t need the specific value of the
fundamental frequency in this step, only its
presence, what is sufficient for the use of this quick
method.
If the segment types are determined, the voiced
ones continue in the process, the surd ones are
dropped.
ExtractingCharacteristicsofSpeaker'sVoiceHarmonicSpectrum-DesignofHumanVoiceFeatureExtractionTechnique
275
3.2.3 Spectrum
The spectrum of frequencies present in the voiced
sample is used in two steps of processing. First, the
spectrum is used for the cepstral analysis, which
serves for to find the fundamental frequency precise
value. The second use of the spectrum provides
input data for the filtering using harmonic
frequencies filters.
The spectrum is calculated by Fourier transform
using its fast form (3).
1, ... ,0
1
0
2
NkexX
N
n
N
n
ki
nk
(3)
3.2.4 Cepstrum, Fundamental Frequency
The next step provides a cepstrum. The cepstra
analysis, as described above, provides cepstral
coefficients.
The real cepstrum is used to find the value of the
fundamental frequency. The value is expected in the
range from 60 to 400 Hz for the human voice
(Campbell, 1997). The peak is to be found in this
range (Figure 1) and converted from the cepstral
coefficient number to the frequency domain. The
fundamental frequency is the base for the calculating
of the harmonic frequencies to be used for the
filtering.
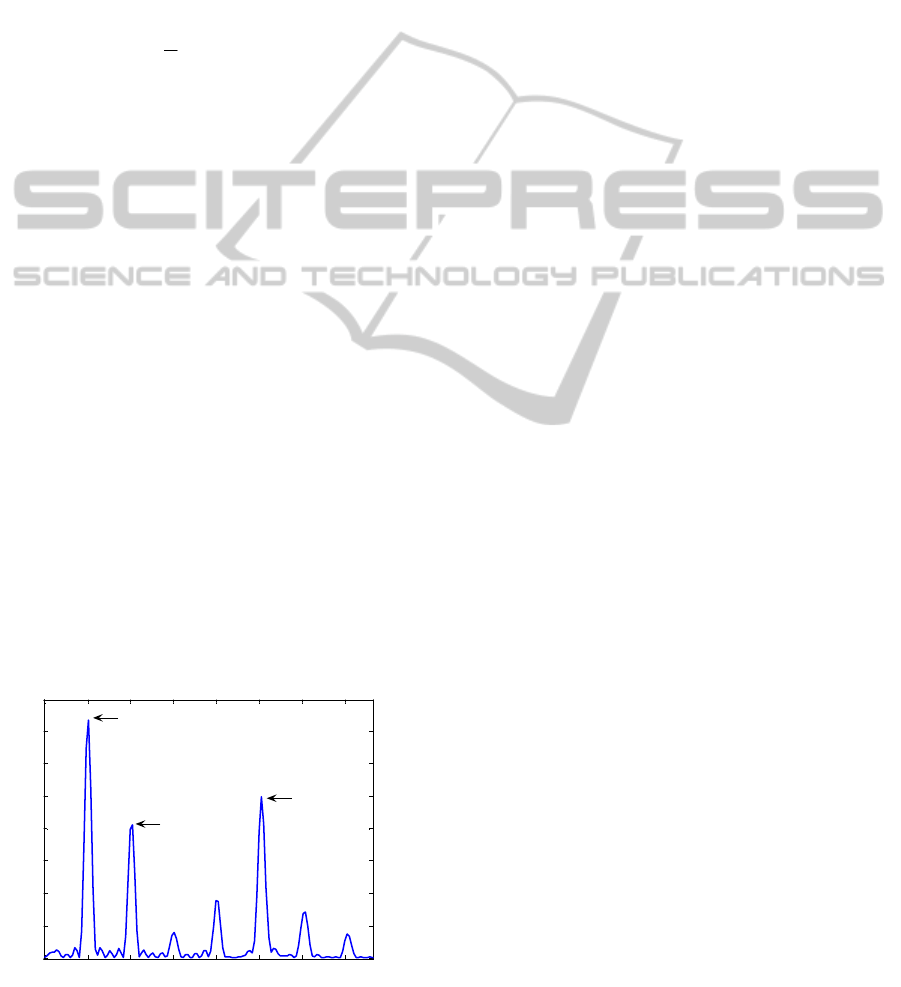
3.2.5 Harmonic Spectrum Vector
When the harmonic frequency filters are set using
the fundamental frequency, the spectrum is filtered
(Figure 6). Because the power at the specific
frequency depends on the volume of the input signal,
the absolute values can not be used. The power
values are related to the power at the fundamental
frequency.
0 100 200 300 400 500 600 700
0
0.05
0.1
0.15
0.2
0.25
0.3
0.35
Frequency c ontent
frequency (Hz)
f
2f
5f
Figure 6: The frequency content after filtering.
The power relations between given harmonic and
the fundamental frequency constitute the values of
harmonic frequency vector, we expect to be specific
for the given speaker. The vectors are calculated
from more voiced segments to be ready to process
by statistic methods.
The Figure 5 shows the powers of harmonic
frequencies obtained from the spectrum using
harmonic filters set by the fundamental frequency
value (2).
4 CONCLUSIONS
The proposed technique is in the testing phase. All
the computations are processed in the MATLAB
environment.
The partial results are before the deeper process
of comparision with another methods. If the testing
shows and confirm the measurable dependency of
the voice harmonic spectrum on the given speaker, it
will be usable to improve the reliability of the
speaker identification process based on the
charasteristic features of the speaker’s voice.
ACKNOWLEDGEMENTS
This work was supported by the project No.
CZ.1.07/2.2.00/28.0327 Innovation and support of
doctoral study program (INDOP), financed from EU
and Czech Republic funds.
REFERENCES
Abdulla, W. H., 2002. Auditory based feature vectors for
speech recognition systems. In: Advances in
Communications and Software Technologies.WSEAS
Press, Stevens Point, Wisconsin, USA.
Atassi, H., 2008. Metody detekce základního tónu řeči. In:
Elektrorevue, Vol.4.
Campbell, Jr, J. P., 1997. Speaker recognition: a tutorial.
In: IEEE 85.
Horák, O., 2012. The Voice Segment Type Determination
using the Autocorrelation Compared to Cepstral
Method. In: WSEAS Transactions on Signal
Processing, vol. 8, issue 1.
Horák, O., 2012. Phoneme Recognizer Based Verification
of the Voice Segment Type Determination. In:
Proceedings of the 3rd International conference on
Applied Informatics and Computing Theory (AICT
'12). WSEAS Press, Stevens Point, Wisconsin, USA.
Jung, J. S., Kim, J. K., and Bae, M. J., 2004. Speaker
Recognition System Using the Prosodic Information.
ICSOFT2013-8thInternationalJointConferenceonSoftwareTechnologies
276

In: WSEAS Transactions on Systems. Vol. 3, Issue 3.
Marchetto, E., Avanzini, F., and Flego, F., 2009. An
Automatic Speaker Recognition System for
Intelligence Applications. In: Proceedings of the 17th
European Signal Processing Conference (EUSPICO
2009). Glasgow, Scotland.
Moisa, C., Silaghi, H., and Silaghi, A., 2010. Speech and
Speaker Recognition for the Command of an Industrial
Robot. In Proceedings of the 12
th
WSEAS
international conference on Mathematical methods
and computational techniques in electrical
engineering. WSEAS Press, Stevens Point, Wisconsin,
USA.
Petry, A., et al., 2008. A Distributed Speaker
Authentication System. In: Applied Computing
Conference (ACC '08). Istanbul, Turkey.
Tadokoro, Y., et al., 2007. Pitch Estimation for Musical
Sound Including Percussion Sound Using Comb
Filters and Autocorrelation Function. In: Proceedings
of the 8th WSEAS International Conference on
Acoustics & Music: Theory & Applications.
Vancouver, Canada.
ExtractingCharacteristicsofSpeaker'sVoiceHarmonicSpectrum-DesignofHumanVoiceFeatureExtractionTechnique
277
