
On the Extension of k-Means for Overlapping Clustering
Average or Sum of Clusters’ Representatives?
Chiheb-Eddine Ben N’Cir
1
and Nadia Essoussi
2
1
LARODEC, ISG Tunis, University of Tunis, Bardo, Tunis, Tunisia
2
LARODEC, FSEG Nabeul, University of Carthage, Nabeul, Tunisia
Keywords:
Overlapping Clustering, Multi-labels, Non disjoint Clusters, Additive Clustering.
Abstract:
Clustering is an unsupervised learning technique which aims to fit structures for unlabeled data sets. Iden-
tifying non disjoint groups is an important issue in clustering. This issue arises naturally because many real
life applications need to assign each observation to one or several clusters. To deal with this problem, recent
proposed methods are based on theoretical, rather than heuristic, model and introduce overlaps in their opti-
mized criteria. In order to model overlaps between clusters, some of these methods use the average of clusters’
prototypes while other methods are based on the sum of clusters’ prototypes. The use of SUM or AVERAGE
can have significant impact on the theoretical validity of the method and affects induced patterns. Therefore,
we study in this paper patterns induced by these approaches through the comparison of patterns induced by
Overlapping k-means (OKM) and Alternating Least Square (ALS) methods which generalize k-means for
overlapping clustering and are based on AVERAGE and SUM approaches respectively.
1 INTRODUCTION
Clustering is an important task in data mining. It
aims to divide data into groups where similar obser-
vations are assigned to the same group called cluster.
It has been applied successfully in manyfields such as
marketing that finds groups of customers with similar
purchasing behaviors, biology that groups unlabeled
plants or animals into species and document classi-
fication that groups related documents into clusters.
Many applications of clustering require assigning ob-
servations to several clusters. This kind of prob-
lematic is referred as overlapping clustering (Diday,
1984; Banerjee et al., 2005; Cleuziou, 2008; Fellows
et al., 2011).
Overlapping clustering is based on the assumption
that an observation can really belong to several clus-
ters. In this cluster configuration, an observation may
belong to one or several clusters without any member-
ship coefficient and the resulting clustering is a cover.
The resolution of this problem contributes to solve
many real life problems that require to find overlap-
ping clusters in order to fit the data set structure. For
example, in social network analysis, community ex-
traction algorithms should be able to detect overlap-
ping clusters because an actor can belong to multiple
communities (Tang and Liu, 2009; Wang et al., 2010;
Fellows et al., 2011). In video classification, overlap-
ping clustering is a necessary requirementwhile video
can potentially have multiple genres (Snoek et al.,
2006). In emotion detection, overlapping clustering
methods should be able to detect several emotions
for a specific piece of music (Wieczorkowska et al.,
2006), etc.
Many methods have been focused on detecting
non-disjoint groups in data. First methods modify re-
sults of fuzzy classification to produce overlapping
clusters such as the extension of clusters obtained
with Fuzzy c-means method by thresholding clus-
ters memberships (Deodhar and Ghosh, 2006; Lin-
gras and West, 2004; Zhang et al., 2007). The main
issue in these methods is the learning of prior thresh-
old which is a difficult task. In addition, criteria to
be optimized iteratively look for optimal partitions
without introducing overlaps between data in the op-
timization step. These contributions, which are not
based on theoretical approaches, can lead to suitable
results in some contexts but their extensions or im-
provements are limited (Banerjee et al., 2005).
Recent methods look for overlapping clusters
based on theoretical approaches. The most important
advantage of these methods is their ability to produce
non-disjoint clusters where overlaps are introduced in
their optimized criteria. These recent methods can be
208
Ben N’Cir C. and Essoussi N..
On the Extension of k-Means for Overlapping Clustering - Average or Sum of Clusters’ Representatives?.
DOI: 10.5220/0004626502080213
In Proceedings of the International Conference on Knowledge Discovery and Information Retrieval and the International Conference on Knowledge
Management and Information Sharing (KDIR-2013), pages 208-213
ISBN: 978-989-8565-75-4
Copyright
c
2013 SCITEPRESS (Science and Technology Publications, Lda.)

categorized into two main approches: SUM and AV-
ERAGE. We denoted by SUM methods which group
observations into overlapping clusters while minimiz-
ing the sum of distances between each observation
and the sum of clusters’ representatives (prototypes
or centroids) to which the observation belongs to. Ex-
amples of these methods are Principal Cluster Anal-
ysis (PCL) (Mirkin, 1987b) with its variants (Mirkin,
1987a; Mirkin, 1990), the Alternating Least Square
algorithms (ALS) (Depril et al., 2008; Wilderjans
et al., 2012) and the Lowdimensional Additive Over-
lapping Clustering (Depril et al., 2012).
Conversely, methods based on AVERAGE ap-
proach group observations into overlapping clusters
while minimizing the sum of distances between each
observation and the average, instead of the sum, of
clusters’ representatives to which the observation be-
longs to. Examples of these methods are the Over-
lapping k-means (OKM) (Cleuziou, 2008), Kernel
Overlapping k-means (KOKM) (N’cir et al., 2010),
Overlapping k-Medoid (OKMED) (Cleuziou, 2009),
the Evidential c-means (ECM) (Masson and Denux,
2008) and Overlapping Clustering with Sparseness
Constraint (Lu et al., 2012).
All these methods extend k-means to take into ac-
count that an observation belongs to several clusters.
Despite different approaches are used by these meth-
ods, they are considered as generalization of k-means
to overlapping clustering (Cleuziou, 2008; Mirkin,
1990; Depril et al., 2008). If each observation is as-
signed to only one cluster, objectivecriteria optimized
by these methods exactly match with the objectivecri-
terion of k-means. The aim of this paper is to study
patterns induced by AVERAGE and SUM approaches
used to model overlapping clustering. We compare
effectiveness of OKM (AVERAGE based method) and
ALS (SUM based method) to identify overlapping
groups. We discuss cases in which these models can
be applied in real life applications.
This paper is organized as follows: Section 2 and
Section 3 describe respectively OKM and ALS meth-
ods. Then, Section 4 presents discussions on pat-
terns induced by OKM and ALS and describes clus-
tering applications in which these methods were ap-
plied. Section 5 presents experiments performed on
real overlapping data sets to check effectiveness of
OKM and ALS in detecting overlapping clusters. Fi-
nally Section 6 presents conclusion and future works.
2 OVERLAPPING k-Means (OKM)
OKM introduces the overlapping constraint (an ob-
servation can belong to more than one cluster) in the
usual squared error objective function. The function
models a local error on each observation x defined
by the squared Euclidean distance between x and it’s
representative in the clustering, denoted as “image”
(im(x)). Given a dataset X with N data over R
P
and a
number K of expected clusters, the aim of OKM is to
find the binary assignment matrix Π(N × K) and the
cluster representatives (prototypes) C = {c
1
,...,c
K
}
such that the following objective function is mini-
mized:
J
OKM
(Π,C) =
∑
x
i
∈X
k x
i
− im
Π,C
(x
i
) k
2
, (1)
where im
Π,C
(x
i
) is the average combination of cluster
representatives. Let Π
i
the set of clusters to which
x
i
belongs and |Π
i
| the number of clusters for x
i
, the
im
Π,C
(x
i
) is described by:
im
Π,C
(x
i
) =
∑
k∈Π
i
c
k
|Π
i
|
. (2)
The minimization of the objective function is per-
formed by iterating two principal steps:
1. computation of cluster representatives (C).
2. multi assignment of observationsto one or several
clusters (Π).
The update of representatives is performed locally for
each cluster. For the multiple assignment step, the
OKM method uses an heuristic to explore part of
the combinatorial set of possible assignments. The
heuristic consists, for each observation, in sorting
clusters from closest to the farthest, then assigning
the observation in the order defined while assignment
minimizes the distance between the observation and
its image. The stopping rule of algorithm is charac-
terized by two criteria: the maximum number of iter-
ations or the minimum improvement of the objective
function between two iterations.
3 ALTERNATING LEAST
SQUARE (ALS)
ALS is based on the Additive Overlapping Clustering
model (Mirkin, 1990). This model introduces the pos-
sibility that an observation belongs to more than one
cluster by considering variable values of an observa-
tion equals to the sum of the clusters’ profiles (pro-
totypes) to which the observation belongs to. Given
a dataset X with N data over R
P
and a number K of
expected clusters, a model matrix M = ΠC is looked
for to optimally approximate X. The matrix M can be
estimated by minimizing the least squares loss func-
tion:
OntheExtensionofk-MeansforOverlappingClustering-AverageorSumofClusters'Representatives?
209
J
ALS
(Π,C) =k X −ΠC k
2
F
=
∑
x
i
∈X
k x
i
−
∑
k∈Π
i
c
k
k
2
, (3)
where k . k
2
F
is the Frobenius norm of a matrix. For
the minimization of the loss function, ALS starts from
an initial binary membership matrix Π
0
, then it will
estimate the conditionally optimal profiles C upon Π;
subsequently it will estimate the conditionally opti-
mal memberships Π upon C, and this process will
be repeated until convergence. The advantage of this
method consists of its ability to take into account all
possible assignments for each observation by explor-
ing 2
k
assignments. The optimal assignments for each
observation are the assignments which minimize the
local error between the observation and the sum of
clusters’ profiles to which this observation belongs to.
4 DISCUSSION
We note that both OKM and ALS tolerate overlaps be-
tween clusters leading to non disjoint clusters. If we
add the constraint that each observation is assigned
to only one group |Π
i
| = 1, the optimized criteria by
these methods match with the objective criterion of k-
means. The main difference between OKM and ALS
consists on how the overlaps are introduced in the ob-
jective criterion: for OKM, each observation is repre-
sented by the average of clusters’ prototypes to which
the observation belongs to, however for ALS each ob-
servation is represented by the sum of clusters’ proto-
types.
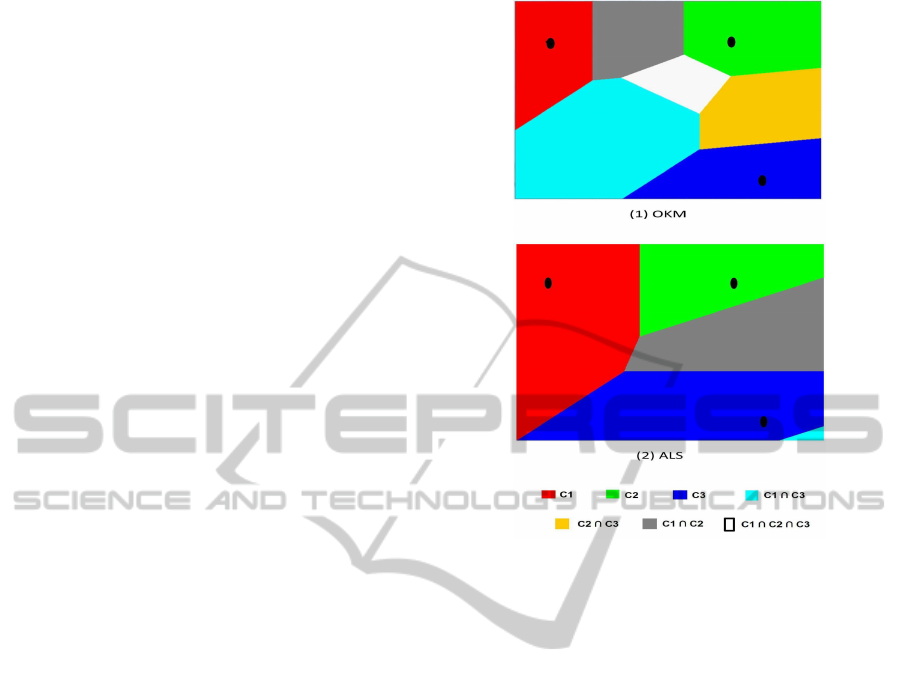
To study the influence of this fact on the induced
patterns, we visualize partitioning of OKM (AVER-
AGE based method) and ALS (SUM based method)
through Vorono¨ı cells obtained for three clusters over
a two dimensional space as defined by the objec-
tive criterion optimized by these methods. Figure ??
shows an example of these Vorono¨ı cells: the rep-
resentation space is divided into several cells where
each possible combination of clusters is associated to
one cell. For OKM, we show seven cells (all pos-
sible combinations of clusters except the empty set)
where each cell is centered on a prototype or a com-
bination (average) of prototypes. For ALS, we notice
that overlaps between clusters are not recovered, we
show only overlaps between cluster1∩ cluster2 and
between cluster2 ∩ cluster3 . We can easily remark
that the gray cell is defined by the combination (sum)
of representatives of cluster 1 (red cell) and cluster 2
(green cell).
Methods based on SUM and AVERAGE ap-
proaches can lead to non disjoint groups. The adop-
tion of these approaches are motivated by require-
ments of real life applications. Methods based on
Figure 1: Vorono¨ı cells obtained with OKM (AVERAGE
based Approach) and ALS (SUM based Approach) for three
clusters.
SUM have been well applied in grouping patients into
diseases. Each patient may suffer from more than one
disease and therefore could be assigned to multiple
syndrome clusters. Thus, the final symptom profile
of a patient is the sum of the symptom profiles of all
syndromes he is suffering from. However, this type of
methods needs sometimes to prepare data to have zero
mean to avoid false analysis. For example, if symp-
tom variable represents the body temperature, then
when a patient simultaneously suffers from two dis-
eases, it is not realistic to assume that his body tem-
perature equals to the sum of body temperatures as
associated with two diseases.
Methods based on AVERAGE approach have
been well applied to group music signals into dif-
ferent emotions and films into several genres. These
methods consider that overlapping observations must
appear in the extremity surface between overlapping
clusters. For example, if a film belongs to action and
horror genres, it should have some shared properties
with these categories of films but it can neither be a
full action film neither a full horror one. So, overleap-
ing films belonging to action and horror categories
may appear in the limit surface between full horror
and full action films.
KDIR2013-InternationalConferenceonKnowledgeDiscoveryandInformationRetrieval
210

Table 1: Statistics of used data sets.
Data set Domain N Dimension Labels Cardinality
EachMovie Video 75 3 3 1.14
Music emotion Music 593 72 6 1.86
Scene Images 2407 192 6 1.07
5 EXPERIMENTS
In this section, we check effectiveness of OKM and
ALS in detecting overlapping groups through an ex-
perimental study on real overlapping data sets.
5.1 Data Sets Description and
Evaluation Measures
Experiments are performed on Eachmovie
1
, Music
emotion
2
and Scene
3
data sets. For each data set, the
number of clusters K was set to the number of un-
derlying categories in the data set. Table 1 shows the
statistics for each data set. “Labels” is the number of
categories and “Cardinality” (natural overlaps) is the
average number of categories for the observations.
Cardinality = 1/N
∑
x
i
∈X
L
i
, (4)
where N is the number of observations and L
i
is the
number of labels of observation x
i
.
Results are compared using four validation mea-
sures: Precision, Recall, F-measure and Overlap size.
The first three validation measures estimate whether
the prediction of categories is correct with respect to
the underlying true categories in the data. Precision
is calculated as the fraction of observations correctly
labeled as belonging to class c
i
divided by the total
number of observations labeled as belonging to class
c
i
. Recall is the fraction of observations correctly
labeled as belonging to class c
i
divided by the total
number of observations that really belong to class c
i
.
The F-measure is the harmonic mean of Precision and
Recall.
Precision(c
i
) = NCLO/TNLO
Recall(c
i
) = NCLO/TNAC
F-measure(c
i
) = 2*Precision(c
i
)*Recall(c
i
) /
(Precision(c
i
)+Recall(c
i
))
where NCLO, TNLO and TNAC are respectively the
number of correctly labeled observations, the total
number of labeled observations and the total number
1
cf. http://www.grouplens.org/node/76.
2
cf.http://mlkd.csd.auth.gr/multilabel.html
3
cf.http://mlkd.csd.auth.gr/multilabel.html
of observations that really belong to the correct class.
All these measures are performed separately on each
cluster, then the average value of all clusters is re-
ported. The fourth measure, Overlap size, evaluates
the size of overlaps builded by the learning method.
This measure can be determined by the average num-
ber of labels of each observation in the data set as
follows:
Overlapsize =
∑
x
i
∈X
|c
i
|
|X|
, (5)
where |X| is the total number of observations and |c
i
|
is the number of clusters to which observation x
i
be-
longs.
5.2 Empirical Results
Table 2 reports the average of precision (P), recall (R)
and F-measure (F) on ten runs on Eachmovie, Music
Emotion and Scene data sets. For each run, all meth-
ods have the same initialization of prototypes. Re-
sults of ALS in Scene data set are not reported be-
cause of computational problem
4
. We notice that av-
erage of F-measures obtained with overlapping meth-
ods outperform F-measures obtained with k-means.
For example F-measures obtained with OKM and
ALS in Music Emotion data set are equal to 0.362
and 0.388 respectively, while using k-means the ob-
tained F-measure is 0.288. However, in Scene data set
F-measure obtained with k-means outperforms those
obtained with OKM and ALS. This result is explained
by the fact that actual overlaps in Scene data set are
not large (overlaps=1.07). Compared to k-means, re-
sults obtained with OKM and ALS are more impor-
tant as well as the size of overlaps in the data set in-
creases.
Results obtained with fuzzy c-means using differ-
ent thresholding membership are characterized by law
values and are much sensitive to the used threshold:
for example, in the Scene data set, using a threshold
equal to 0.3, all observations are not assigned to any
cluster which explain the null values of fuzzy c-means
in this data set. However, in Eachmovie data set using
4
execution needs more than 24 hours
OntheExtensionofk-MeansforOverlappingClustering-AverageorSumofClusters'Representatives?
211

Table 2: Comparison of the performance of OKM and ALS versus other existing methods in overlapping data sets.
Data set Label Eachmovie Music Scene
P R F P R F P R F
k-means 0.731 0.544 0.623 0.501 0.203 0.288 0.503 0.515 0.508
Fuzzy c-means (threshold=0.3) 0.523 0.847 0.647 0.441 0.251 0.310 0.000 0.000 0.000
Fuzzy c-means (threshold=0.4) 0.691 0.523 0.596 0.490 0.205 0.288 0.000 0.000 0.000
OKM 0.582 0.827 0.687 0.397 0.332 0.362 0.338 0.887 0.482
ALS 0.515 0.779 0.620 0.299 0.555 0.388 - - -
Table 3: Size of overlaps obtained with ALS, OKM and other methods in overlapping data sets.
Size of Overlap
Eachmovie data set Music data set Scene data set
Real overlap size (1.14) (1.81) (1.08)
k-means 1 1 1
Fuzzy c-means (threshold=0.3) 1.26 1.22 0.00
Fuzzy c-means (threshold=0.4) 0.93 0.97 0.00
OKM 1.40 2.35 2.85
ALS 1.73 3.46 -
fuzzy c-means with the same threshold’ value gives
0.647 of F-measure. These results show the limit of
fuzzy c-means to detect overlapping groups and show
the sensitivity of fixing the threshold.
For all experiments, the obtained size of overlaps
affects the value of obtained F-measure: as well as
the size of overlaps increases, the value of Precision
decreases and the value of Recall increases. We no-
tice that OKM and ALS have the best values of Re-
call because they build clusters with large overlapping
boundaries and k-means has the best values of Preci-
sion because overlaps are null.
Therefore, knowing the actual overlaps in each
data set, sizes of overlaps built by each method are
discussed. Table 3 summarizes overlaps obtained
with OKM and ALS compared to K-means and Fuzzy
c-means. All built size of overlaps with k-means
are equal to 1 since this method builds non disjoint
clusters and ignores the possibility that an observa-
tion belongs to more than one cluster. Fuzzy c-means
builds acceptable overlaps if the threshold is well de-
termined, elsewhere we can obtain an overlap size less
than 1. For all data sets, we notice the large over-
laps built by ALS compared to overlaps obtained with
OKM. For example, in music emotion data set, the
size of overlaps obtained with ALS is 3.46 while us-
ing OKM the size of overlaps is 2.35.
6 CONCLUSIONS
In order to extend k-means to take into account that
each observation may be assigned to several clusters,
many methods have been proposed based on SUM
and AVERAGE approaches to model the overlaps be-
tween clusters in the objectivecriterion. We studied in
this paper patterns induced buy two existing methods
which are OKM and ALS. We show that the adoption
of one of these approaches can lead to non disjoint
clusters, however it depends on the definition of over-
laps in the target application.
To improve the comparison of SUM and AVER-
AGE approaches we plan to compare others existing
methods based on these approaches. We plan to con-
duct experiments on others real and artificial overlap-
ping data sets.
REFERENCES
Banerjee, A., Krumpelman, C., Basu, S., Mooney, R. J., and
Ghosh, J. (2005). Model based overlapping cluster-
ing. In International Conference on Knowledge Dis-
covery and Data Mining, pages 532–537, Chicago,
USA. SciTePress.
Cleuziou, G. (2008). An extended version of the k-means
method for overlapping clustering. In International
Conference on Pattern Recognition ICPR, pages 1–4,
Florida, USA. IEEE.
Cleuziou, G. (2009). Two variants of the okm for overlap-
ping clustering. In Advances in Knowledge Discovery
and Management, pages 149–166.
Deodhar, M. and Ghosh, J. (2006). Consensus cluster-
ing for detection of overlapping clusters in microarray
data.workshop on data mining in bioinformatics. In
International Conference on data mining, pages 104–
108, Los Alamitos, CA, USA. IEEE Computer Soci-
ety.
Depril, D., Mechelen, I. V., and Wilderjans, T. F.
(2012). Lowdimensional additive overlapping clus-
tering. Journal of Classification, 29(3):297–320.
Depril, D., Van Mechelen, I., and Mirkin, B. (2008). Al-
gorithms for additive clustering of rectangular data
tables. Computational Statistics and Data Analysis,
52(11):4923–4938.
KDIR2013-InternationalConferenceonKnowledgeDiscoveryandInformationRetrieval
212

Diday, E. (1984). Orders and overlapping clusters by pyra-
mids. Technical Report 730, INRIA, France.
Fellows, M. R., Guo, J., Komusiewicz, C., Niedermeier, R.,
and Uhlmann, J. (2011). Graph-based data clustering
with overlaps. Discrete Optimization, 8(1):2–17.
Lingras, P. and West, C. (2004). Interval set clustering of
web users with rough k-means. J. Intell. Inf. Syst.,
23(1):5–16.
Lu, H., Hong, Y., Street, W., Wang, F., and Tong, H. (2012).
Overlapping clustering with sparseness constraints. In
IEEE 12th International Conference on Data Mining
Workshops (ICDMW), pages 486–494.
Masson, M.-H. and Denux, T. (2008). Ecm: An eviden-
tial version of the fuzzy c-means algorithm. Pattern
Recognition, 41(4):1384 – 1397.
Mirkin, B. G. (1987a). Additive clustering and qualitative
factor analysis methods for similarity matrices. Jour-
nal of Classification, 4(1):7–31.
Mirkin, B. G. (1987b). Method of principal cluster analysis.
Automation and Remote Control, 48:1379–1386.
Mirkin, B. G. (1990). A sequential fitting procedure for
linear data analysis models. Journal of Classification,
7(2):167–195.
N’cir, C.-E. B., Essoussi, N., and Bertrand, P. (2010).
Kernel overlapping k-means for clustering in feature
space. In KDIR, pages 250–255.
Snoek, C. G. M., Worring, M., van Gemert, J. C., Geuse-
broek, J.-M., and Smeulders, A. W. M. (2006). The
challenge problem for automated detection of 101 se-
mantic concepts in multimedia. In Proceedings of the
14th annual ACM international conference on Mul-
timedia, MULTIMEDIA ’06, pages 421–430, New
York, USA. ACM.
Tang, L. and Liu, H. (2009). Scalable learning of collective
behavior based on sparse social dimensions. In Pro-
ceedings of the 18th ACM conference on Information
and knowledge management, pages 1107–1116.
Wang, X., Tang, L., Gao, H., and Liu, H. (2010). Discov-
ering overlapping groups in social media. In Proceed-
ings of the 2010 IEEE International Conference on
Data Mining, pages 569–578.
Wieczorkowska, A., Synak, P., and Ras, Z. (2006). Multi-
label classification of emotions in music. In Intelligent
Information Processing and Web Mining, volume 35
of Advances in Soft Computing, pages 307–315.
Wilderjans, T. F., Depril, D., and Mechelen, I. V. (2012).
Additive biclustering: A comparison of one new and
two existing als algorithms. Journal of Classification,
30(1):56–74.
Zhang, S., Wang, R.-S., and Zhang, X.-S. (2007). Identi-
fication of overlapping community structure in com-
plex networks using fuzzy c-means clustering. Phys-
ica A: Statistical Mechanics and its Applications,
374(1):483–490.
OntheExtensionofk-MeansforOverlappingClustering-AverageorSumofClusters'Representatives?
213
