
Combining Video and Player Telemetry for
Evidence-based Decisions in Soccer
H
˚
avard D. Johansen
1
, Svein Arne Pettersen
2
, P
˚
al Halvorsen
3
and Dag Johansen
1
1
Department of Computer Science, University of Tromsø, Tromsø, Norway
2
Regional Centre for Sport, Exercise and Health—North, University of Tromsø, Tromsø, Norway
3
Department of Informatics, University of Oslo, Oslo, Norway
Keywords:
Big-data Soccer Analytics, Video Retrieval, Athlete Sensor Network, Data Security.
Abstract:
Technology is changing how soccer clubs train and interact with their supporters. Systems that provide ac-
quisition and visualization of low-level player telemetry, like distance covered and speed, are already being
widely adopted. A key observation is that such data when correlated with actual in-game video footage is
a powerful tool for evidence-based decisions. As data volume and complexity grow, efficient tools for auto-
mated high-precision retrieval become essential. This paper describes the unique combination of a radio-based
sensor platform and several custom video retrieval systems in operational use at Tromsø Idrettslag (TIL), a
Norwegian premier league soccer club. The systems have been developed using an experimental computer-
science method where several prototypes were built and deployed for evaluation in close collaboration with
the intended users. Although our method of computer-system prototyping has not yielded commercial quality
products, it has enabled us to construct several novel systems combining low-level player telemetry with video
retrieval, annotations, and user-centric security.
1 INTRODUCTION
Analytic of precise player performance telemetry in
combination with correlated video is reshaping how
sports are played (Dizikes, 2013) and how athletes are
being developed. Online real-time publication of de-
tailed and precise game information and statistics also
enables supporters to engage with their favorite team
at a completely new level. As sensor technology ad-
vances, more athlete parameters become available for
quantification and at an increasing level of precision.
Paradoxically, as data volumes and complexity
grow, it is easy to lose overview of important param-
eters and their significance in the sheer volume of
collected data. The ability to extract reliable high-
level understanding from collected player teleme-
try is essential when performing quantitative analy-
sis of athletes’ performance for the purpose of mak-
ing evidence-based decisions. Manually navigation
large video and telemetry archives in order to locate
and process the required data is time consuming and
quickly becomes impractical as data volumes grows.
Simple visualization of low-level player data, like to-
tal sprint distance and High Intensity Runs (HIRs), are
also often not of sufficient practical value for complex
athletic development tasks. This is particularly true
in soccer as each position requires a particular set of
skills and physical attributes. To add to the complex-
ity, different teams have different style of play, each
requiring certain type of specialized training. For in-
stance, some teams play with very offensive and at-
tacking full-backs, while in others teams, this posi-
tion is primarily defensive, providing protection from
attacking wide midfielders.
The ability to extract useful high-level signals
from voluminous data taking team specific play styles
into account is therefore a key property of next gen-
eration sports analytic systems. Analyzing volumi-
nous and complex data sets is known as big data, and
we are investigating multiple approaches suitable for
operational use in soccer clubs. A key observation
we made is that such data analysis tools, when com-
bined with efficient video retrieval systems, are effec-
tive tools for evidence-based coaching.
We are researching a broad range of emerg-
ing athlete quantification systems for use in Tromsø
Idrettslag (TIL), a Norwegian premier league soccer
club. This includes state-of-the-art industrial big-data
approaches, as applying MapReduce data processing
engines like Oivos (Valv
˚
ag et al., 2013), machine
197
D. Johansen H., Arne Pettersen S., Halvorsen P. and Johansen D..
Combining Video and Player Telemetry for Evidence-based Decisions in Soccer.
DOI: 10.5220/0004676101970205
In Proceedings of the International Congress on Sports Science Research and Technology Support (PerSoccer-2013), pages 197-205
ISBN: 978-989-8565-79-2
Copyright
c
2013 SCITEPRESS (Science and Technology Publications, Lda.)

learning (Karlberg, 2013), and user-side access con-
trol (van Renesse et al., 2013). We are using existing
commercial systems as reference foundation to dis-
till limitations and missing functionality; our primary
goal is to develop novel computer systems filling the
identified gaps. Non-invasive, privacy preserving, and
accurate technologies are fundamental in this context,
though best practice and general design principles are
yet to emerge.
In this paper, we describe a set of complemen-
tary software components for quantifying both objec-
tive and subjective performance metrics and health
data in the soccer domain. This includes Davvi ,
a search based video composition system (Johansen
et al., 2012a), Bagadus , a video-based player trac-
ing system (Sægrov et al., 2012), and Muithu , a
mobile phone based notational analysis system (Jo-
hansen et al., 2012b). We have had these experimental
systems in operational use through several seasons by
TIL, both for training sessions and official matches.
At the core of this technology platform is ZXY Sport
Tracking (ZXY), a body-area sensor network system
providing raw, physical data from individual athletes.
We focus on our experience using this hardware and
software stack for monitoring and aggregating data in
the soccer domain.
The rest of the paper is organized as follows. Sec-
tion 2 presents technical details about the ZXY sys-
tem. Section 3 gives an example illustrating the com-
plexity of interpreting quantitative data to gain new
insight. Section 4 describes the video software com-
ponents that we have developed in combination with
ZXY to provide higher-order services, and Section 5
describes our data security mechanism. Finally, Sec-
tion 6 concludes.
2 THE ZXY SPORTS TRACKING
SYSTEM
Positional data has already become one of the core
data sources for athlete quantification, enabling us to
track metrics like distance covered, sprints, and HIRs.
A large number of commercial systems already ex-
ist for this purpose and is being rapidly adopted in
soccer; a recent example is the adoption of Adidas
miCoach data trackers by the US Major League Soc-
cer teams (Ehrlich and Dennison, 2012). These sys-
tems typically use GPS for geo-tracking, or in some
cases, computer vision algorithms processing video
input (Valter et al., 2006). GPS, which is perhaps
most commonly used, has been shown inaccurate for
some purposes (Portas et al., 2010). Unlike these sys-
tems, ZXY relies on a radio-based signaling substrate
Figure 1: The ZXY Sport Tracking sensor belt.
to provide real-time high-precision positional track-
ing of athletes in combination with other sensor data
like acceleration and heart rate.
2.1 Monitoring Substrate
As with many sport tracking systems, ZXY requires
each athlete to wear a sensor belt around his or her
lower torso. As shown in Figure 1, the 10 gram sensor
is integrated into the belt and placed in contact with
skin under the jersey and shorts. The positioning of
the electronic sensor system at the players lumbar has
in practice shown to provide the best compromise for
monitoring signals corresponding to the power gener-
ated from each footstep.
Being light weight and low profile, the belt is con-
sidered non-invasive. In our experience, players do
not feel any discomfort wearing the belt, and they ac-
cept it as a part of their training and match kit. The
belt has been approved for usage both in the national
top league and in UEFA matches, which allow us to
track the players in official matches.
In addition to positional data, the belt includes an
accelerometer that registers body movements in all
3-directional axes, a gyro, a heart-rate sensor, and a
compass. The accelerometer provides valuable data
in addition to the more common data of distance cov-
ered in different speed categories (Mohr et al., 2008;
Mohr et al., 2003). The magnetic compass in com-
bination with the gyro allows us to track the actual
heading of the player. Battery capacity of the belt is
approximately 10 hours when in use and 180 days in
standby mode.
icSPORTS2013-InternationalCongressonSportsScienceResearchandTechnologySupport
198

Figure 2: ZXY radio receiver mounted on antennas around
the stadium.
2.2 Aggregation Substrate
Data from the sensor belt is aggregated and stored
in a central relational database. Communication is
through calibrated, stationary radio receivers mounted
in poles or on the tribune roof around the sports arena,
as seen in Figure 2. The current generation of the
ZXY system is based on the 2.45 GHz ISM band for
radio communication and signal transmissions. All
receivers are interfaced to the data infrastructure us-
ing standard TCP/IP connections over Ethernet.
Each receiver has a field-of-view corresponding
to approximately 90 degrees in room angle. In a
deployment situation, this determines the number of
sensors to be applied for the specific installation site.
Alfheim, the home arena of TIL, is currently equipped
with 10 receivers configured to receive data from
overlapping zones of the soccer field. This redun-
dancy provides high immunity to occlusions and sig-
nal blocking, which is necessary to ensure reliable op-
eration.
Each stationary radio receiver computes the po-
sition data for each belt in the field using advanced
vector based processing of the received radio signals.
The processing system enables direct projection of
each players position on the field without the use of
conventional triangulation methods. The default po-
sitional sampling rate is currently fixed to 20 Hz for
each belt transmitting in real-time to a central rela-
tional aggregation database. Furthermore, by includ-
ing all body sensor information in the same radio sig-
nal used for computing the positions, the system en-
ables time synchronization of all data when stored in
the database. Aggregated data can be exported as Mi-
crosoft Excel spreadsheets for detailed analytic in sta-
tistical tools like IBM SPSS Statistics and MathWorks
MATLAB.
2.3 Data Accuracy
A disadvantage with ZXY is a relatively high infras-
tructure cost and that it is stationary. GPS systems
based on satellite tracking are generally cheaper and
more spatially portable, but might be less correct with
regard to positional data. We have been interested
in evaluating how a stationary radio based system as
ZXY compares to GPS based tracking systems. We
therefore tested both the inter and intra reliability of
ZXY and GPS based tracking systems.
In the inter reliability test, we equipped seven
players with both the ZXY sensor belt and the
GP Sport SPI-ProX1 5Hz sensor belt, a common
GPS based athlete tracking system. Wearing belts
from both systems, the players performed the Copen-
hagen Soccer Test for Women (CSTw) (Bendiksen
et al., 2013) while we recorded their movements.
The SPI-ProX1 system measured the average cov-
ered distance for a player to 11.668 ± 1.072km with
some tracks well outside the test field. This is to
our surprise less accurate than we expected. ZXY
gives a more accurate measurement with an average
of 10.204 ± 0.103km and with all recorded tracks in-
side the area of the test.
Although the CSTw test specifies a 10.331km pre-
set course that the players should follow, some dis-
crepancies in the measured distance are to be ex-
pected. This because even small deviation of the sen-
sor device from the set trajectories of the test, like the
player leaning in the corners, will impact the mea-
surements and adds up throughout the test.
In the intra reliability test, we equipped five play-
ers with two GP Sport SPI-ProX1 belts and seven
players with two ZXY belts. The measured discrep-
ancy between the two belts on the same player ranged
between 0.800–2.071 km for SPI-ProX1 and for ZXY
it ranged between 0.025–0.290k m. Our observation
that the SPI-ProX1 system seems to measure higher
values for distance covered is further supported by
an experiment where 19 players of two junior elite
teams were equipped with both ZXY and SPI-ProX1
in a similar manner as our inter reliability test. The
average distance covered was here measured by SPI-
ProX1 to 10.805 ± 0.847 km, while ZXY measured
the distance to 9.891 ± 0.974 km (unpublished data).
CombiningVideoandPlayerTelemetryforEvidence-basedDecisionsinSoccer
199
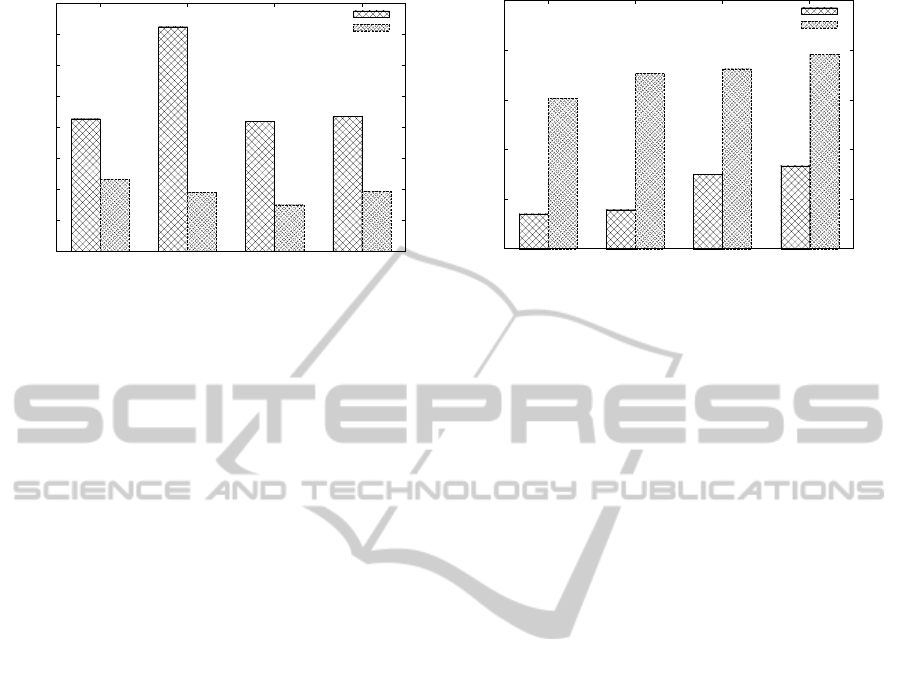
0
100
200
300
400
500
600
700
800
Start Viking Sarp08 Brann
total sprint distance (m)
match
Player A (central midfield)
Player B (wide midfield)
Figure 3: Measured sprint distance.
1
1.1
1.2
1.3
1.4
1.5
Start Viking Sarp08 Brann
acceleration / distance covered
match
Player A (central midfield)
Player B (wide midfield)
Figure 4: Measured effort level.
The producer of ZXY claims accuracy in the order
of 0.5m for our version of the system. This conforms
to our experience from having athletes run on visu-
ally identifiable trajectories on the soccer pitch like
on the midfield circle, the 16 m squares, and the mid-
field line. We thus conclude that ZXY provides sig-
nificantly more accurate positional data relative to the
GPS counterpart.
With the ZXY as an accurate base layer for player
telemetry, we have been able to evolve a unique
and accurate data analytic platform for evidence-base
coaching, consisting of several software components.
3 BIG SOCCER DATA
Although basic athlete measurements and parameters
can easily be drawn from reliable data sources, the rel-
evance and importance of these insights might vary.
For instance, using positional data one can quite eas-
ily compute and visualize the distance each player has
spent walking, sprinting, or in HIRs during a game.
By plotting these numbers for the different speed
categories for a series of matches and for several play-
ers, one might gain insight in the intensity of the game
and the energy spent by the players. As an example,
we have in Figure 3 plotted the total distance cov-
ered at sprint speeds (i.e., > 25.2 kmh
−1
) for two of
our players, here denoted Player A and Player B for
anonymity, in four different games, as captured by
ZXY. In all these games, Player A is a central mid-
fielder and Player B is a wide midfielder.
On average, soccer players cover 10–13km dur-
ing a typical 90 minutes elite soccer match (Bangsbo
et al., 2006), with variance from specific positions
and play styles. As can clearly be seen in the figure,
Player A covers more of his distance at sprint speeds
compared to Player B. This is explained by the fact
that Player A was a wide midfielder during all these
matches and was expected to sprint more than the cen-
tral midfielder position of Player B.
Having only positional data one might therefore
be tempted to conclude that Player A is spending
more energy than Player B. Energy expenditure, here
defined as effort is, however, harder to quantify ac-
curately compared to distance covered and involves
other parameters than positional data. Player spe-
cific video feeds and gathered player wellness reports
in combination with the experiences of head coaches
give strong indications that a sole focus on distance
covered at different speed levels will not give a com-
plete view and understanding of the physical demands
of a game. Using player telemetry and video, such
insight can then be quantified in specific data points
using analytical big-data techniques, which combine
and refine data from multiple sources through an iter-
ative multi-step process.
In our case, we correlated the sprint distance data
from the positional sensor with data from the ac-
celerometer also worn by the players. By counting
the number of positive or negative changes in speed
in the sum of all three dimensions during 20Hz inter-
vals and after factoring out the effect of gravity, we
obtain a measurement of the total effort load of each
individual player. As can be seen from Figure 4, when
the acceleration-based effort level measurements of
players A and B are compared to their individual to-
tal sprint distance, the situation observed in Figure 3
becomes the opposite: Player B is now seemingly
spending more energy than Player A, even if he is
printing less than 50% of Player A. This observation
is more in line with what is expected from studying
actual in-game video footage of the play styles of A
and B. As a central midfielder, Player B more of-
ten accelerates, decelerates, and makes sharp changes
of direction compared to the wide midfielder role of
icSPORTS2013-InternationalCongressonSportsScienceResearchandTechnologySupport
200
Player A.
This type of insight should impact training prac-
tices. For instance, sprinting exercises for a wide mid-
fielder should contain sprints that are longer and more
straight line. The central midfielder should proba-
bly follow a different run pattern during training with
much shorter sprints and more 180-degree turns. It
is also clear from this example that data alone might
hide important details necessary for evidence-based
coaching.
4 VIDEO INFRASTRUCTURE
Because game statistics and analytics data might con-
tain ambiguities and leave out important informa-
tion, an additional level of information is required
for evidence-based coaching. Video footage of both
games and training is a useful tool in this regard and
we observed that significant volumes of video data re-
lated to TIL players were being generated and stored.
This included exercises filmed by the coaches with
hand held amateur cameras and professional footage
of matches by national and international broadcast-
ers. We also often deploy multiple small, low-cost,
and portable action cameras to capture digital footage
of the physical activities while unfolding. Although
such video content has great value for evidence-based
coaching, we experienced that an available video-
archive, having video data captured by more than 10
cameras with hours of video for each game, made
analysis and retrieval of relevant content very time
consuming and impractical.
4.1 Searching Video Archives
To make the stored video footage more accessible and
useful, we developed the experimental video-search
system Davvi (Johansen et al., 2012a), which enables
users to drill down and search into large stores of mul-
timedia data. Its primary interface is a keyword search
input box, much similar to those already widely used
in web-search systems like Google and Bing. This
enables coaches to submit free text queries like:
“sliding tackle by Thomas Drage Yellow Card”
Additionally, the structural elements like “home-
team=TIL” and “how=heading” can also be used to
refine the query further.
1
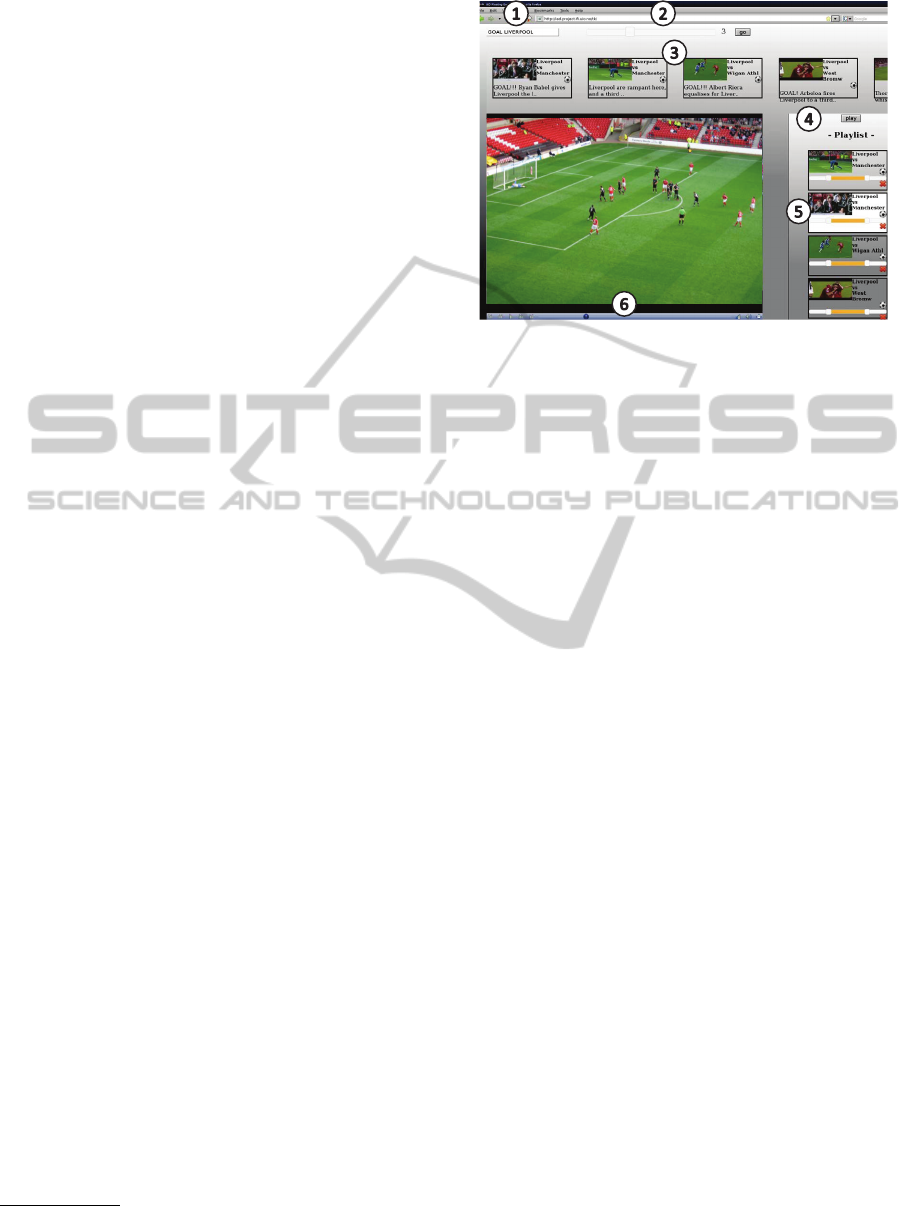
Given such a query, Davvi responds with a list of
matching video events, sorted by their relevance to
the query or by game clock, as shown in Figure 5.
1
See demo video of Davvi here: http://www.youtube.com/
watch?v=cPtvZ2kbt0w
1) Keyword search input box
2) Time constraint for search output
3) Search result list with video and event descriptions
4) Playlist c
ontaining user selected clips
5) Slider for adjusting clip length
6) Control bar for video playback
Figure 5: User interface of the Davvi video retrieval system.
Per user customized videos can then be produced on-
the-fly while searching through enormous amounts of
video data archives. Using for example drag-and-
drop of the search results, a personalized video can
be composed in a playlist where the corresponding
video frames are combined into a video summary.
The search result video clips have a default length
of 30 seconds, but this can be adjusted. The result-
ing composition can be viewed immediately as one
continuous video without having to materialize it on
the server. Such search-based video composition is in
particular a potent tool for non-technical users since it
enables them to access the content through a powerful
yet simple interface.
4.2 Capturing High-level Game Events
A key problem for keyword-based video search sys-
tems like Davvi, is how to annotate the video with tex-
tual meta-data for indexing. There exists a large num-
ber of fully automated annotation tools that can iden-
tify and describe video events using low-level video
features like colors, textures, and shapes using com-
plex visual analysis techniques (Ekin et al., 2003).
The precision of such software tools is, however, not
yet at a sufficient level of quality to reliably cover the
semantic gap between low-level visual features and
high-level concepts for practical use in soccer clubs.
Fortunately, it is also possible to make use of hu-
man generated commentaries at external high-quality
publication sources (Xu et al., 2006). In the sports
domain, numerous Internet news portals, social net-
working groups, and official sports club pages pub-
CombiningVideoandPlayerTelemetryforEvidence-basedDecisionsinSoccer
201
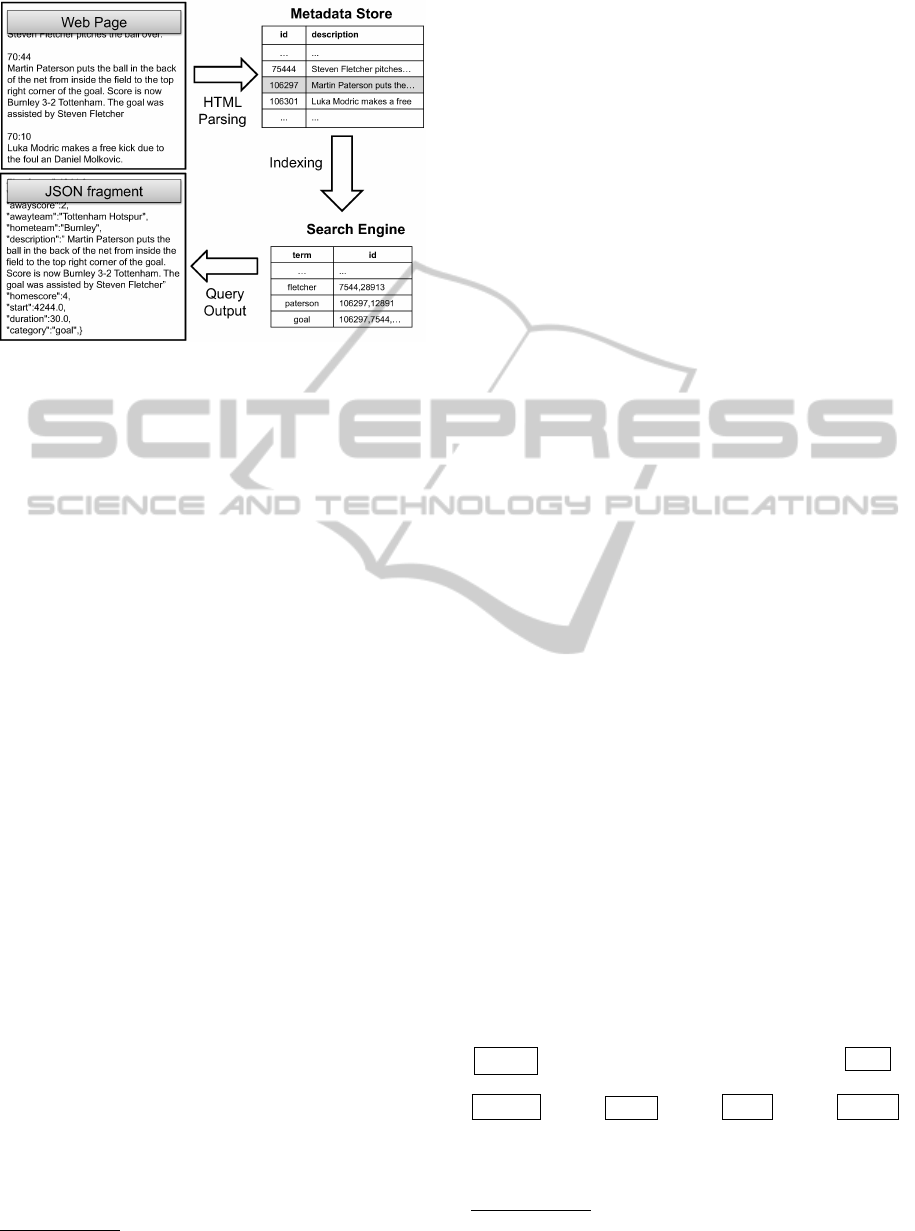
Figure 6: Video annotation using web content in Davvi.
lish time-synchronized and relevant game data, of-
ten close to real-time while the event happens. For
soccer video content, this data typically contains gen-
eral information, like the names of the playing teams,
and where the games are played. More importantly,
it also contains textual information about events that
have occurred within each individual game, like de-
scriptions of each scored goal or penalties, and a time
value for when in the game they occurred.
By configuring Davvi with site specific parses,
such data sources can be crawled for this type of semi-
structured meta-data, as illustrated in Figure 6. The
result is a meta-data store containing time coded tex-
tual descriptions of in-game events, often written by
human experts who are very likely to comments on
just the type of events that coaches and supporters are
likely to later query for. Using the commonly avail-
able Apache Solr search engine
2
, we then construct a
reverse index of the words in the collected textual de-
scriptions, each pointing back to the in-game events it
occurs in. This tool is particularly useful for generat-
ing sequences of short video snippets containing sim-
ilar situations, like when a player makes a free kick,
for comparison and evidence of certain player behav-
ior.
To further reduce the manual labor of accessing
captured videos, we also developed Muithu (Johansen
et al., 2012b), a light weight and portable digital no-
tational analysis system that enables members of the
coaching team, using a tablet or mobile phones, to
register predefined events quickly with the press of a
button or provide textual annotations.
The correlated video can be extracted automati-
cally and shown to the coaches and players. This
either as an immediate playback during a game or a
practice session in an online mode, or in an offline
2
http://lucene.apache.org/solr/
mode like in the half-time break or after the game.
An internal multimedia-based social network is
also used for athlete development and coaching. The
coaches can send, for instance, a video sequence with
comments to a single or group of players starting an
educational and reflective dialogue. The novelty is
that this is done almost fully automatic and in real-
time by the soccer coaches; no retrospective, labor in-
tensive analysis are needed. Because such dialogues
often are centered around specific video events, they
can be a good source for time-coded video meta-data.
This data might, however, be highly personal and we
are therefore investigating security mechanisms that
allow user controlled sharing of such information.
4.3 Player Tracking
Video from professional broadcasters, though of high-
quality, mostly focus on small regions of the soccer
field interesting for the spectator. For coaches, other
areas of the field might be more interesting.
To have complete game video of each player, TIL
had on earlier occasions enlisted 22 people, each
equipped with a hand held camcorder, to follow his
or her designated player throughout the game, gen-
erating a total of more than 1980 minutes of video.
Clearly, such a solution is costly in the long run if
volunteers cannot be enlisted on a regular basis. The
quality of the resulting videos is also not optimal as
accurately tracking a moving soccer player for 90
minutes with a camcorder is difficult.
To automate this process in a reliable manner,
we have developed Bagadus
3
(Sægrov et al., 2012),
which integrates a video camera array with ZXY to
enable real-time video tracking of the players on the
field and with Muithu to automatically play back an-
notated events from the coaching team. The system
makes use of a stationary camera array, as shown in
Figure 7, of several small shutter-synchronized high-
resolution video cameras. These cameras cover the
full field with sufficient overlap to identify common
features necessary for camera calibration and image
stitching. Generating panorama videos in real-time
includes running each captured frame through the fol-
lowing (simplified) pipeline processing stages:
capture store
↓ ↑
debarrel → rotate → stitch → encode
As seen in Figure 7, Bagadus supports several dif-
ferent playback options. One is playback of video that
switches between streams delivered from the different
3
See demo video of Bagadus here: http://www.youtube.com
/watch?v=1zsgvjQkL1E
icSPORTS2013-InternationalCongressonSportsScienceResearchandTechnologySupport
202
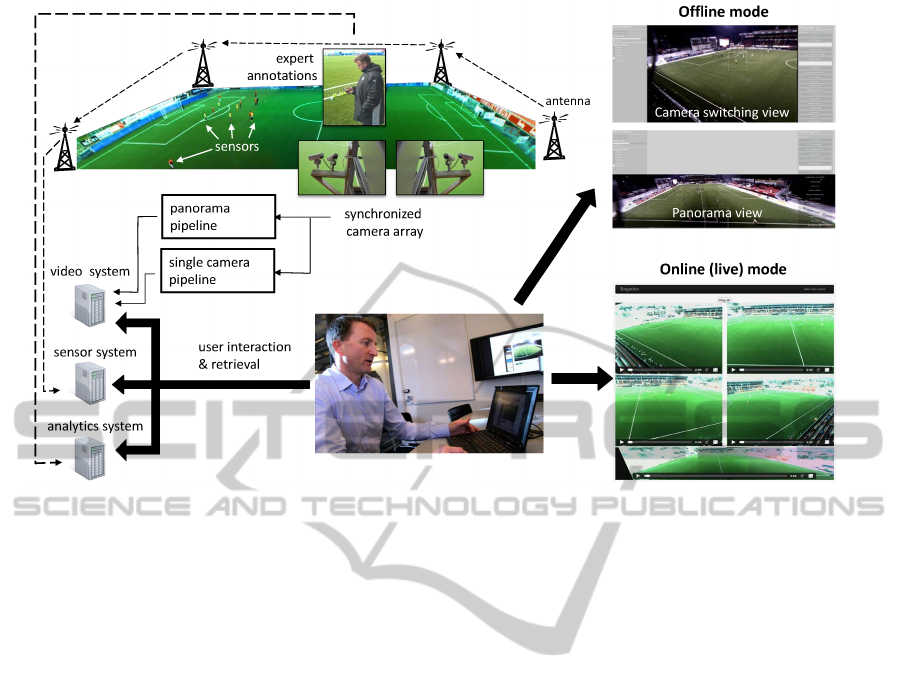
Figure 7: Architectural overview of the Bagadus player tracking system.
cameras, either manually selecting a camera or auto-
matically following players based on sensor informa-
tion. A second option plays back a panorama video
stitched from the different camera feeds.
Tracking people through camera arrays has been
an active research topic for several years. The accu-
racy of such systems has improved, but there are still
errors. To identify and follow players on the field, we
again use the ZXY system to capture the exact posi-
tion of the players, or groups of players. This enables
us to zoom in on and mark player(s) in the retrieved
video on the fly, or to automatically generate a video
following a particular player.
The sensor-video systems integration also enables
automatic extraction of complex video summaries.
For example, we are able to automatically present a
video clip of all the situations where a given player
runs faster than 7ms
−1
, when a defender is closer than
5 meters from an opponent’s striker or when all the
defenders were located in the opponent’s penalty box
in the second half. The last example is supported by a
SQL database query like:
SELECT timestamp, x_pos, y_pos
FROM zxy_oversample
WHERE (y_pos > 17.5 AND y_pos < 50.5) // penalty box
AND (x_pos > 0.0 AND x_pos < 16.5)
AND timestamp > 45 // second half
AND tag_id IN ("the tag_ids of defenders")
This query collects all the timestamps and defender
positions inside the penalty box, and where the times-
tamps are used to select video frames. In the current
system, the video summary starts playing in less than
a second, an operation that without such a retrieval
system would require large amounts of manual work
and time corresponding to at least the time to view the
entire game.
Thus, where people earlier used a huge amount of
time for analyzing the game manually, these software
components in combination with the ZXY system, au-
tomate much tedious manual work freeing time for the
coaches to focus on his or her core activities.
5 DATA SECURITY
A key requirement for TIL was the ability to exter-
nalize collected data to third parties that specialize in
complex sports analytics. The new generation of sport
viewers, familiar with social networks and micro-
blogs, also expect such performance data to be pub-
lished on social media and on more traditional broad-
casting channels while watching sport events. For in-
stance, during the last European soccer championship
in June 2012, major broadcasters distributed real-time
performance data on social media platforms and tra-
ditional television broadcasts while games unfolded.
This included statistics about successful passes, num-
ber of corners, attempted shots on goal, meters cov-
ered by individual players and the like.
We have also developed a system that provides
timely and accurate wellness parameters prior to
practice planning and execution. After each physi-
cal session, all players input their rating of perceived
exertion through their cellular phones. This data is
CombiningVideoandPlayerTelemetryforEvidence-basedDecisionsinSoccer
203

aggregated and compared with expected and planned
intensity level. Next morning, each player further pro-
vides, for instance, their perceived fatigue, soreness,
and sleep quality. This data is immediately inspected
by the medical staff to adjust the training load of the
upcoming training session or to customize practices
for individuals. In some cases, players are pulled
away from the team practice for more detailed med-
ical examination to, for instance, avoid potential in-
juries.
Obviously, there are strong security constraints re-
lated to athlete and team performance data. Med-
ical related information like heart-rate and injuries
are highly personal and must in particular be handled
with great care. Existing infrastructures provide ath-
letes with little control of how such sensitive personal
data is used. The European Commission has already
stated its concern about the lack of user control of per-
sonal data being stored in online services (European
Commission, 2012). This concern must also be ad-
dressed in the next generation of athlete tracking sys-
tems.
Current available mechanisms for discretionary
access control in web and cloud-based Internet ser-
vices are based on a combination of authentication
and Access Control Lists (ACLs) that map principals,
roles, or attributes of principals to a predetermined
set of rights on the recorded athlete data. But these
mechanisms do not support key functions required for
fine-grained user control of personal data, like dele-
gation and confinement of access rights. We experi-
enced that it became difficult to maintain fine grained
control over distribution and access of sensitive player
data. Indeed, some argue that ACLs are not a good
solution at all in service oriented architectures with
transitive access patterns (Karp and Li, 2010). With
ACLs each layer would need to have accounts with
the lower layers, which quickly becomes an unman-
ageable task, and makes it difficult to avoid security
issues like confused deputies (Hardy, 1988).
To address this concern, we are working to inte-
grate codecap (van Renesse et al., 2013), a user-side
access-control mechanism that gives athletes more
control of their personal performance telemetry. A
codecap c
n
is a pair ⟨h
n
, k
n
⟩ consisting of a heritage
and a private key. The heritage h
n
is a chain of X.509
public key certificates [C
1
:: C
2
:: ... :: C
n
] correspond-
ing to a chain of n + 1 principals P
0
...P
n
, where the
operator :: denotes list concatenation. In this case, P
0
has delegated certain rights to P
1
, P
1
, has delegated
rights to P
2
, . . ., and P
n−1
has delegated rights to P
n
.
For example, P
0
could be the soccer club’s data server,
P
1
a player, P
2
the medical staff, P
3
the coach, and so
on.
Certificate C
i
is signed by k
i−1
= P
i−1
.
privkey
,
where k
n
is the private key of P
n
. Codecap c
n
is owned
by principal P
n
and gives access rights to services pro-
vided by principal P
0
. However, as P
0
does not main-
tain ACLs, it does not need to know anything about
P
n
, and only needs to maintain its private key k
0
. In
our case, this implies that player P
1
, without involve-
ment of any system administrator, can delegate access
to his telemetry, for instance to external medical per-
sonnel after an injury.
To confine and control how delegated access
rights can be used, each certificate C
i
includes a
C
i
.
rights
attribute containing a boolean functions
that returns true if and only if the function allows the
request. Currently the rights functions are expressed
in Javascript, enabling a flexible and fine grained con-
trol over rights policies. Principal P
0
will execute the
request r only if C
i
.
rights
(r) = true holds for all i
in 1...n. As such, player P
1
may grant P
2
, the medical
staff, full access to his data, but restrict their ability to
further delegate access to sensitive information, like
the sleep quality data collect by the system described
in Section 4.2. This implies that the coaches P
3
, in our
example above, cannot access this sensitive data from
the access token received from P
2
. He, must receive
explicit permission from P
1
for that.
Using existing ACLs mechanisms, such fine-
grained rights management would quickly become an
unmanageable task, resulting in frequent violation of
the principle of least privilege. As a consequence of
having their data too widely available, players might
be less inclined to adapt new sensor technology and
athlete quantification methods. Giving players con-
trol of their personal data through rights delegation
and confinement chains, is essential for further adap-
tation of evidence-based technology in soccer.
6 CONCLUSIONS
Insight in the soccer domain can be drawn from ap-
plying big-data analytics to in-game player telemetry.
When coupled with video footage of actual matches
and exercises, an important platform for evidence-
based coaching emerges. We are currently research-
ing software algorithms, architectures, and systems
in correlation with the technology applied by TIL,
a Norwegian premier league soccer club, to auto-
mate some of the more tedious aspects of develop-
ing, evolving, and using such performance indicators.
Our unique software and hardware stack ranges from
low-level body sensors, to a hand-held coach notation
system, video analytics, machine learning algorithms,
and player-side data security.
icSPORTS2013-InternationalCongressonSportsScienceResearchandTechnologySupport
204

ACKNOWLEDGEMENTS
This work has been partially funded by The Re-
search Council of Norway, project number 174867
(SFI), and the University of Tromsø in collaboration
with Tromsø Idrettslag (TIL) and ZXY Sport Track-
ing AS. We would in particular like to acknowledge
Vegard Berg-Johansen, Agnar Christensen, and the
players of TIL for their contributions to data acqui-
sition and prototype testing. From the University
of Tromsø Kai-Even Nilssen, Kim-Edgar Sørensen,
Roger Bruun Asp Hansen, and Magnus Stenhaug
have contributed to prototype development and de-
ployment.
REFERENCES
Bangsbo, J., Mohr, M., and Krustrup, P. (2006). Physical
and metabolic demands of training and match-play in
the elite football player. Journal of Sports Sciences,
24(7):665–674. PMID: 16766496.
Bendiksen, M., Pettersen, S. A., Ingebrigtsen, J., Randers,
M. B., Brito, J., Mohr, M., Bangsbo, J., and Krus-
trup, P. (2013). Application of the Copenhagen Soccer
Test in high-level women players—locomotor activi-
ties, physiological response and sprint performance.
Human Movement Science. In press.
Dizikes, P. ( 2013). Sports analytics: a real game-changer.
MIT News March 4, Massachusetts Institute of Tech-
nology.
Ehrlich, M. and Dennison, S. (2012). Adidas and Major
League Soccer announce world’s first smart soccer
league. Press release July 19, Major League Soccer
(MLS), http://pressbox.mlssoccer.com.
Ekin, A., Tekalp, A. M., and Mehrotra, R. (2003). Auto-
matic soccer video analysis and summarization. IEEE
Transactions on Image Processing, 12(7):796–807.
European Commission (2012). Safeguarding privacy in a
connected world a European data protection frame-
work for the 21st century. In COM(2012)9. EUR-Lex.
Hardy, N. (1988). The Confused Deputy (or why capabil-
ities might have been invented). Operating Systems
Review, 22(4).
Johansen, D., Halvorsen, P., Johansen, H., Riiser, H., Gur-
rin, C., Olstad, B., Griwodz, C., Kvalnes,
˚
A., Hurley,
J., and Kupka, T. (2012a). Search-based composition,
streaming and playback of video archive content. Mul-
timedia Tools and Applications, 61(2):419–445.
Johansen, D., Stenhaug, M., Hansen, R. B. A., Christensen,
A., and Høgmo, P.-M. (2012b). Muithu: Smaller foot-
print, potentially larger imprint. In Proc. of 7th Inter-
national Conference on Digital Information Manage-
ment, pages 205–214. IEEE.
Karlberg, J.-O. A. (2013). Machine learning in a sports
context: player classification by spatial turn counting.
Project thesis, University of Tromsø.
Karp, A. H. and Li, J. (2010). Solving the transitive ac-
cess problem for the services oriented architecture.
In Proc. of the 5th IEEE International Conference on
Availability, Reliability and Security, pages 46–53.
Mohr, M., Krustrup, P., Andersson, H., Kirkendal, D., and
Bangsbo, J. (2008). Match activities of elite women
soccer players at different performance levels. Journal
of Strength & Conditioning Research, 22(2):341–349.
Mohr, M., Krustrup, P., and Bangsbo, J. (2003). Match per-
formance of high-standard soccer players with special
reference to development of fatigue. Journal of sports
sciences, 21(7):519–528.
Portas, M. D., Harley, J. A., Barnes, C. A., and Rush, C. J.
(2010). The validity and reliability of 1-Hz and 5-Hz
global positioning systems for linear, multidirectional,
and soccer-specific activities. International Journal of
Sports Physiology and Peformance, 5(4):448–458.
Sægrov, S., Eichhorn, A., Emerslund, J., Stensland, H. K.,
Griwodz, C., Johansen, D., and Halvorsen, P. (2012).
BAGADUS: An integrated system for soccer analy-
sis (demo). In Proc. of the ACM/IEEE International
Conference on Distributed Smart Cameras.
Valter, D. S., Adam, C., Barry, M., and Marco, C. (2006).
Validation of Prozone: A new video-based perfor-
mance analysis system. International Journal of Per-
formance Analysis in Sport, 6(1):108–119.
Valv
˚
ag, S. V., Johansen, D., and Kvalnes.,
˚
A. (2013).
Cogset: A high performance MapReduce engine.
Concurrency and Computation: Practice and Expe-
rience, 25(1):2–23. Special Issue: Combined Special
Issue of MapReduce and its Applications & Advanced
topics on wireless sensor networks.
van Renesse, R., Johansen, H. D., Naigaonkar, N., and Jo-
hansen., D. (2013). Secure abstraction with code ca-
pabilities. In Proc. of the 21st Euromicro International
Conference on Parallel, Distributed, and Network-
Based Processing.
Xu, C., Wang, J., Wan, K., Li, Y., and Duan, L. (2006).
Live sports event detection based on broadcast video
and web-casting text. In Proc. of the 14th annual ACM
international conference on Multimedia.
CombiningVideoandPlayerTelemetryforEvidence-basedDecisionsinSoccer
205
