
Analyzing Intrinsic Motion Textures
Created from Naturalistic Video Captures
Angus Graeme Forbes
1
, Christopher Jette
1
and Andrew Predoehl
2
1
School of Information: Science, Technology, and Arts, University of Arizona, Tucson, U.S.A.
2
Department of Computer Science, University of Arizona, Tucson, U.S.A.
Keywords:
Intrinsic Motion Textures, Psychophysics, Perception, Metrics for Motion, Dynamic Textures.
Abstract:
This paper presents an initial exploration of the plausibility of incorporating subtle motions as a useful modal-
ity for encoding (or augmenting the encoding of) data for information visualization tasks. Psychophysics
research indicates that the human visual system is highly responsive to identifying and differentiating even the
subtlest motions intrinsic to an object. We examine aspects of this intrinsic motion, whereby an object stays in
one place while a texture applied to that object changes in subtle but perceptible ways. We hypothesize that the
use of subtle intrinsic motions (as opposed to more obvious extrinsic motion) will avoid the clutter and visual
fatigue that often discourages visualization designers from incorporating motion. Using transformed video
captures of naturalistic motions gathered from the world, we conduct a preliminary user study that attempts
ascertains the minimum amount of motion that is easily perceptible to a viewer. We introduce metrics which
allow us to categorize these motions in terms of flicker (local amplitude and frequency), flutter (global ampli-
tude and frequency), and average maximum contrast between a pixel and its immediate neighbors. Using these
metrics (and a few others), we identify plausible ranges of motion that might be appropriate for visualization
tasks, either on their own or in conjunction with other modalities (such as color or shape), without increasing
visual fatigue. Based on an analysis of these initial preliminary results, we propose that the use of what we
term “intrinsic motion textures” may be a promising modality appropriate for a range of visualization tasks.
1 INTRODUCTION
Rustling leaves, flickering flames, sunlight sparkling
on water – every day we are continually confronted
with naturalistic motion as we navigate the world.
Information visualization, as a field, examines how
meaning is effectively conveyed through visually-
encoded data. However, dynamic visualizations that
encode data using motion have not been as widely ex-
plored, as motion is generally considered to be too
distracting a modality for representing information
effectively. The human visual system is exception-
ally adept at identifying differences in texture (Em-
rith et al., 2010), and observing both the movement
of objects or the movement within an object (Chalupa
et al., 2004). While far from being fully understood,
a growing body of research indicates the presence of
multiple neurological mechanisms for processing ex-
trinsic motion (the movement of an object) and intrin-
sic motion (local movement within a single object)
(Lu and Sperling, 2001; Nishida et al., 1997). Extrin-
sic and intrinsic motion is also termed “first-order”
or “second-order,” respectively: first-order motion re-
ferring to the perception of a change in luminance
across the visual field; second-order motion referring
instead to the perception of changes in texture or con-
trast. While both types of motion can indicate a global
movement of a single entity, in this paper we examine
the use of second-order motion to indicate motions
within a stationary object. We introduce a method for
transforming real-world motion into abstract motion
textures with subtle motions, which we are calling in-
trinsic motion textures. These transformed video cap-
tures of real-world naturalistic motion allow us to ex-
periment with non-distracting motion without includ-
ing their representational aspects. Through the trans-
formation of, say, the movement of water in a stream,
we are able to capture the motion without directly re-
minding users that they are looking at water. We also
introduce an easy-to-calculate set of metrics to char-
acterize these intrinsic motions. While the vast range
of possible motions makes it rather daunting to at-
tempt to encompass all types of movement via a sin-
gle set of metrics, ours capture the main features of
107
Graeme Forbes A., Jette C. and Predoehl A..
Analyzing Intrinsic Motion Textures Created from Naturalistic Video Captures.
DOI: 10.5220/0004660401070113
In Proceedings of the 5th International Conference on Information Visualization Theory and Applications (IVAPP-2014), pages 107-113
ISBN: 978-989-758-005-5
Copyright
c
2014 SCITEPRESS (Science and Technology Publications, Lda.)
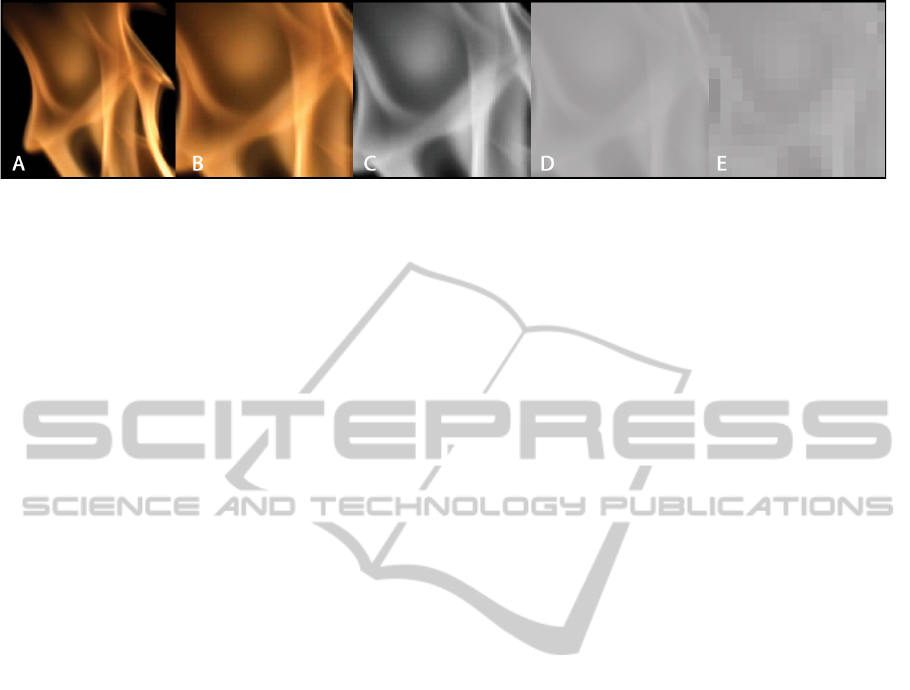
Figure 1: Stages of the video capture of naturalistic motion being transformed into an intrinsic motion texture. Here we show
a single frame (A) as it is (B) cropped, (C) desaturated, (D) contrast-compressed with a low pixel range, and (E) pixelated. A
further step uses temporal smoothing to mitigate extra flickering introduced from the pixelation.
intrinsic motion. We conducted a user study asking
participants to evaluate a set of intrinsic motion tex-
tures. We were primarily interested in gathering in-
sight into the following question – What is the least
amount of motion needed in order to easily identify
differences between highly similar motions? We dis-
covered that even intrinsic motion textures with a low
contrast range are easily distinguishable, as long as
certain amounts of flicker, flutter, and average maxi-
mum contrast (defined below) are present.
In the influential text, “Semiology of Graphics,”
Jacques Bertin introduces a typology of retinal vari-
ables applicable to the communication of informa-
tion. Although explicitly discussing static print me-
dia, Bertin hints at the ability of texture, unlike other
retinal variables, to produce a vibratory effect that is
the “collusion” of physiological and psychological ef-
fects. Although he does not explore this issue of vi-
bratory effects further, he encourages designers “to
make the most of this variation, to obtain the res-
onance without provoking an uncomfortable sensa-
tion, to flirt with ambiguity without succumbing to
it.” Bertin speaks of texture in terms of the vary-
ing thicknesses of lines, points, or shapes to indicate
an overview similarity or differentiation between dif-
ferent qualities, or an ordered-ness within the same
quality. However, he does not believe that the use of
texture is refined enough to allow viewers to perceive
proportionality and therefore is not effective at allow-
ing users to perform quantitative tasks using texture
alone (Bertin, 2010).
Nonetheless, investigations into the use of static
textures in visualization contexts have found that they
can be effective for representing quantitative data in
certain tasks. A seminal paper (Ware and Knight,
1995) uses Gabor patches to parametrically investi-
gate aspects of texture that may be useful in informa-
tion display, such as orientation, size, and contrast.
Applied research introduced in (Kujala and Lukka,
2003) explores the use of a “parameter hierarchy” in
the procedural creation of perceptually distinct tex-
tures for the effective display of information. More
recently, (Byelas and Telea, 2009) uses overlapping
textures to indicate multivariate data in software dia-
grams, explicitly attempting to indicate an increased
number of variables within the diagram. (House et al.,
2006) describes a technique for the perceptual opti-
mization of complex visualizations involving layered
textures. And (Interrante and Kim, 2001) and (Kim
et al., 2004) explore the efficacy of using various ori-
entations and types of textures to facilitate shape per-
ception. These examples are mostly explicitly con-
cerned with the potential expanded range of variables
that can be expressed, while at the same time aware
that the cost of this expanded range might be percep-
tual fatigue or cognitive overload, or worse, an in-
ability to clearly distinguish differences. (Interrante,
2000) examines the use of overlapping naturalistic
textures to indicate multivariate data while mitigating
against the “extraneous stress” that might occur with
synthesized textures. In addition to being a potentially
effective representation of a wide range of quantita-
tive information, the use of certain aspects of natu-
ralistic textures, such as variability, might be used to
indicate extra information, such as uncertainty. Inter-
estingly, recent perceptual experiments, such as (Em-
rith et al., 2010), confirm that humans perceive even
minute alterations in texture, but note that it is in fact
somewhat easier to discern differences between syn-
thetic textures than natural textures.
Motion is often used to signal transitions between
views and contexts, to signal interruptions, and to in-
dicate temporal aspects of data. However, it is less
frequently used as an encoding mechanism for quanti-
tative or qualitative information. (Forbes et al., 2010)
presents a data visualization framework than enables
animation to be mapped to dynamic streams of data,
and (Bostock et al., 2011) describes a framework
that includes “transition” operators for animating data
points. The use of motion in visualization elicits con-
cern about visual clutter and perceptual fatigue, even
while potentially providing an expanded toolset for
representing information. At its most extreme, the in-
judicious use of motion in information might cause
IVAPP2014-InternationalConferenceonInformationVisualizationTheoryandApplications
108

significant visual stress (Ware, 2004). One group
of security researchers (Conti et al., 2005) even de-
scribes the potential for malicious hackers to takeover
an information visualization system and alter its vi-
sual output to induce epileptic seizures.
Results from (Bartram and Ware, 2002) show that
small, brief, and graphically simple extrinsic motions
are perceptually efficient ways to distinguish objects
in a crowded display. In particular, they note that a
synchronization of elements is required in order for
them to be effectively recognized as similar. That is,
the timing of the motion is as important as the mo-
tion itself. Research into extrinsic motion cues, or
“moticons” (Bartram et al., 2003), finds that motion
coding is independent from color and shape coding
and that more subtle motions are less distracting to
users yet easily perceived. A series of experiments
that analyzed extrinsic aspects of motion– velocity,
direction, and on-off blinking– finds that these prop-
erties are all effective at encoding multiple data values
in a prototype astrophysics simulation, provided they
meet certain basic thresholds of perceptibility (Huber
and Healey, 2005). A technique termed “motion high-
lighting” explores the potential applicability of mo-
tion to node-link diagrams (Ware and Bobrow, 2004).
Results of motion highlighting experiments indicate
that the translating or scaling of node is more useful
for supporting rapid interactive queries on node-link
diagrams than static highlighting methods.
Dynamic textures are sequences of images that
exhibit some form of temporal coherence, or more
specifically, they are individual images that are “re-
alizations of the output of a dynamical system driven
by an independent and identically distributed pro-
cess” (Doretto et al., 2003). Dynamic textures have
been effectively used in scientific visualizations and
have been more extensively investigated in computer
graphics and computer vision research. For instance,
(Van Wijk, 2002) uses an iterative series of texture
distortions to represent fluid flows, and (Forbes and
Odai, 2012; Forbes et al., 2013) applies this tech-
nique to creative media arts projects. Work by (Lum
et al., 2003) explores adding moving particles to a
surface texture of a static object in which the parti-
cles are placed along the principal curvature direction
to better indicate the object’s shape and spatial rela-
tionships. Within a more general computer graphics
context, dynamic textures are used in a variety of ap-
plications. For instance, dynamic textures have been
used as a computationally efficient way to add realism
to a scene. (Chuang et al., 2005) presents an interac-
tive system that procedurally generates dynamic tex-
tures from selected components of a single image that
can then be added to a scene. Similarly, a variety of
techniques have been introduced to automatically cre-
ate “temporal textures” from a single image in order
to mimic natural phenomenon such as clouds, water,
and fire (Lai and Wu, 2007; Ruiters et al., 2010; Ok-
abe et al., 2011). In addition to having the potential
to be used as an effective modality for representing
quantitative information, recent research has explored
the use of dynamic textures as a medium for provid-
ing semantically contextualized information. (Lock-
yer et al., 2011) explores the “expressive scope” of
ambient motion textures for “emphasis and more sub-
tle ambient visualization.” In particular, this research
focused on the effective communication of particu-
lar emotions through the use of intrinsic motion cues
within a dynamic texture.
For the most part, research on motion in informa-
tion visualization is concerned with extrinsic motion,
or at least does not differentiate between extrinsic and
intrinsic motion. For instance, (Ware and Bobrow,
2004), also cited above, discusses a motion highlight-
ing technique whereby the animation of a station-
ary link generate a “crawling” motion. Although it
is not presented specifically as a dynamic texture, it
is clear that this “crawling” motion is of a different
nature than the translation patterns used to highlight
nodes. A recent evaluation found that animated rep-
resentations were more effective than almost all static
representations of link representations (Holten et al.,
2011). It seems reasonable that other visualization
systems could utilize a conflation of textures and mo-
tion; rather than attempting to procedurally generate
dynamic textures, we could gather them directly. This
would have the immediate advantage that they were,
at least in some degree, inherently non-distracting for
the simple reason that they occur continually in the
real-world. An earlier (unpublished) study by one of
the authors found that the use of moving sinusoidal
gratings introduced visual fatigue precisely because
of the qualities that made it unrealistic: its fixed ro-
tation, its predictable frequency and amplitude, and
its repetitive sequence of pixel values. instead, Dy-
namic textures using fluctuating, intrinsic, real-world
motion are cohesive without being repetitive; differ-
entiable without being distracting.
In order to expedite the creation of intrinsic mo-
tion textures in order to analyze their potential effec-
tiveness in visualization systems, we gathered real-
world video of natural phenomena containing intrin-
sic motion: fire, water, clouds, etc. Although we be-
lieve that these textures have a representational com-
ponent that might be useful in some visualization cir-
cumstances, for this study we isolated the phenomena
using these steps: (A) record the natural phenomenon;
(B) crop the resulting video; (C) desaturate the video;
AnalyzingIntrinsicMotionTexturesCreatedfromNaturalisticVideoCaptures
109

(D) constrain the pixel range of the video; (E) pixelate
the video; (F) apply temporal smoothing to the video.
The video is thus transformed into a low-contrast, de-
saturated, pixelated, and mostly unrecognizable ver-
sion of itself that nonetheless retains important qual-
ities of the original natural motion. Figure 1 shows
a frame from a naturalistic video as it is processed
through this pipeline. These intrinsic motion textures
can then be defined metrically, in terms of particular
features, and included in studies where we can asso-
ciate these features with empirical observations, such
as discernibility and differentiability.
2 METRIC DEFINITIONS
Much research has been done to develop ways to ef-
fectively and efficiently characterize motion. A com-
monly used method, optical flow, assumes that there
is a unique velocity vector at each pixel. Other meth-
ods relax that assumption. For instance, (Langer and
Mann, 2003) introduces “optical snow,” which is able
to characterize motions that have prevalent disconti-
nuities between frames. The intrinsic motions that
we have gathered likewise include large amounts of
flickering that are not captured with optical flow type
analyses. Since we are, for now, interested primar-
ily in the single task of determining the ease of dis-
crimination betweens motions, we constructed a way
to create simpler metrics that define a video via a set
of eight features that sufficiently characterize intrinsic
motions. They are grouped into the following cate-
gories: flicker, flutter, and variability.
We now introduce notation that defines our met-
rics precisely. Let I
q,t
denote the integer intensity
value of a pixel in the video, at spatial position q
and at time t. Assuming the video pixels lie in a
rectangular grid of width W , height H, and that the
video has duration of T discrete video frames, q ∈
Q = {1, .. .,W } × {1, .. ., H} and t ∈ {1,...,T }. The
first characteristic of interest we define is the contrast
range K of a video:
Definition 1 (Contrast range).
K = max
q∈Q
1≤t≤T
I
q,t
− min
q∈Q
1≤t≤T
I
q,t
.
In the present study, instead of using K as a video
feature for comparison, we partitioned our test videos
into collections with of similar contrast range, be-
cause two videos with widely differing contrasts are
very obviously distinct. Specifically, we gathered
videos with contrast ranges of 20 or less, 21 to 40,
41 to 60, and 61 to 80, into groups called G
20
, G
40
,
G
60
, and G
80
, respectively.
The variability metrics reflect the spatial variation
in a single video frame. Let Q
0
⊂ Q be the set of
pixel positions in the interior of the grid. Each pixel
position q ∈ Q
0
therefore has eight spatially adjacent
neighbors, the set of which we denote N(q). The
roughness R is defined as the average intensity dif-
ference of the highest-contrast neighbors:
Definition 2 (Roughness).
R =
1
W H
·
1
T
∑
q∈Q
0
T
∑
t=1
max
s∈N(q)
|I
q,t
− I
s,t
|.
Edginess E
θ
is the average number of large-
contrast juxtapositions, per pixel, per frame. The con-
trast is regarded as large if the intensity difference is
at least θ:
Definition 3 (Edginess).
E
θ
=
1
W H
·
1
T
∑
q∈Q
0
T
∑
t=1
1
{τ : θ≤max
s∈N(q)
|I
q,τ
−I
s,τ
|}
(t).
In the current study, we set the threshold value θ equal
to one-eighth the maximum contrast range of the rele-
vant collection (G
20
, G
40
, G
60
, or G
80
). For example,
when comparing two videos from group G
40
, we used
the E
40/8
= E
5
edginess metric.
Our flicker metrics depend on the local maxima
and minima (peaks and valleys) of pixel intensity in
the time domain. To specify them formally, we intro-
duce definitions of peak and valley as follows.
Definition 4 (Peak intensity value). I
q,t
is a peak in-
tensity value of width j, provided
• j > 0,
• 1 < t ≤ T − j,
• I
q,t−1
< I
q,t
= I
q,t+1
= ·· · = I
q,t+ j−1
, and
• I
q,t+ j−1
> I
q,t+ j
.
Though cumbersome, this definition is consistent
with an intuitive notion of local maximum. We also
define valley intensity value analogously for local
minima. Let n
q
denote the number of peaks of width
1 or more at position q. Let p
1,q
, p
2,q
,. .. , p
n
q
,q
be the
peak intensity values at position q, such that p
i,q
is the
intensity value of the ith peak, in chronological order.
Similarly, let v
1,q
,v
2,q
,. .. ,v
n
q
,q
denote the valley in-
tensity values (assuming they are equally numerous
as the peaks). Now we can precisely state our met-
rics for flicker. First, the average number of peaks per
pixel, per frame, is called local frequency, F
L
:
Definition 5 (Local frequency).
F
L
=
1
W H
·
1
T
∑
q∈Q
n
q
.
IVAPP2014-InternationalConferenceonInformationVisualizationTheoryandApplications
110

We define the average peak-to-valley difference,
per pixel, as local amplitude, A
L
:
Definition 6 (Local amplitude).
A
L
=
1
W H
∑
q∈Q
1
n
q
n
q
∑
i=1
(p
i,q
− v
i,q
),
if n
q
> 0, otherwise A
L
= 0.
We define local choppiness, C
L,θ
, as the average
number of large intensity jumps per pixel, per frame.
A jump at position q is large if equals or exceeds
threshold value θ.
Definition 7 (Local choppiness).
C
L,θ
=
1
W H
·
1
T
∑
q∈Q
T
∑
t=2
1
{τ : |I
q,τ
−I
q,τ−1
|≥θ}
(t)
Similar to our use of Def. 3, in our study we set
the threshold value here to one-eighth of the contrast
range of whichever videos we are comparing. So
when comparing videos from group G
40
, we use lo-
cal choppiness metric C
L,5
.
Our flutter metrics are similar to the flicker met-
rics, but they depend on the average intensity of the
entire video frame at a given moment. Let J
t
denote
the average pixel intensity of the frame at time t, i.e.,
J
t
=
1
W H
∑
q∈Q
I
q,t
. This sequence also has peaks and
valleys, which we assume are m in number. At the
risk of confusion, we will denote its peak values and
valley values (regardless of width) as p
1
, p
2
,. .. , p
m
and v
1
,v
2
,. .. ,v
m
respectively, in chronological order.
(Note that these values have only one subscript.) The
average number of these peaks, per frame, is called
global frequency, F
G
:
Definition 8 (Global frequency).
F
G
= m/T.
The average of these peak-to-valley differences is
the global amplitude, A
G
:
Definition 9 (Global amplitude).
A
G
=
1
m
m
∑
i=1
(p
i
− v
i
),
if m > 0, otherwise A
G
= 0.
We define global choppiness C
G,θ
as the average
number of large increases in average intensity, with
threshold θ:
Definition 10 (Global choppiness).
C
G,θ
=
1
T
T
∑
t=2
1
{τ : |J
τ
−J
τ−1
|≥θ}
(t).
Again, in our study we set the this metric’s threshold
just as those of Defs. 3 and 7. So, when comparing
videos from group G
40
, we compute metric C
G,5
.
These metrics are easy to calculate and capture
both the global and the local, pixel level aspects of
the videos. They may not however capture larger-
scale movement within the motion textures. However,
since our express aim is to use motion textures that do
not contain large-scale motion, we believe that these
metrics are appropriate as a first attempt to character-
ize intrinsic motions.
3 USER STUDY
The main goal of our preliminary user study was
to determine the minimum amount of movement re-
quired in order for a participant to quickly differen-
tiate between similar motions. Since motion can be
highly distracting and since humans are exception-
ally good at noticing differences in motion, by finding
lower bounds on various parameters that make motion
distinguishable we can identify the minimum values
of easily-discernible features. Future work will use a
more rigorously defined empirical study using tech-
niques to measure just-noticeable difference, as well
as explore user response to visualization tasks incor-
porating motion textures. For this preliminary study
we wanted to obtain an initial sense of what attributes
were most easily noticeable at low-contrast ranges,
and which of these attributes were thought to be the
least distracting.
To find this minimum feature set, we created a
study that presented the participant with a pair of
videos. The user was then asked to indicate whether
he or she agreed or disagreed with a series of state-
ments about the videos. We gathered 32 unique
videos of naturalistic motion and processed them as
described in section 3.1. We created 4 “bins” and
made versions of each of these videos with different
levels of contrast. Bin 1 contained videos with a con-
trast range of +/- 10; Bin 2, +/- 20; Bin 3, +/- 30; Bin
4, +/- 40. For Bin 1, it was very difficult to tell most of
the videos apart, especially when looking at a single
(unmoving) frame from the video. In other words, the
contrast was so low that without movement it would
be almost impossible to tell them apart. For Bin 2,
it seemed that about half of the time it was easy to
tell the videos apart and the other half of the time it
was difficult. For Bin 3, it became much easier to tell
any of the videos apart from any of the others. And
finally, for Bin 4 it was easy to tell all of the videos
apart. However, we thought that if the movements be-
came more chaotic (higher absolute flicker amplitude
AnalyzingIntrinsicMotionTexturesCreatedfromNaturalisticVideoCaptures
111

and frequency) then in those cases the videos in Bin
3 and Bin 4 would be hard to tell apart. We did not
test any of the videos against a video with a different
range of pixel values as it is easy to discern the dif-
ferences in videos when one had a higher maximum
and lower minimum pixel value than the other. Each
of the videos was analyzed with custom software that
output the features described by our metrics system.
We further calculated the absolute difference between
the feature vectors of each video.
We included a series of four Likert items per test
designed to elicit the participant’s opinion about the
discernibility of flicker and frequency. We ran vari-
ous “batches” of our test over the course of a week
and a half on Amazon Mechanical Turk. We received
a total of 144 completed studies. For most of these
batches, we randomly chose one of the 4 bins for each
test. The majority of our “workers,” 107, indicated
that they were from India; 24 were from the United
States; the rest came from the United Kingdom, Mex-
ico, Sri Lanka, Canada, Pakistan, and Nigeria. 2 par-
ticipants chose “Other” as their nationality. There
were an equal number of male and female participants
(72 each). The minimum and maximum age was 19
and 63, respectively, with a median age of 31. Fol-
lowing the suggestions in (Heer and Bostock, 2010),
which describes some of the advantages and disad-
vantages of conducting studies via Mechanical Turk,
we made a substantial effort to encourage reliable par-
ticipation and mitigate inaccurate or random answers,
ultimately obtaining 476 samples from the 144 partic-
ipants.
All features, except for the frequency of the flutter
(the global frequency of a direction change in aver-
age pixel value for a frame) were positively correlated
with easy differentiability. We built a statistical model
to characterize the relationship between the video mo-
tion metrics and the participants’ responses. We fo-
cused on contrast ranges 20 and 40 and modeled the
data as a two-category classification problem: in each
video comparison, the videos are either difficult to
distinguish (category C
D
) or not (category C
E
), gen-
erated by the user’s Likert responses. For our binary
classifier, any value greater than 2 was given a placed
in category C
E
, and any value less than or equal to 2
was placed in category C
D
. Ideally, the model would
effectively predict the category for a video compar-
ison, based only on our video features. We modeled
these two categories by assuming a multivariate Gaus-
sian distribution of the feature vectors (which are the
absolute differences of each of the eight metrics for
the pair of videos being compared). In other words,
we computed the maximum-likelihood mean vector
µ
C,r
and covariance matrix Σ
C,r
of all feature vec-
tors for category C ∈ {C
D
,C
E
}, and contrast range
r ∈ {20, 40}. For the purpose of classification, we also
make use of the empirical frequency of C
D
and C
E
classes, denoted p(C
D
) and p(C
E
). Given a new data
vector x for contrast range r, we would classify it in
category C
D
provided it satisfies p(C
D
|x) > p(C
E
|x),
where by Bayes’ theorem, for C ∈ {C
D
,C
E
},
p(C|x) =
N
x; µ
C,r
,Σ
C,r
p(C)
∑
B∈{C
D
,C
E
}
N
x; µ
B,r
,Σ
B,r
p(B)
.
In the above, N (x; µ,Σ) denotes the probability den-
sity function for the multivariate Gaussian with mean
µ and covariance Σ. One advantage of a Gaussian
characterization is that we can easily marginalize any
subset of features. Thus we can see the average in-
teraction between any two features and can list the
thresholds for the classifier with all other features
marginalized (Table 1). In particular, even small dif-
ferences in flickering (especially in the frequency and
choppiness) at the individual pixel level were the main
predictors of whether or not a video pair was likely to
be easily differentiable.
Table 1: Threshold values between features.
l chop 0.0011901
l amp 0.12419
l freq 0.00081854
g chop 0.048523
g amp 0.037790
g freq 0.0056176
rough 0.57185
edge 0.0033416
4 CONCLUSIONS
This paper presents an initial foray into exploring
the potential usefulness of intrinsic motion textures.
We provide a method for generating cohesive, non-
repetitive, intrinsic motions textures from real-world
video captures; a method for characterizing the fea-
tures of intrinsic motions; a preliminary user study
that indicates minimal differences necessary for dif-
ferentiation between motions; and an analysis of this
study that identifies thresholds on these features. This
initial exploration of motion textures created from
video captures of naturalistic movement seems to in-
dicate that this may be a promising area for future in-
vestigations. Future work will involve the design and
analysis of more rigorous empirical studies to deter-
mine the validity of our claims regarding the notice-
ability and distraction of these types of textures.
IVAPP2014-InternationalConferenceonInformationVisualizationTheoryandApplications
112

REFERENCES
Bartram, L. and Ware, C. (2002). Filtering and brushing
with motion. Information Visualization, 1(1):66–79.
Bartram, L., Ware, C., and Calvert, T. (2003). Moticons:
detection, distraction and task. International Journal
of Human-Computer Studies, 58(5):515–545.
Bertin, J. (2010). Semiology of graphics: diagrams, net-
works, maps, pages 79–81. Esri Press.
Bostock, M., Ogievetsky, V., and Heer, J. (2011). D
3
: Data-
driven documents. IEEE Transactions on Visualiza-
tion and Computer Graphics (TVCG), 17(12):2301–
2309.
Byelas, H. and Telea, A. (2009). Visualizing multivariate
attributes on software diagrams. In Software Mainte-
nance and Reengineering, 2009. CSMR ’09. 13th Eu-
ropean Conference on, pages 335 –338.
Chalupa, L., Werner, J., and of Technology, M. I. (2004).
The visual neurosciences. MIT Press.
Chuang, Y., Goldman, D., Zheng, K., Curless, B., Salesin,
D., and Szeliski, R. (2005). Animating pictures with
stochastic motion textures. ACM Transactions on
Graphics (TOG), 24(3):853–860.
Conti, G., Ahamad, M., and Stasko, J. (2005). Attacking in-
formation visualization system usability overloading
and deceiving the human. In Proceedings of the 2005
symposium on Usable privacy and security, pages 89–
100. ACM.
Doretto, G., Chiuso, A., Wu, Y. N., and Soatto, S. (2003).
Dynamic textures. International Journal of Computer
Vision, 51:91–109. 10.1023/A:1021669406132.
Emrith, K., Chantler, M., Green, P., Maloney, L., and
Clarke, A. (2010). Measuring perceived differences in
surface texture due to changes in higher order statis-
tics. JOSA A, 27(5):1232–1244.
Forbes, A. G., H
¨
ollerer, T., and Legrady, G. (2010). Be-
haviorism: A framework for dynamic data visualiza-
tion. IEEE Transactions on Visualization and Com-
puter Graphics (TVCG), 16(6):1164–1171.
Forbes, A. G., H
¨
ollerer, T., and Legrady, G. (2013). Genera-
tive fluid profiles for interactive media arts projects. In
Proceedings of the International Symposium on Com-
putational Aesthetics in Graphics, Visualization, and
Imaging (CAe), pages 123–129, Anaheim, California.
Forbes, A. G. and Odai, K. (2012). Iterative synaesthetic
composing with multimedia signals. In Proceed-
ings of the International Computer Music Conference
(ICMC), pages 573–578, Ljubjiana, Slovenia.
Heer, J. and Bostock, M. (2010). Crowdsourcing graphical
perception: using mechanical turk to assess visualiza-
tion design. In ACM Human Factors in Computing
Systems (CHI), pages 203–212. ACM.
Holten, D., Isenberg, P., van Wijk, J., and Fekete, J. (2011).
An extended evaluation of the readability of tapered,
animated, and textured directed-edge representations
in node-link graphs. In Pacific Visualization Sympo-
sium (PacificVis), 2011 IEEE, pages 195 –202.
House, D., Bair, A., and Ware, C. (2006). An approach
to the perceptual optimization of complex visualiza-
tions. IEEE Transactions on Visualization and Com-
puter Graphics (TVCG), 12(4):509–521.
Huber, D. and Healey, C. (2005). Visualizing data with
motion. In Proceedings of IEEE Visualization (VIS),
pages 527–534.
Interrante, V. (2000). Harnessing natural textures for multi-
variate visualization. Computer Graphics and Appli-
cations, IEEE, 20(6):6 –11.
Interrante, V. and Kim, S. (2001). Investigating the effect
of texture orientation on the perception of 3d shape.
In Human Vision and Electronic Imaging VI, volume
4299, pages 330–339.
Kim, S., Hagh-Shenas, H., and Interrante, V. (2004). Con-
veying shape with texture: Experimental investiga-
tions of texture’s effects on shape categorization judg-
ments. IEEE Transactions on Visualization and Com-
puter Graphics (TVCG), 10(4):471–483.
Kujala, J. and Lukka, T. (2003). Rendering recognizably
unique textures. In Information Visualization, 2003.
IV 2003. Proceedings. Seventh International Confer-
ence on, pages 396–405. IEEE.
Lai, C. and Wu, J. (2007). Temporal texture synthe-
sis by patch-based sampling and morphing interpola-
tion. Computer Animation and Virtual Worlds, 18(4-
5):415–428.
Langer, M. S. and Mann, R. (2003). Optical snow. Interna-
tional Journal of Computer Vision, 55(1):55–71.
Lockyer, M., Bartram, L., and Riecke, B. (2011). Simple
motion textures for ambient affect. In Proceedings of
the International Symposium on Computational Aes-
thetics in Graphics, Visualization, and Imaging, pages
89–96. ACM.
Lu, Z. and Sperling, G. (2001). Three-systems theory of
human visual motion perception: review and update.
JOSA A, 18(9):2331–2370.
Lum, E., Stompel, A., and Ma, K. (2003). Using motion to
illustrate static 3d shape-kinetic visualization. IEEE
Transactions on Visualization and Computer Graph-
ics (TVCG), 9(2):115–126.
Nishida, S., Ledgeway, T., and Edwards, M. (1997). Dual
multiple-scale processing for motion in the human vi-
sual system. Vision research, 37(19):2685–2698.
Okabe, M., Anjyor, K., and Onai, R. (2011). Creat-
ing fluid animation from a single image using video
database. In Computer Graphics Forum, volume 30,
pages 1973–1982. Wiley Online Library.
Ruiters, R., Schnabel, R., and Klein, R. (2010). Patch-
based texture interpolation. Computer Graphics Fo-
rum, 29(4):1421–1429.
Van Wijk, J. (2002). Image based flow visualization. ACM
Transactions on Graphics (TOG), 21(3):745–754.
Ware, C. (2004). Information visualization: Perception for
design, volume 22. Morgan Kaufmann.
Ware, C. and Bobrow, R. (2004). Motion to support
rapid interactive queries on node–link diagrams. ACM
Transactions on Applied Perception (TAP), 1(1):3–18.
Ware, C. and Knight, W. (1995). Using visual texture for
information display. ACM Transactions on Graphics
(TOG), 14(1):3–20.
AnalyzingIntrinsicMotionTexturesCreatedfromNaturalisticVideoCaptures
113
