
Floor Plan Generation and Room Labeling of Indoor Environments from
Laser Range Data
Eric Turner and Avideh Zakhor
Department of Electrical Engineering and Computer Sciences, University of California, Berkeley, CA, U.S.A.
Keywords:
Floor Plan, Watertight Modeling, Range Data, LiDAR.
Abstract:
Automatic generation of building floor plans is useful in many emerging applications, including indoor naviga-
tion, augmented and virtual reality, as well as building energy simulation software. These applications require
watertight models with limited complexity. In this paper, we present an approach that produces 2.5D extruded
watertight models of building interiors from either 2D particle filter grid maps or full 3D point-clouds captured
by mobile mapping systems. Our approach is to triangulate a 2D sampling of wall positions and separate these
triangles into interior and exterior sets. We partition the interior volume of the building model by rooms, then
simplify the model to reduce noise. Such labels are useful for building energy simulations involving thermal
models, as well as for ensuring geometric accuracy of the resulting 3D model. We experimentally verify the
performance of our proposed approach on a wide variety of buildings. Our approach is efficient enough to be
used in real-time in conjunction with Simultaneous Localization and Mapping (SLAM) applications.
1 INTRODUCTION
Indoor building modeling and floor plan generation
are useful in many fields such as architecture and civil
engineering. Green buildings and sustainable con-
struction have increased the use of building energy
simulation and analysis software, requiring building
geometry as input. Even though existing energy simu-
lation tools can accurately model the thermodynamic
properties of building interiors, their performance is
hindered by overly complex geometry models (Craw-
ley et al., 2000). Indoor models can also be used
for positioning in wide-area augmented reality appli-
cations, whereby low-complexity models enable low
memory use for mobile client-side processing.
In this paper, we present a technique for gener-
ating aesthetically pleasing, minimalist 2.5D models
of indoor building environments. Such models are in-
tended to capture the architectural elements of a build-
ing such as floors, walls, and ceilings while ignoring
transient objects such as furniture. We generate our
models by first computing a 2D floor-plan of the en-
vironment, then using estimated height information to
extrude the floor-plan into a 3D building model.
Generating 3D models by extruding 2D floor-
plans typically yield clean and aesthetically pleasing
results. Even though such models may not capture the
fine details of the environment, they still offer many
advantages. As shown later, it is possible to gener-
ate sizable 2.5D extruded models at real-time speeds,
enabling human operators to capture and navigate en-
vironments thoroughly and adaptively.
We also propose a technique to partition the inte-
rior environment rooms, yielding secondary features
of buildings, such as locations of doorways. Room
labeling is useful for many applications, such as fast
rendering of models (Funkhouser et al., 1992). Fur-
thermore, since energy simulation engines model heat
and air flow within the building environment, they
need accurate partitions of the interior spaces to rep-
resent distinct thermal zones (Crawley et al., 2000).
In addition to exporting room labels, our proposed
technique uses the computed labels to further improve
the geometry of the model. Specifically, knowledge
of room partitions can be exploited to reduce noise
in the computed geometry while preserving fine de-
tails in doorways. Furthermore, since input height es-
timates are often noisy, using room labels to group
these heights can provide substantial error reduction
in the resulting extruded 3D meshes.
This paper is organized as follows. In Section 2,
we describe related work to this research. Section 3
describes our proposed algorithm to generate floor
plans from the specified input. In Section 4, we de-
scribe our approach to room labeling. In Section 5,
we show how room labeling is used to reduce noise
22
Turner E. and Zakhor A..
Floor Plan Generation and Room Labeling of Indoor Environments from Laser Range Data.
DOI: 10.5220/0004680300220033
In Proceedings of the 9th International Conference on Computer Graphics Theory and Applications (GRAPP-2014), pages 22-33
ISBN: 978-989-758-002-4
Copyright
c
2014 SCITEPRESS (Science and Technology Publications, Lda.)

in the model. Section 6 describes how 2D floor plans
are extruded into 2.5D models with height informa-
tion. Section 7 demonstrates experimental results on
a wide variety of building models. Lastly, in Section 8
we describe potential future work in this area.
2 BACKGROUND
Modeling and navigation of indoor environments is a
well-studied field. Due to cost of full 3D laser range
finders, the majority of indoor modeling systems use
2D LiDAR scanners. Examples of such systems in-
clude autonomous unmanned vehicles (Shen et al.,
2011; Brunskill et al., 2007) or systems worn by a hu-
man operator (Chen et al., 2010; Fallon et al., 2012).
Most simultaneous localization and mapping
(SLAM) systems use a horizontally-oriented 2D Li-
DAR scanner, which estimates the trajectory of the
system, creating a 2D map of the environment (Thrun
et al., 2005). The constructed 2D grid map is stored
as a set of points in R
2
that represent the primary
features of the environment, such as walls and build-
ing architecture. Particle filtering approaches to local-
ization typically result in real-time mapping (Hahnel
et al., 2003; Grisetti et al., 2007) and can therefore
benefit from a real-time floor plan generation algo-
rithm that delivers a live map of the environment.
These mapping systems can also use additional
scanners to create a dense 3D point-cloud representa-
tion of the environment geometry (Smith et al., 2011;
Kua et al., 2012), which can be used to develop full
3D models (Chauve et al., 2010; Holenstein et al.,
2011). Many applications are unable to use these 3D
models due to their complexity and number of ele-
ments. For example, building energy simulations re-
quire watertight meshes that are also highly simplified
in order to perform effectively (Crawley et al., 2000).
To address this issue, a number of simplified
building modeling algorithms have been developed,
most of which assume vertical walls, rectified rooms,
and axis-alignment (Xiao and Furukawa, 2012). Un-
der these assumptions, fundamental features of the
building can be identified, while ignoring minor de-
tails such as furniture or other clutter (Adan and Hu-
ber, 2011). One of the major limitations of these
techniques is that they are developed only for axis-
aligned models. Often, such techniques correctly re-
construct major rooms while fundamentally changing
the topology of minor areas, such as ignoring door-
ways, shapes of rooms, or small rooms entirely.
In this paper, we show that simple models can be
generated with only 2.5D information, while preserv-
ing connectivity and geometry of building features,
including doorways. Our approach generates a 2D
floor plan of the building, then uses wall height infor-
mation to generate a 3D extrusion of this floor plan.
Such blueprint-to-model techniques have been well-
studied (Or et al., 2005; Lewis and Sequin, 1998),
but rely on the original building blueprints as input.
Our technique automatically generates the floor plan
of the building and uses this information to create a
2.5D model of the environment.
Prior work on automatic floor plan generation use
dense 3D point-clouds as input, and take advantage of
the verticality of walls to perform histogram analysis
to sample wall position estimates (Okorn et al., 2009;
Turner and Zakhor, 2012), which are in the same for-
mat as a grid map for particle filtering (Grisetti et al.,
2005). In situations where dense 3D point-clouds are
available, we apply similar techniques to convert them
to a 2D wall sampling.
A novel contribution of this paper is the use of
room labeling to enhance building models, e.g. for
thermal simulations of interior environments (Craw-
ley et al., 2000). One motivation for existing work has
been to capture line-of-sight information for fast ren-
dering of building environments (Funkhouser et al.,
1992). This technique requires axis-aligned rectilin-
ear building geometry, which often is not a valid as-
sumption. Others have partitioned building environ-
ments into submap segments with the goal of efficient
localization and tracking (Brunskill et al., 2007). This
approach is meant to create easily recognizable sub-
sections of the environment, whereas our proposed
room labeling technique uses geometric features to
capture semantic room definitions for both architec-
tural and building energy simulation applications.
3 FLOOR PLAN GENERATION
In this section, we present a technique to automati-
cally generate accurate floor plan models at real-time
speeds for indoor building environments. Section 3.1
describes the type of input for our approach, which
can be generated from either 2D mapping systems
or dense 3D point-clouds of environments. In Sec-
tion 3.2, we discuss the way these input data are used
to compute the interior space of the 2D floor-plan,
which defines the resultant building geometry.
3.1 Input Data
The input data used during floor plan generation con-
sist of points in the (x,y) horizontal plane, which
we call wall samples. These points depict loca-
tions of walls or vertical objects in the environ-
FloorPlanGenerationandRoomLabelingofIndoorEnvironmentsfromLaserRangeData
23
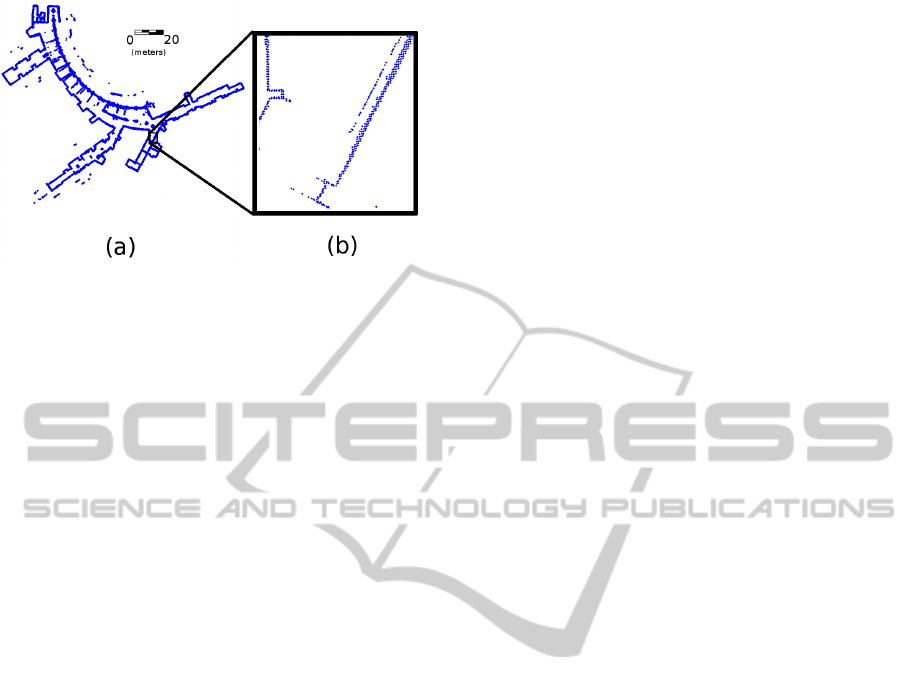
Figure 1: Example input wall samples of hotel hallways
and lobby generated from a particle filter system. (a) Wall
samples of full model; (b) close up of wall in model.
ment. We assume that interior environments satisfy
“2.5-Dimensional” geometry: all walls are vertically
aligned, while floors and ceilings are perfectly hori-
zontal. In many application scenarios only 2D scan-
ners operating in one plane are used, so this assump-
tion is needed to extract 3D information about the en-
vironment. Many mapping systems use a horizontal
LiDAR scanner to estimate a map of the area as a set
of wall sample positions, while refining estimates for
scanner poses. These mobile mapping systems often
have additional sensors capable of estimating floor
and ceiling heights at each pose (Chen et al., 2010;
Shen et al., 2011). The input to our algorithm is a
set of 2D wall samples, where each sample is associ-
ated with the scanner pose that observed it, as well as
estimates of the floor and ceiling heights at the wall
sample location.
An alternate method of computing wall samples is
to subsample a full 3D point-cloud to a set of repre-
sentative 2D points (Turner and Zakhor, 2012; Okorn
et al., 2009). This process cannot be done in a stream-
ing fashion, but can provide more accurate estimates
for wall positions than a real-time particle filter. Such
an approach is useful when representing dense, highly
complex point clouds with simple geometry. Under
the 2.5D assumption of the environment, wall sam-
ples can be detected by projecting 3D points onto the
horizontal plane. Horizontal areas with a high density
of projected points are likely to correspond to vertical
surfaces. Wall samples are classified by storing these
projected points in a quadtree structure with resolu-
tion r. A resolution of 5 cm typically results in suffi-
cient detail in even the most cluttered environments.
Each leaf node in this quadtree contains the 3D points
that are projected onto its r × r area. A vertical his-
togram is computed using the original heights of these
points. This histogram has bin-size r, and if a suf-
ficient vertical coverage H is represented by at least
ceil(H/r) bins, then the average (x,y) position of
the leaf is considered a wall sample. The value of H
may vary depending on application, but a length of 2
meters works well to capture permanent wall features
while ignoring furniture and other interior clutter.
The result is a set of wall samples P ⊆ R
2
, where
each wall sample p ∈ P is represented by its 2D po-
sition, the minimum and maximum height values of
the points that sample represents, and the poses of
the scanners that observed the sample location. As
we discuss later, these scanner poses provide crucial
line-of-sight information that facilitate floor plan re-
construction. An example of such input for a hotel
hallway is shown in Figure 1. As shown, even though
the walls are well sampled, noise in the localization
estimate causes noisy wall samples with outliers.
3.2 Triangulation
We generate a floor plan by partitioning space into in-
terior and exterior domains. The interior represents
all open space in the environment, such as rooms and
hallways, while the exterior represents all space out-
side of the building, space occupied by solid objects,
or space that is unobservable. Once this partitioning
is completed, as described below, the boundary lines
between the interior and exterior are used to represent
the exported walls of the floor plan.
The input samples are used to define a volumetric
representation by generating a Delaunay Triangula-
tion on the plane. Each triangle is labeled either in-
terior or exterior by analyzing the line-of-sight infor-
mation of each wall sample. Initially, all triangles are
considered exterior. Each input wall sample, p ∈ P,
is viewed by a set of scanner positions, S
p
⊆ R
2
. For
every scanner position s ∈ S
p
, the line segment (s, p)
denotes the line-of-sight occurring from the scanner
to the scanned point during data collection. No solid
object can possibly intersect this line, since otherwise
the scan would have been occluded. Thus, all trian-
gles intersected by the line segment (s, p) are rela-
beled to be interior.
In order to prevent fine details from being re-
moved, we check for occlusions when carving each
line segment (s, p). If another wall sample p
0
is lo-
cated in between the positions of s and p, then the
line segment is truncated to (s, p
0
). Thus, no features
captured by wall samples are ever fully carved away,
preserving environment details. This process carves
away the interior triangles with each captured scan.
Since these scans are captured on a mobile scanner,
the scanner poses are ordered in time. In order for
the system to traverse the environment, the line seg-
ment between adjacent scanner poses must also in-
tersect only interior space. In addition to carving via
GRAPP2014-InternationalConferenceonComputerGraphicsTheoryandApplications
24
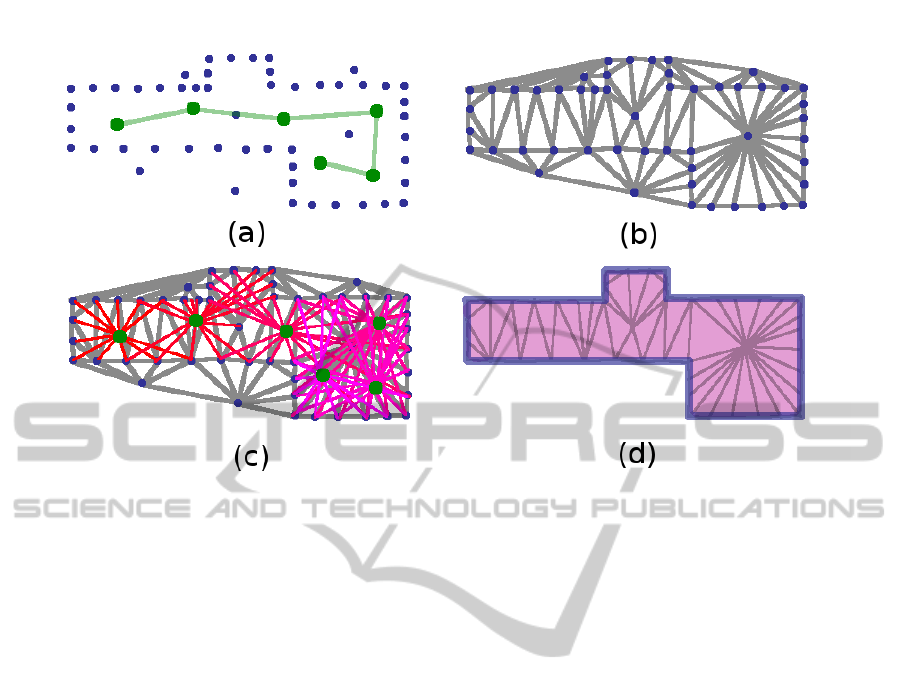
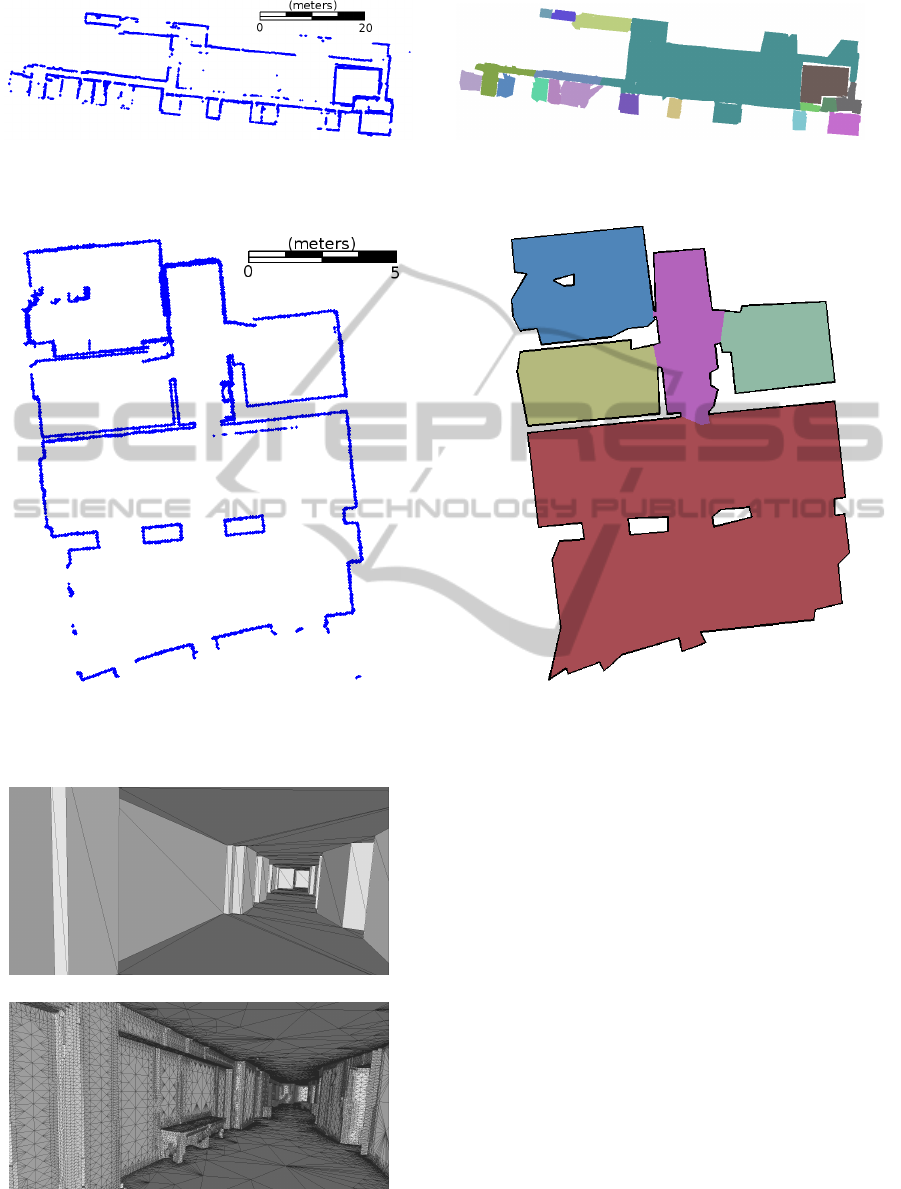
Figure 2: Example of carving process to find interior triangles: (a) wall samples (in blue) with path of scanner (in green); (b)
Delaunay Triangulation of wall samples; (c) laser scans from each pose (in red); (d) triangles that intersect with laser scans
(in pink), used as interior triangles, with building model border (in blue).
scanner-to-scan lines, the same carving process is per-
formed with scanner-to-scanner line segments.
Figure 2 demonstrates an example of this process.
Figure 2a shows the input wall samples, in blue, as
well as the path of the mobile mapping system, in
green. These points are triangulated, as shown in Fig-
ure 2b. The line-of-sight information is analyzed from
each pose of the system, demonstrated by the laser
scans from each pose to its observed wall samples in
Figure 2c. The subset of triangles that are intersected
by these laser scans are considered interior. The inte-
rior triangles are shown in pink in Figure 2d, denot-
ing the interior volume of the reconstructed building
model. The border of this building model is shown in
blue, denoting the estimated walls of the floor plan.
4 ROOM LABELING
Once the volume has been partitioned into interior
and exterior domains, the boundary between these do-
mains can be exported as a valid floor plan of the en-
vironment. Keeping volumetric information can also
yield useful information, such as a partitioning of the
interior into separate rooms.
We define a room to be a connected subset of the
interior triangles in the building model. Ideally, a
room is a large open space with small shared bound-
aries to the rest of the model. Detected rooms should
match with real-world architecture, where separations
between labeled rooms are located at doorways in the
building. Since doors are often difficult to detect, or
not even present, there is no strict mathematical def-
inition for a room, so this labeling is heuristic in na-
ture.
We model room labeling as a graph-cut problem.
First, a rough estimate for the number of rooms and a
seed triangle for each room is computed. A seed tri-
angle is representative of a room, where every room
to be modeled has one seed triangle. These seeds
are used to partition the remainder of interior trian-
gles into rooms. This process typically over-estimates
the number of rooms, so prior knowledge of architec-
tural compliance standards is used to evaluate each
estimated room geometry. Using this analysis, the
number of ill-formed rooms is reduced, providing an
update on the original seed points. This process is
repeated until the set of room seeds converges.
4.1 Forming Room Seeds
We use the Delaunay property of the triangulation
to identify likely seed triangle locations for room la-
bels. If we assume that the input wall samples repre-
sent a dense sampling of the building geometry, this
property implies that the circumcircles of none of the
interior triangles intersect the boundary walls of the
carved floor plan, forcing these circles to represent
only interior area. This make-up allows each trian-
gle’s circumradius to provide an estimate of the local
FloorPlanGenerationandRoomLabelingofIndoorEnvironmentsfromLaserRangeData
25
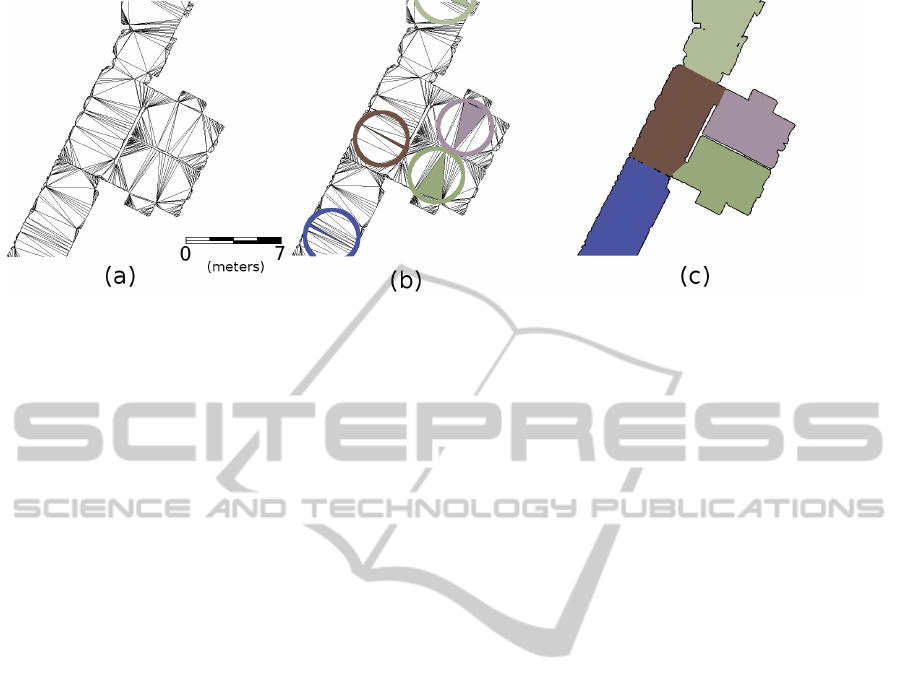
Figure 3: Example room seed partitioning: (a) interior triangulation; (b) the room seed triangles, and their corresponding
circumcircles; (c) room labels propagated to all other triangles.
feature size at its location on the floor plan bound-
ary polygon. Given the example interior triangulation
shown in Figure 3a, the highlighted triangles in Fig-
ure 3b show the chosen seed locations.
Triangles with larger circumradii are likely to be
more representative of their rooms than those with
smaller circumradii. We form the initial set of room
seeds by finding all triangles whose circumcircles are
local maxima. Specifically, given the set of interior
triangles T , each triangle t ∈ T has circumcircle c
t
,
which is tested against every other circumcircle in T
that is intersected by c
t
. If c
t
has the largest radius
of any intersecting circumcircle, then t is considered
a seed for the room labeling. This process selects the
largest triangles that encompass the space of rooms as
the seeds for room labeling. Figure 3b shows example
seed triangles and their corresponding circumcircles.
The result is an estimate of the number of rooms and
a rough location for each room.
4.2 Partitioning Room Labels
Let K be the number of room seeds found, with the
seed triangles denoted as t
1
, t
2
, ..., t
K
. We wish to par-
tition all triangles in T into K rooms. This step can be
performed as a graph-cut on the dual of the triangu-
lation. Specifically, each triangle t ∈ T is a node in
the graph, and the edge weight between two abutting
triangles is the length of their shared side. Performing
a min-cut on this graph partitions rooms to minimize
inter-room boundary length. In other words, rooms
are defined to minimize the size of doors. This pro-
cess propagates the room labels to every triangle, and
the boundaries between rooms are composed of only
the smallest edges in the triangulation T . The result
of this process is shown in Figure 3c.
4.3 Refining Rooms
Room labels partition T into a set of rooms R =
{R
1
, R
2
, ..., R
K
}, where each room R
i
contains a dis-
joint subset of T and has seed triangle t
i
. The initial
room seeds over-estimate the number of rooms, since
a room may have multiple local maxima. This case is
especially true for long hallways, where the assump-
tion that one triangle dominates the area of the room is
invalid. An example is shown in Figure 3c, where two
lower rooms, shown in green and purple, are prop-
erly labeled, but their adjoining hallway is broken into
three subsections. The solution is to selectively re-
move room seeds and redefine the partition.
A room is considered a candidate for merging if
it shares a large perimeter with another room. Ide-
ally, two rooms sharing a border too large to be a door
should be considered the same room. By Americans
with Disabilities Act Compliance Standards, a swing-
ing door cannot exceed 48 inches in width (ADA,
1990). Accounting for the possibility of double-
doors, we use a threshold of 2.44 meters, or 96 inches,
when considering boundaries between rooms. If two
rooms share a border greater than this threshold, then
the seed triangle with the smaller circumradius is dis-
carded. This process reduces the value of K, the num-
ber of rooms, while keeping the interior triangulation
T unchanged. With a reduced set of room seeds, ex-
isting room labels are discarded and the process of
room partitioning is repeated. This iteration repeats
until the room labeling converges.
Another way room labels are refined is by com-
paring the path of the mobile mapping system to the
current room labeling for each iteration. The mobile
scanning system does not necessarily traverse every
room, and may only take superficial scans of room ge-
ometry passing by a room’s open doorway. Since the
room is not actually entered, the model is unlikely to
GRAPP2014-InternationalConferenceonComputerGraphicsTheoryandApplications
26
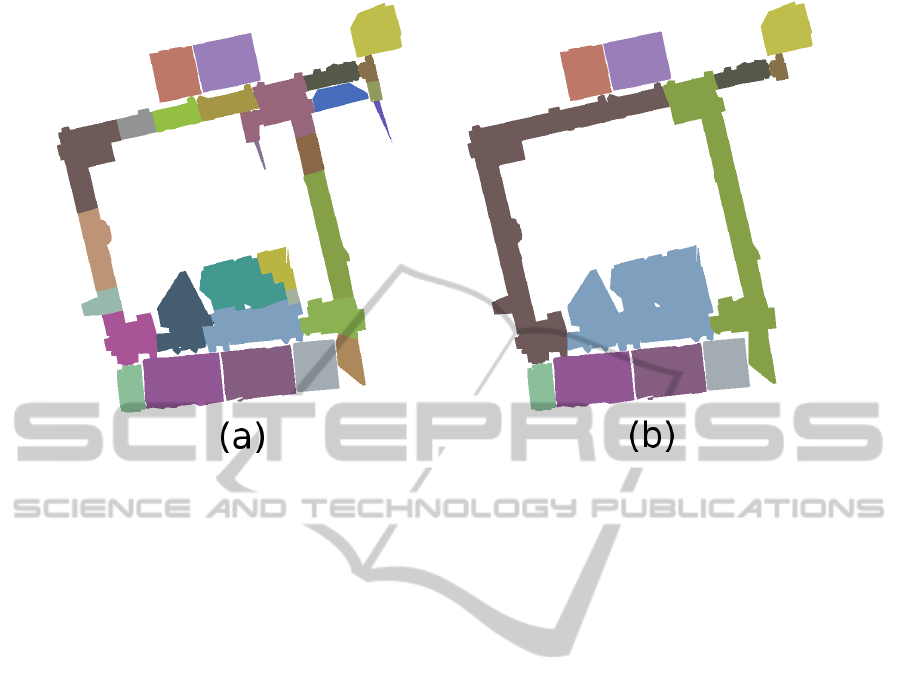
Figure 4: Room labeling refinement example: (a) initial room labels; (b) converged room labels.
capture sufficient geometry, and so only a small hand-
ful of wall samples are acquired for such a room. It
is desirable to remove this poorly scanned area from
the model rather than keeping it as part of the out-
put. After each round of room partitioning, if none
of the triangles in a room R
i
are intersected by the
scanner’s path, then we infer that room has not been
entered. The elements of R
i
are removed from the in-
terior triangulation T . Since the topology of the build-
ing model is changed, the set of room seeds is recom-
puted in this event and room labeling is restarted. This
process will also remove areas that are falsely identi-
fied as rooms, such as ghost geometry generated by
windows and reflective surfaces, which cause rooms
to be replicated outside the actual model.
Figure 4 shows an example of the room refine-
ment process for the hallways and classrooms in an
academic building. Figure 4a shows the initial room
seeds that were found based on circumcircle analy-
sis of Section 4.1. The hallways of this building are
represented by several room labels, but after room la-
bel refinement as shown in Figure 4b, the hallways
are appropriately classified. Additionally, rooms that
are insufficiently scanned and represented with trian-
gulation artifacts are removed from the model in the
manner described above.
5 SIMPLIFICATION
The interior building model is represented as a trian-
gulation of wall samples, which densely represent the
building geometry. In many applications, it is use-
ful to reduce the complexity of this representation, so
that each wall is represented by a single line segment.
This step is often desirable in order to attenuate noise
in the input wall samples or to classify the walls of a
room for application-specific purposes. The goal is to
simplify the wall geometry while preserving the gen-
eral shape and features of the building model.
We opt to simplify walls using a variant of
QEM (Garland and Heckbert, 1997). Since this mesh
is in the plane, only vertices incident to the model
boundary are considered for simplification. The error
matrix Q
v
of each boundary vertex v is used to com-
pute the sum of squared displacement error from each
adjoining line along the boundary polygon. Since er-
ror is measured via distance away from a line in 2D,
each Q
v
has size 3 × 3, and is defined as:
Q
v
=
∑
l∈lines(v)
E
l
(1)
where E
l
is defined from the line equation ax +
by + c = 0, with a
2
+ b
2
= 1:
E
l
=
a
2
ab ac
ab b
2
bc
ac bc c
2
(2)
The simplification of the boundary proceeds in a
similar manner to QEM, but if a wall vertex v is con-
tained in multiple rooms or if it is connected by an
edge to a vertex that is contained in multiple rooms,
then it is not simplified. This constraint is used to
preserve the fine details of doorways between rooms,
while freely simplifying walls that are fully contained
within one room. Wall edges are iteratively simplified
FloorPlanGenerationandRoomLabelingofIndoorEnvironmentsfromLaserRangeData
27
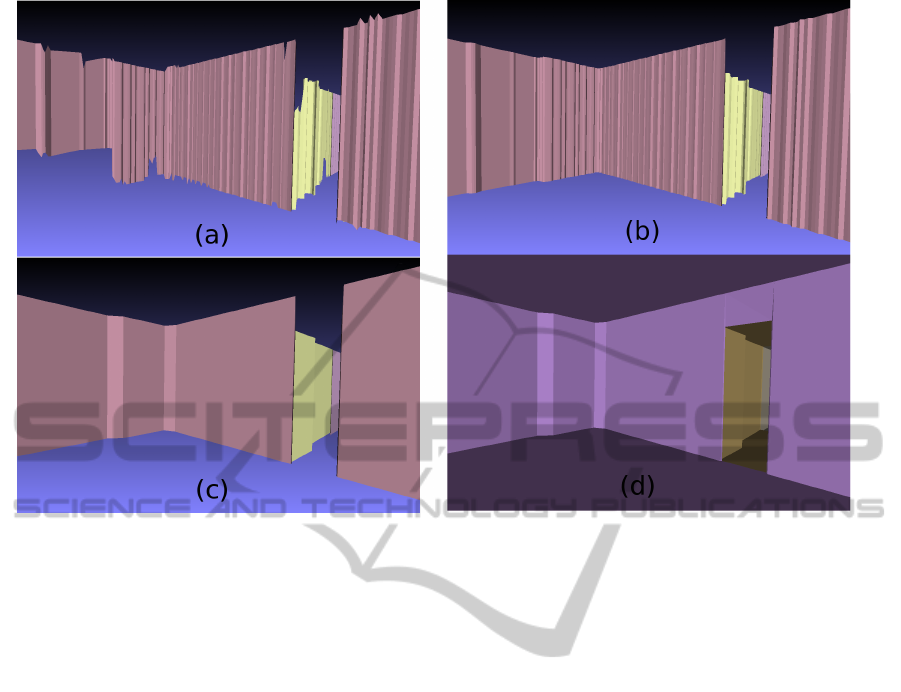
Figure 5: Example of creating a 3D extruded mesh from 2D wall samples: (a) walls of generated floor plan with estimated
height ranges; (b) floor and ceiling heights are grouped by room; (c) simplification performed on walls; (d) floor and ceiling
triangles added to create a watertight mesh.
until no simplification produces error of less than the
original wall sampling resolution, r. Thus, walls are
simplified while preserving any geometry features of
the building interior.
Since we are interested in preserving the 2D tri-
angulation T of the building model, in addition to the
boundary polygon, every edge simplification is per-
formed by collapsing an interior triangle. This com-
putation simplifies the boundary polygon of the model
while still preserving the room labeling of the model’s
volume. These triangle collapses do not preserve the
Delaunay property of the triangulation, but do pre-
serve the boundaries between room volumes, which
is more desirable in the output.
6 HEIGHT EXTRUSION
As mentioned in Section 3.1, each input wall sam-
ple also references the vertical extent for the observed
scans at that location. This information can be used
to convert the labeled 2D interior building model to
a 2.5D extruded model, by using the minimum and
maximum height values for each scan as an estimate
of the floor and ceiling heights, respectively.
Since these wall samples are collected using 2D
planar scanners in an environment containing clut-
ter, the minimum and maximum heights associated
with each point are noisy. Figure 5a shows an ex-
ample room with these initial heights. To produce
aesthetically-pleasing models, each room uses a sin-
gle floor height and a single ceiling height. This as-
sumption is reasonable since the goal of this process-
ing is to produce a simplified building mesh. This step
demonstrates the utility of room labeling to modeling.
The height range for each room is computed from the
median floor and ceiling height values of that room’s
vertices. An example is shown in Figure 5b and the
corresponding result from the simplification process
from Section 5 is demonstrated in Figure 5c.
The 2D triangulation of a room is then used to cre-
ate the floor and ceiling mesh for that room, with the
boundary edges of the triangulation extruded to cre-
ate rectangular vertical wall segments. The result is a
watertight 3D mesh of the building, capturing the per-
manent geometry in an efficient number of triangles.
Figure 5d shows an example of this watertight ex-
truded geometry, including the effects of wall bound-
ary simplification on the resulting extruded mesh.
7 RESULTS
Our approach works well on a variety of test cases,
spanning several model types including offices, ho-
tels, and university buildings. For the largest mod-
GRAPP2014-InternationalConferenceonComputerGraphicsTheoryandApplications
28
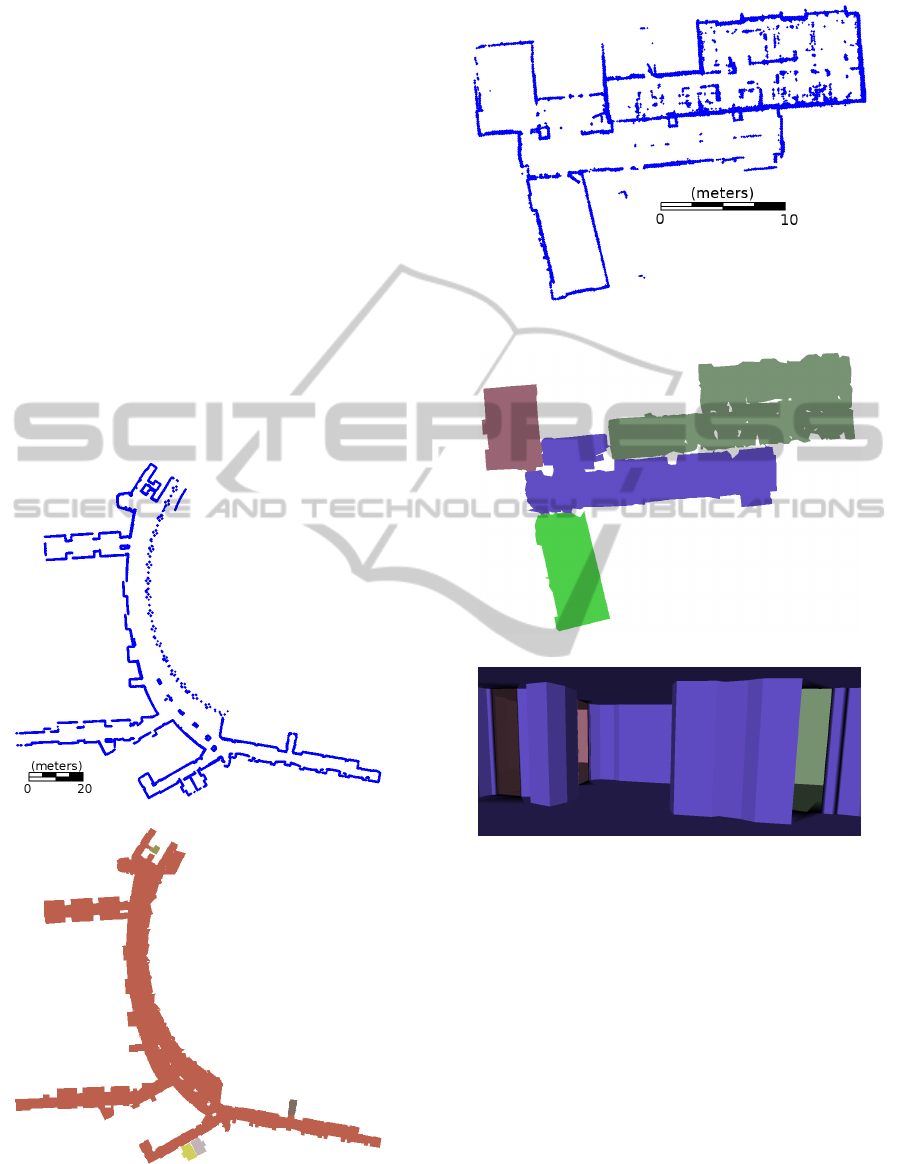
(a) (b)
Figure 7: Office building: (a) Input represented by 12,823 wall samples; (b) generates floor plan with 19 rooms. Extruded 3D
mesh represented with 6,084 triangles. Total processing time required is 7.5 seconds.
(a) (b)
Figure 8: Apartment complex office: (a) Input represented by 3,462 wall samples; (b) generates floor plan with 5 rooms.
Extruded 3D mesh represented with 512 triangles. Total processing time required is 1.2 seconds.
(a)
(b)
Figure 6: Comparison of models from (a) our approach with
(b) existing approach (Turner and Zakhor, 2013).
els, total processing time to compute an extruded 3D
model from 2D wall samples is under 10 seconds.
Most of this time is spent on carving interior trian-
gles, which can be performed real-time in a streaming
manner during data acquisition, which typically lasts
several minutes.
Our 2.5D approach produces simplified models
when compared to surface reconstruction techniques
that preserve fine detail with more complex output.
Specifically, our method omits interior clutter such
as furniture since it uses wall samples as input. Fig-
ure 6 compares the models resulting from our 2.5D
method with that of an existing 3D building model-
ing technique (Turner and Zakhor, 2013) for the hotel
hallways shown in Figure 1. The two methods result
in 2,944 triangles and 4.1 millions triangles, respec-
tively.
Next, we show sample models resulting from our
proposed method in five different environments. For
all the models shown in Figures 7 through 11, the
scale is in units of meters, and the resolution is 5
FloorPlanGenerationandRoomLabelingofIndoorEnvironmentsfromLaserRangeData
29
cm. Figure 7 corresponds to an office building, in-
cluding cubicles and individual offices. The largest
room in this model, shown in teal, primarily contains
cubicles. The cubicle walls do not meet our height
threshold of H = 2 meters, so they are not captured
by the wall samples. Since cubicles are not an ar-
chitectural feature of the environment, this effect is
desirable. The room shown in purple in the lower-
left corner of this model also shows an example error
in the building reconstruction. The adjacent room to
the right was briefly seen through a window, but its
area was considered part of this purple room rather
than being removed in the manner described in Sec-
tion 4.3, resulting in a small extrusion remaining in
the model. Figure 8 shows a small test model of an
apartment office complex and Figure 9 denotes a ho-
tel lobby, hallways, and side rooms. The vast majority
of this model is labeled as one room, consisting of the
(a)
(b)
Figure 9: Hotel lobby and hallways: (a) Input represented
by 33,582 wall samples; (b) generates floor plan with 5
rooms. Extruded 3D mesh represented with 5,012 triangles.
Total processing time required is 8.5 seconds.
(a)
(b)
(c)
Figure 10: University office area: (a) Input represented by
12,183 wall samples; (b) generates floor plan with 4 rooms;
(c) extruded 3D mesh represented with 4,912 triangles. To-
tal processing time required is 7 seconds.
hallways of the building. Since no part of these hall-
ways are separated by doors, this result is desirable.
This model is also the largest example output, cover-
ing over 260 meters of hallways. An interior of the
3D extruded model for this dataset is shown in Fig-
ure 6a. Figure 10 represents an academic research
lab, including conference rooms and student cubicles.
The upper portion of the center room, shown in blue,
is a kitchenette area, with a counter-top. Since the
counter was not sufficiently captured by the wall sam-
ples, it is not represented in the 2.5D extrusion of the
model. Figure 11 shows the hallways of an academic
building.
GRAPP2014-InternationalConferenceonComputerGraphicsTheoryandApplications
30
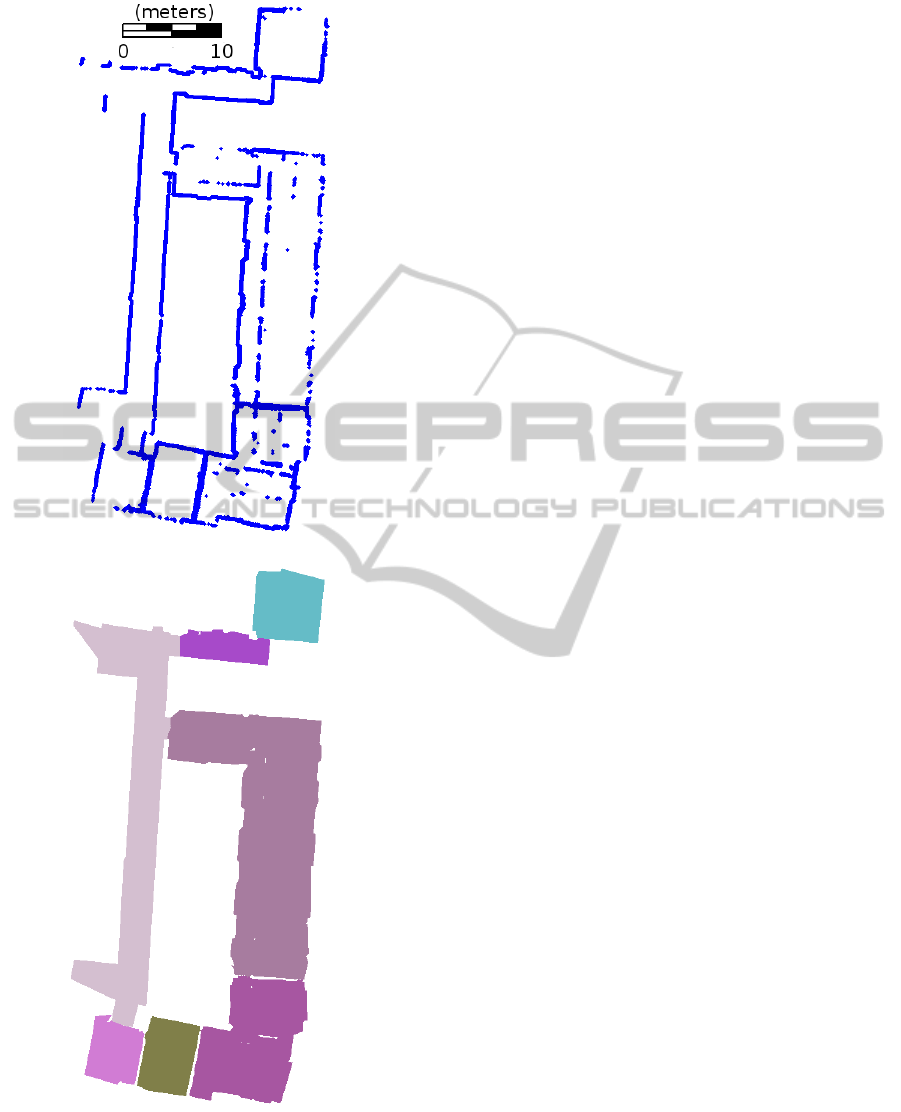
(a)
(b)
Figure 11: University office building: (a) Input represented
by 12,125 wall samples; (b) generates floor plan with 7
rooms. Extruded 3D mesh represented with 3,604 triangles.
Total processing time required is 4.5 seconds.
Since these models were generated with a sys-
tem that captures imagery in addition to laser range
points, these models can also be texture-mapped with
the scenery of the environment (Cheng et al., 2013).
Figure 12 depicts the hallways of an academic build-
ing with and without texturing.
8 CONCLUSIONS
We demonstrate an efficient approach to automati-
cally generate floor plans of building interiors at real-
time speeds. Classifying and labeling the rooms
within each generated floor plan allows for simplifi-
cation schemes that can preserve fine details at door-
ways. These room labels allow for accurate 2.5D ex-
trusion from noisy floor and ceiling height estimates
of the input points. The resulting model is suitable
for visualization, simulation, and navigation applica-
tions. Current limitations of this algorithm include the
verticality assumption made about observed building
features. If the horizontal cross-section of an environ-
ment changes dramatically between different heights,
the modeling techniques presented in this paper does
not accurately portray the actual geometry. Such lim-
itations could be overcome by observing more infor-
mation about each wall sample than just (x, y) posi-
tion and height ranges. If 3D normal estimates could
be made about surfaces, this information may allow
better filtering of outlier wall samples, or to infer
building geometry that was poorly scanned.
REFERENCES
(1990). Americans with Disabilities Act. U.S. Architectural
and Transportation Barriers Compliance Board, 1331
F Street N.W. Suite 1000 Washington D.C. 20004-
1111. ANSI A117.1-1980.
Adan, A. and Huber, D. (2011). 3d reconstruction of inte-
rior wall surfaces under occlusion and clutter. Interna-
tional Conference on 3D Imaging, Modeling, Process-
ing, Visualization and Transmission, pages 275–281.
Brunskill, E., Kollar, T., and Roy, N. (2007). Topologi-
cal mapping using spectral clustering and classifica-
tion. International Conference on Intelligent Robots
and Systems, pages 2491–3496.
Chauve, A.-L., Labatut, P., and Pons, J.-P. (2010). Ro-
bost piecewise-planar 3d reconstruction and comple-
tion from large-scale unstructured point data. CVPR.
Chen, G., Kua, J., Shum, S., Naikal, N., Carlberg, M., and
Zakhor, A. (2010). Indoor localization algorithms for
a human-operated backpack system. 3D Data Pro-
cessing, Visualization, and Transmission.
Cheng, P., Anderson, M., He, S., and Zakhor, A. (2013).
Texture mapping 3d planar models of indoor envi-
FloorPlanGenerationandRoomLabelingofIndoorEnvironmentsfromLaserRangeData
31
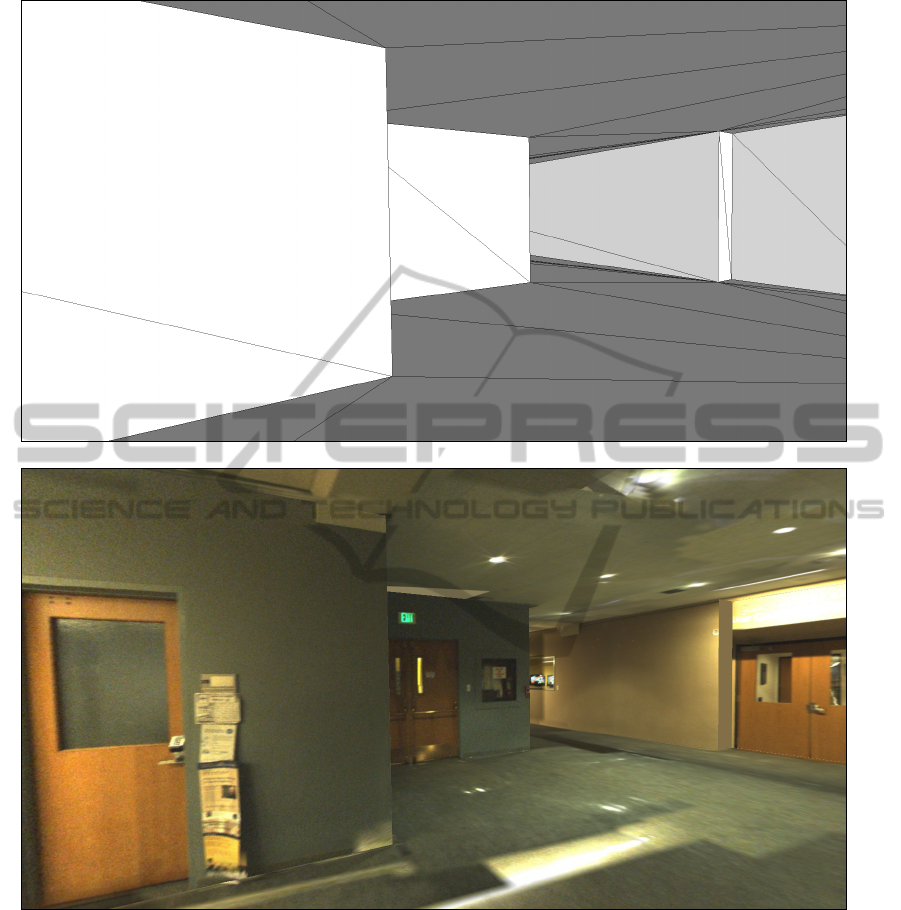
(a)
(b)
Figure 12: Interior view of 3D extruded reconstructed model: (a) without and (b) with texture-mapping (Cheng et al., 2013).
ronments with noisy camera poses. SPIE Electronic
Imaging Conference.
Crawley, B. B., Kawrie, L. K., Pedersen, C. O., and Winkel-
mann, F. C. (2000). Energyplus: Energy simulation
program. ASHRAE, 42(4):49–56.
Fallon, M. F., Johannsson, H., Brookshire, J., Teller, S.,
and Leonard, J. J. (2012). Sensor fusion for flexible
human-portable building-scale mapping. Intelligence
Robots and Systems, pages 4405–4412.
Funkhouser, T. A., Sequin, C. H., and Teller, S. J. (1992).
Management of large amounts of data in interactive
building walkthroughs. Proceedings of the 1992 Sym-
posium on Interactive 3D Graphics, pages 11–21.
Garland, M. and Heckbert, P. S. (1997). Surface simplifica-
tion using quadric error metrics. SIGGRAPH, pages
209–216.
Grisetti, G., Stachniss, C., and Burgard, W. (2005). Im-
proving grid-based slam with rao-blackwellized parti-
cle filters by adaptive proposals and selective resam-
pling. Proceedings of IEEE International Conference
of Robotics and Automation, pages 2443–2448.
Grisetti, G., Stachniss, C., and Burgard, W. (2007).
Improved techniques for grid mapping with rao-
blackwellized particle filters. IEEE Transactions on
Robotics, 23(1):34–46.
Hahnel, D., Gurgard, W., Fox, D., and Thrun, S. (2003).
GRAPP2014-InternationalConferenceonComputerGraphicsTheoryandApplications
32

An efficient fastslam algorithm for generating maps of
large-scale cyclic environments from raw laser range
measurements. International Conference on Intelli-
gent Robots and Systems, 1:206–211.
Holenstein, C., Zlot, R., and Bosse, M. (2011). Water-
tight surface reconstruction of caves from 3d laser
data. IEEE/RSJ International Conference on Intelli-
gent Robots and Systems.
Kua, J., Corso, N., and Zakhor, A. (2012). Automatic loop
closure detection using multiple cameras for 3d indoor
localization. IS&T/SPIE Electronic Imaging.
Lewis, R. and Sequin, C. (1998). Generation of 3d building
models from 2d architectural plans. Computer-Aided
Design, 30(10):765–779.
Okorn, B., Xiong, X., Akinci, B., and Huber, D. (2009).
Toward automated modeling of floor plans. 3DPVT.
Or, S.-H., Wong, K.-H., kin Yu, Y., and yuan Chang, M. M.
(2005). Highly automatic approach to architectural
floorplan image understanding and model generation.
Pattern Recognition.
Shen, S., Michael, N., and Kumar, V. (2011). Autonomous
multi-floor indoor navigation with a computationally
constrained mav. IEEE International Conference on
Robotics and Automation, pages 20–25.
Smith, M., Posner, I., and Newman, P. (2011). Adaptive
compression for 3d laser data. The International Jour-
nal of Robotics Research, 30(7):914–935.
Thrun, S., Burgard, W., and Fox, D. (2005). Probabilistic
Robotics. The MIT Press.
Turner, E. and Zakhor, A. (2012). Watertight as-built archi-
tectural floor plans generated from laser range data.
3DimPVT.
Turner, E. and Zakhor, A. (2013). Watertight planar sur-
face meshing of indoor point-clouds with voxel carv-
ing. 3DV 2013.
Xiao, J. and Furukawa, Y. (2012). Reconstructing the
world’s museums. EECV 2012 Lectures in Computer
Science, 7572:668–681.
FloorPlanGenerationandRoomLabelingofIndoorEnvironmentsfromLaserRangeData
33
