
Human Activity Recognition from Triaxial Accelerometer Data
Feature Extraction and Selection Methods for Clustering of Physical Activities
In
ˆ
es Machado
1
, Ricardo Gomes
1
, Hugo Gamboa
1,2
and V
´
ıtor Paix
˜
ao
3
1
CEFITEC, Physics Department, FCT-UNL, Lisbon, Portugal
2
PLUX - Wireless Biosignals, Lisbon, Portugal
3
Champalimaud Foundation, Lisbon, Portugal
Keywords:
Physical Activity Recognition, Signal Processing, Feature Extraction, Feature Selection, Unsupervised
Learning.
Abstract:
The demand for objectivity in clinical diagnosis has been one of the greatest challenges in Biomedical Engi-
neering. The study, development and implementation of solutions that may serve as ground truth in physical
activity recognition and in medical diagnosis of chronic motor diseases is ever more imperative. This paper
describes a human activity recognition framework based on feature extraction and feature selection techniques
where a set of time, statistical and frequency domain features taken from 3-dimensional accelerometer sensors
are extracted. In this paper, unsupervised learning is applied to the feature representation of accelerometer
data to discover the activities performed by different subjects. A feature selection framework is developed in
order to improve the clustering accuracy and reduce computational costs. The features which best distinguish
a particular set of activities are selected from a 180
th
- dimensional feature vector through machine learning
algorithms. The implemented framework achieved very encouraging results in human activity recognition: an
average person-dependent Adjusted Rand Index (ARI) of 99.29% ± 0.5% and a person-independent ARI of
88.57% ± 4.0% were reached.
1 INTRODUCTION
The constant concern with the human physical and
psychological well-being has been the drive for re-
search studies that have led to a promising evolution
of medicine and engineering. The study, development
and implementation of solutions that may serve as
ground truth in physical activity recognition and in
medical diagnosis of chronic motor diseases is ever
more imperative. In this paper, a Human Activity
Recognition (HAR) framework is developed using a
wearable 3-dimensional accelerometer sensor. The
main focus of this paper is to understanding the sig-
nals produced by a Triaxial Accelerometer (TA), in-
terpreting them in the context of human movement
and identifying relevant parameters from the data.
The versatility of the algorithm enables the identifica-
tion of relevant features able to recognize simple daily
activities. We obtain a 180
th
- dimensional feature
vector from statistical, time and frequency domains.
The dimensionality of the feature vector should be as
small as possible by reducing the amount of irrele-
vant and redundant information in the data, not only
to reduce the computation complexity, but also to ob-
tain better clustering performance. The remainder of
the paper is organized as follows: Section 2 describes
the background and related work. The importance of
objective monitoring human movement is discussed.
That section also presents an overview on other stud-
ies about HAR with wearable sensors. Section 3 ex-
plains the composition of the TA signal. The signal
is made up of several components, and each of these
is examined. The difficulties in distinguish between
the different signal components are discussed. Sec-
tion 4 describes the proposed methodology used in
this work to extract and select features based on mo-
tion data. Section 5 describes the architecture of the
acquisition system and the obtained results. Section 6
presents the conclusions obtained from the investiga-
tion and some future research directions.
2 BACKGROUND
In recent decades, there has been an increasing in-
terest in the use of Accelerometry (ACC) to moni-
155
Machado I., Gomes R., Gamboa H. and Paixão V..
Human Activity Recognition from Triaxial Accelerometer Data - Feature Extraction and Selection Methods for Clustering of Physical Activities.
DOI: 10.5220/0004749801550162
In Proceedings of the International Conference on Bio-inspired Systems and Signal Processing (BIOSIGNALS-2014), pages 155-162
ISBN: 978-989-758-011-6
Copyright
c
2014 SCITEPRESS (Science and Technology Publications, Lda.)
tor human behaviour. Monitoring human movement
can provide valuable information on a patient and
some parameters of movement can provide informa-
tion of health status, rate of rehabilitation and other
potentially useful clinical data. The advance of tech-
nology has helped the development of accelerome-
ters of small size and low cost, making them a very
convenient tool for monitoring subjects. One of the
key point is the diversity of areas where ACC has
been used in the past. The most studied have be-
ing: metabolic energy expenditure, Physical Activity
(PA), balance and postural sway, sit-to-stand transfers
(which is an important indicator for postural instabil-
ity) and detection of falls. The use of accelerometers
has also allowed to help on diagnose of a number of
diseases such as Parkinson’s Disease (Palmerini et al.,
2013), Autism Spectrum Disorder, (Bandini et al.,
2013) and Depression (Phillips and McAuley, 2013).
3 TRIAXIAL ACCELEROMETER
SIGNAL
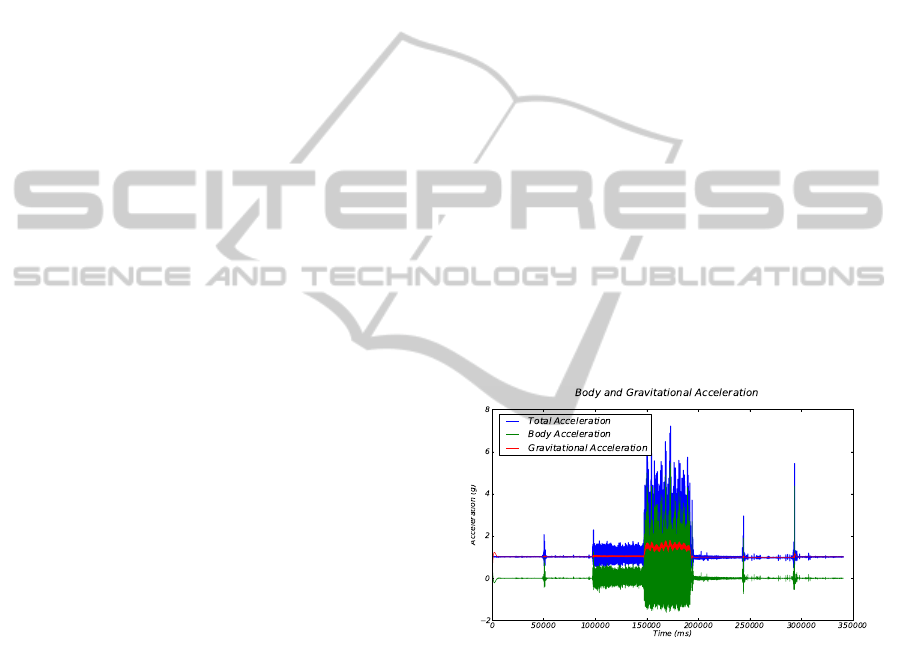
The signal measured by each fixed-body ac-
celerometer is a linear sum of, approximately, three
components (Mathie, 2003):
• Body Acceleration Component: acceleration re-
sulting from body movement;
• Gravitational Acceleration Component: accelera-
tion resulting from gravity;
• Noise intrinsic to the measurement system.
The first two components provide different infor-
mation about the wearer of the device: the Gravita-
tional Acceleration (GA) provides information about
the space orientation of the device, and the Body Ac-
celeration (BA) provides information about the move-
ment of the device. The separation of the information
regarding the movement of the device - Body Accel-
eration Component - is important, however these two
components have overlapping frequency spectra. The
BA component ranges from above 0 Hz to possibly
up 20 Hz, but is mostly contained in the range above
0 and below 3 Hz. This range overlaps the area cov-
ered by the GA component, which goes from 0 to
several Hertz. It is possible to approximately sepa-
rate the BA and the GA components with some filter-
ing. A wide range of different filters types with differ-
ent characteristics and different windowing percent-
ages were tested in previous studies, as in (Mathie,
2003), in order to determine their ability to differenti-
ate the components of the acceleration signal. In the
presented study, a cut-off frequency of 0.25 Hz was
chosen, as it is consistent with the frequencies used in
other research works. (Smeja and Muller, 1997) and
(Foerster and Fahrenberg, 2000) choose to use 0.5 Hz,
while (Khan et al., 2010) choose 0.1 Hz. In the pre-
sented study, in order to isolate the BA component,
a second-order Butterworth High-Pass filter with cut-
off frequency of 0.25 Hz is used. Figure 1 illustrates
each component of a typical recording from the ac-
celerometer showing seven minutes of motion data
where the subject is asked to perform seven specific
tasks.
The placement of the accelerometer is another im-
portant point of discussion. A device that is to be
worn over extended periods must be designed to be
as simple to put on and comfortable to wear in order
to encourage compliance of patients. General body
motion can be measured with a single accelerometer
placed close to the body’s center of mass, which is lo-
cated within the pelvis (Liu, 2013). The advantage of
placing the accelerometer attached to the waist is that
it allows the monitoring of accelerations near the cen-
ter of mass. Any movement of the body will cause the
center of mass to shift. This study aims to develop a
HAR framework, for a waist mounted accelerometer
based system.
Figure 1: Body and Gravitational Acceleration for each axis
of accelerometer sensor.
4 PROPOSED METHODS
Different segmentation methods can be applied to
time-series data which enhance signal behaviour and
enable the gather of useful information from contin-
uous stream of data such as timing and sliding win-
dows. For activity recognition, where accelerome-
ter data is windowed, the choice of the number of
frames is guided by a trade-off between information
and resolution. The accelerometer data was collected,
cleaned, and preprocessed to extract features that
characterize different samples data windows. Cluster-
BIOSIGNALS2014-InternationalConferenceonBio-inspiredSystemsandSignalProcessing
156

ing mechanisms separate and organize unlabeled data
into different groups whose members are similar to
each other in some metric. Different approaches gen-
erally lead to different clusters. Even for the same al-
gorithm, the parameter identification or the sequence
of input patterns may affect the final results. These
assessments should be unbiased. In this work, the
K-Means Clustering Algorithm (Lloyd, 1982) and a
squared Euclidean distance metric were used.
4.1 Feature Design
The HAR strategy depends essentially on the set of
features that are extracted from the signal. TA are
made up of three separated accelerometer data time
series, one time series for acceleration on each orthog-
onal axis ACC
x
, ACC
y
and ACC
z
. Complementary to
the three axes data, an additional time series, ACC
tot
,
have been obtained by computing the magnitude of
the acceleration, Equation 1:
ACC
tot
=
q
ACC
2
x
+ ACC
2
y
+ ACC
2
z
(1)
Each time series ACC
i
, with i = x, y, z has been fil-
tered with a second-order Butterworth High-Pass fil-
ter with cut-off frequency of 0.25 Hz in order to sepa-
rate low frequencies component and high frequencies
component as suggested in (Mathie, 2003) and (Man-
nini and Sabatini, 2010). This way, for each time se-
ries, three extra time series BA
i
are obtained, with i =
x, y, z, representing the time series with body acceler-
ation component. Finally, features from each one of
the time series are extracted.
4.2 Accelerometer Signal Annotation
In unsupervised learning, the motion data has to be
annotated to compute the performance of the algo-
rithm. If true class labels are known, the validity of
a clustering can be verified by comparing the pre-
dicted labels and the true labels. An aspect of activ-
ity recognition that has been greatly explored is the
method of annotating sample data that can be used
to compute the performance of the clustering method.
Many experiments use unsupervised learning meth-
ods and apply manually annotated test data to eval-
uate their performances. In other cases, the experi-
menters told the participants in which order the spec-
ified activities should be performed, so the correct
activity labels were identified before the sensor data
was even collected. Still in other studies, the raw
sensor data is manually inspected in order to anno-
tate it with a corresponding activity label (Wren and
Tapia, 2006). In the presented study, participants were
continuously observed during experiments and an ob-
server was stating starting/ending time of each activ-
ity. The subjects know in which order the specified
activities should be performed and latter, raw sensor
data was manually inspected in order to annotate it
with a corresponding activity label. For each signal,
an annotation, in JavaScript Object Notation (JSON)
(Crockford, 2006) is created, with i the number of ac-
tivities, Scheme 2:
”Labels” : [l
1
, , . . . , l
i
],
”Initial Times” : [init
1
, . . . , init
i
]
”End Times” : [end
1
, . . . , end
i
]
(2)
The dictionary has information about the number
and label of the movements that took place and the
time intervals that delimit them. Each label corre-
sponds to one, and only one, activity, regardless of the
subject. The input is an array with the initial and fi-
nal times of each activity. It also receives as input the
window size and the considered overlap percentage.
4.3 Feature Extraction
Recognizing human activities depends directly on
the features extracted for motion analysis. A set of
features, which will most efficiently and meaning-
fully represent the information that is important for
analysis and the clustering process, is performed. In
this section, tests were made in order to assess the
following parameters:
• The influence of the signal’s window size on the
clustering performance.
• The influence of the free parameters in that same
performance.
• The best feature combination that leads to a better
performance of the implemented algorithm.
A dictionary of the extracted features from the
motion data, was created, in a JSON format (Crock-
ford, 2006). For each feature, the following informa-
tion was collected: Description, Imports, Use, Metric,
Free Parameters, Parameters, Number of Features,
Function, Source and Reference. Table 1 shows the
high level list of features considered in the presented
study. The implemented dictionary divides the fea-
tures into statistical, temporal and spectral domains.
By manipulating this dictionary, the clustering algo-
rithm can be easily tested with a different combina-
tion of features. To compute the feature vector the
following inputs are needed: motion data, window
length of the signal, sampling frequency of the data
HumanActivityRecognitionfromTriaxialAccelerometerData-FeatureExtractionandSelectionMethodsforClustering
ofPhysicalActivities
157

Table 1: Statistical, Temporal and Spectral Domain Fea-
tures.
Statistical Domain
Kurtosis
Skewness
Mean
Standard Deviation
Interquartile Range
Histogram
Root Mean Square
Median Absolute Deviation
Temporal Domain
Zero Crossing Rate
Pairwise Correlation
Autocorrelation
Spectral Domain
Maximum Frequency
Median Frequency
Cepstral Coefficients
Power Spectrum
MFCC
Fundamental Frequency
Power Bandwidth
acquisition, a feature’s dictionary, a matrix of free
parameter combinations and the considered overlap
percentage. For each ACC axis, this function goes
through each window of the signal, with the consid-
ered window length and overlap percentage and com-
putes a feature matrix with n-samples by m-features
dimension. For each signal, three new files were cre-
ated: one with the features information per window,
one with the names of the features that were extracted
for the respective clustering test and another with the
label of the activity corresponding to each window.
The sensor acceleration signal is made up of three
separated accelerometer data time series and comple-
mentary to the three axes data, an additional time se-
ries have been obtained by computing the magnitude
of the acceleration, so four signal vectors are con-
sidered. From each window, a vector of features is
obtained by calculating features from the statistical,
time and frequency domain. This way, a 180
th
- di-
mensional feature vector is obtained: from each one
of the four signal vectors, we compute fifteen features
with only one output and three features (histogram,
cepstral coefficients and mel-frequency cepstral coef-
ficients (MFCC)) with ten outputs each.
Because the scale factors and units of the features
described above are different, all the features must
be normalized to zero mean and unit variance, before
proceed to the feature selection stage.
4.4 Feature Selection for Motion Data
A large number of features can usually be measured
in many pattern recognition applications. However,
not all features are equally important for a specific
task. For each signal, different combinations of fea-
tures, free parameters of these features and window
size of the signal can be tested, in order to evalu-
ate the performance of the implemented clustering al-
gorithm. Optimal features are identified depending
on the resulting clustering accuracies for each feature
subset.
4.4.1 Free Parameters of Features Set
In order to make the implemented code versatile and
the least subjective as possible, a matrix with the val-
ues of all the possible combinations that these param-
eters can take, was created. No window size value
was stipulated, but a combination of different values
from a growing logarithmic scale can be tested. Ac-
cording to Table 2, tests were made in which the win-
dow size ranged from 1000 to 4000 samples, in a log
scale. For each window size, different performances
were obtained. Tests were made to determine the free
parameters in each activity, that allow a better activity
recognition performance. Examples of free parame-
ters are the number of bins or the range of the im-
plemented histogram. The values given to these pa-
rameters will dictate the performance obtained by the
clustering algorithm. In this way, a 486-dimensional
free parameter combinations vector was obtained.
Table 2: Possible combinations of free parameters and win-
dow size values.
Free Parameter Range Combinations
Window Size [1000 ; 4000] 3
Bins of Histogram [10 ; 20] 3
Range of Histogram [1 ; 3] 2
Cepstral C. [1 ; 11] 3
MFCC [10 ; 20] 3
Power Bandwidth [10 ; 20] 3
4.4.2 Graphical Perception of Features
Visualizations
A technique for the visualization of time series data
and evaluate their effect in value comparison tasks
was described in (Heer et al., 2009). In order to visu-
ally analyse each feature’s behaviour throughout dif-
ferent activities, horizon graphs are used. This pro-
cedure ensures a visual perception of the features that
better separate certain activities, those which do not
change their value between activities and those which
only add redundant information. Figure 2 shows an
example of a horizon graph generated for a matrix of
features, resulting from an ACC signal composed by
seven distinct activities. Each activity lasts about one
BIOSIGNALS2014-InternationalConferenceonBio-inspiredSystemsandSignalProcessing
158

minute and we consider 4000 samples for the win-
dow size of the signal. It is possible to quantitatively
compare the behaviour of each feature in each activ-
ity. First, the area between data curve and zero y-
axis is filled in so that dark reds are very negative and
dark blues are very positive. Then, negative values
are flipped and coloured red, cutting the chart height
by half. Finally, the chart is divided into bands and
overlaid, again halving the height.
4.5 Unsupervised Learning
Machine learning algorithms based on the feature rep-
resentation of accelerometer data have become the
most widely used approaches in PA prediction (I. H.
Witten, E. Frank and Hall, 2011). In this work, unsu-
pervised learning is used to distinguish different ac-
tivities. Clustering mechanisms separate and orga-
nize unlabeled data into different groups whose mem-
bers are similar to each other in some metric. This
method receives the number of clusters to form as
well as the number of centroids to generate. In the
presented study, the number of clusters was defined,
a priori, a priori, from the designed protocol of the
performed activities. A good clustering methodology
will produce clusters in which the intra-class similar-
ity is high and the inter-class similarity is low. The
K-Means Clustering Algorithm (Lloyd, 1982) gives a
single set of clusters, with no particular organization
or structure within them.
5 DATA ACQUISITION AND
RESULTS
The experiments have been carried out with a group
of 8 volunteers within an age range of 16-44 years.
The test consists in performing of a gym circuit. Each
person performs seven activities in sequence lasting
about one minute each - standing, sitting, walking,
running, lying down (belly up), lying down (right side
down) and lying down (left side down), wearing an
accelerometer on the waist. Using this system, data
with 3-axial acceleration at a constant rate of 800 Hz
and 12 bits of resolution was acquired. The data ac-
quisition was performed with OpenSignals platform
(Gomes et al., 2012) and saved in a h5 format. The
collected data was processed offline using Python
Programming Language (Oliphant, 2006). Clustering
tests are performed, individually, for each subject and
with the respectively concatenated data: in a subject-
dependent and a subject-independent context. To
evaluate the subject-dependent accuracy of the pro-
posed algorithm, the K-Means Clustering Algorithm
(Lloyd, 1982) was performed for each subject data.
Given the knowledge of the ground truth class assign-
ments (labels true) and the clustering algorithm as-
signments of the same samples (predicted labels), the
adjusted Rand index (ARI) is a function that measures
the similarity of the two assignments, ignoring per-
mutations and with chance normalization. The ARI
was calculated to obtain the performance of the clus-
tering method. An average person-dependent accu-
racy of 99.29% and standard deviation of 0.5% were
obtained, with a window size of 4000 samples and the
best set of features: mean, autocorrelation, root mean
square and MFCC. High accuracies are reached for
all subjects. The subject-independent performance
was also evaluated with K-Means Clustering Algo-
rithm (Lloyd, 1982). A person-independent accuracy
of 88.57% and standard deviation of 4.0% were ob-
tained, with a window size of 4000 samples and the
best set of features: mean, autocorrelation, root mean
square and MFCC.
Table 3: Clustering Performance (mean value) as a function
of different window length extracted from the best set of
features.
Window Size Adjusted Rand Index (%)
1000 samples 89.73% ±0.4%
2000 samples 97.42% ±0.9%
4000 samples 99.29% ±0.5%
Table 3 shows the obtained performance for each
value of window size, considering the best imple-
mented set of features: mean, autocorrelation, root
mean square and MFCC. An average of the perfor-
mances obtained for the 8 subjects was calculated.
Based on these results, the HAR system reaches
an accuracy between 89.73% ±0.4% and 99.29%
±0.5%, with 1000 and 4000 samples, respectively.
5.1 Classification-based Evaluation:
Proposed Metric
A new metric for assessing the obtained results
from unsupervised techniques, a classification-based
evaluation metric, was developed. Initially, a confu-
sion matrix that contains information about true and
predicted labels done by a clustering method was
constructed. Once the clustering algorithm randomly
associates the clustering results to non-annotated
groups, the Algorithm, Best Cluster Permutation,
that links these groups to their corresponded activity,
was implemented. The presented Algorithm receives
the confusion matrix with a random assignment and
goes through each row of the matrix and stores the
HumanActivityRecognitionfromTriaxialAccelerometerData-FeatureExtractionandSelectionMethodsforClustering
ofPhysicalActivities
159
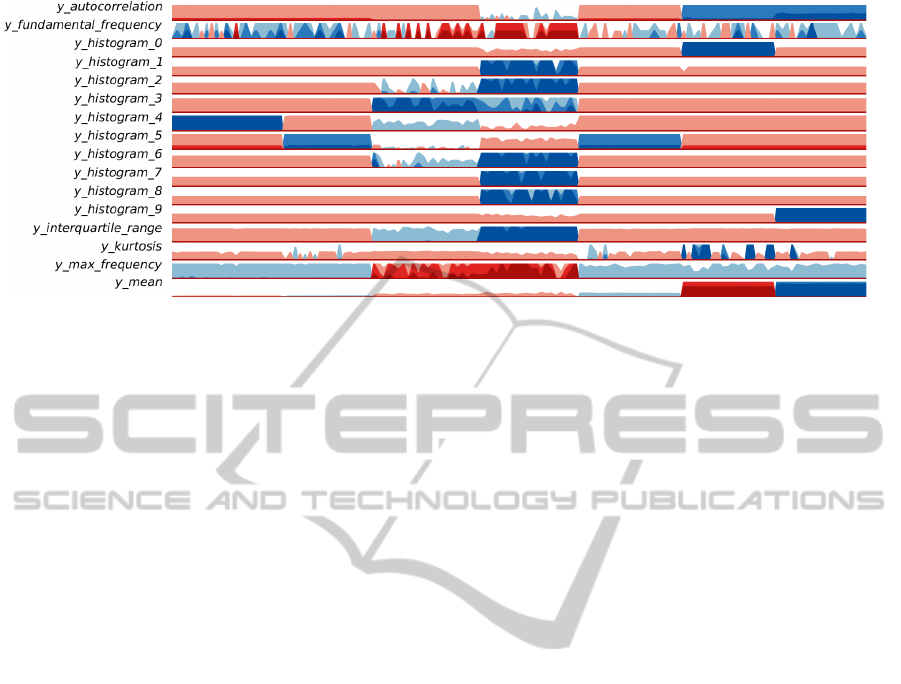
Figure 2: Horizon Graph - Time Series Visualization Technique.
index that contains the maximum value of each row.
Algorithm: Best Cluster Permutation.
Input: Input: confusion matrix with a
random assignment.
Output: confusion matrix correctly
assigned.
It is checked whether the index is unique through-
out the matrix. If the index is unique, it makes the
direct correspondence between the vector of true and
predicted labels. Otherwise, it checks the index with
the maximum value, and assigns it. The process is re-
cursively repeated. After obtaining the swap vector,
the matrix with the labels already associated is recon-
structed. Table 4 shows the confusion matrix for this
study where label i, with i = {1, 2, ...,7}, corresponds
respectively to: standing, sitting, walking, running,
lying down (belly up), lying down (right side down)
and lying down (left side down). For the concatenated
data, the algorithm successfully distinguish all activi-
ties.
6 CONCLUSIONS AND FUTURE
WORK
The continuously need to obtain more information,
more efficient, more quickly and with less interven-
tion from an expert has led to a growing application
of signal processing techniques to motion data.
During the experiment, acceleration signals were
collected from a waist mounted accelerometer based
framework. In the presented study, a methodology to
search for the best features able to classify different
physical activities was presented. The techniques
that operate on the statistical, time and frequency
domains, as well as on data representations that can
be used to discriminate between user activities such
as Horizon Plot were described. The obtained results
in clustering accuracy of HAR were very encour-
aging: an average person-dependent ARI (Santos
and Embrechts, 2009) of 99.29% and a person-
independent ARI of 88.57% were reached. The
major achievements of the current work, compared to
the state of the art are: the presented study performs
tests in intra and inter subject context; a set of 180
features was implemented, which are easily selected
to test different groups of subjects and different
activities and the implemented algorithm does not
stipulate, a priori, any value for window length of the
signal or overlap percentage, but performs a search
to find the best parameters that define the specific
data. A clustering metric based on the construction
of the data confusion matrix was also proposed. The
presented research leaves a few opened questions, to
be explored in the future:
• Bigger Timespan. Week Long Acquisitions of
Movement.
• More Data. Increase the Number of Subjects and
Applications.
• More Computing Power. Use Parallel Comput-
ing Infrastructures on the Data Collected.
• More Discoveries. Detect the Behaviour changes
and annotate those changes.
In the future, this framework should be tested on
other intensity varying activities and across more sub-
jects. For example, test it on individuals running and
walking at a greater range of intensity levels. ACC
data obtained from wearable accelerometers can be
synchronized with the activity of daily living data
recorded by such monitoring systems to better de-
scribe the information of human mobility, behavioural
pattern and functional ability that encompass the im-
portant parameters regarding the overall health status
of an individual.
BIOSIGNALS2014-InternationalConferenceonBio-inspiredSystemsandSignalProcessing
160

Table 4: Confusion Matrix, in percentage, for concatenated data, where Lying Down
(1)
is lying down (belly up), Lying
Down
(2)
is lying down (right side down) and Lying Down
(3)
is lying down (left side down).
Standing Sitting Walking Running Lying
Down
(1)
Lying
Down
(2)
Lying
Down
(3)
Standing 92.1±3.2 0.0±0.0 0.0±0.0 0.0±0.0 5.4± 2.3 1.3±0.9 1.1±0.8
Sitting 28.3±6.9 68.0±5.9 1.1±0.6 0.3±0.7 0.1± 0.3 1.6±0.7 0.6±1.3
Walking 0.0±0.0 0.4±0.5 99.5±0.5 0.1±0.3 0.0±0.0 0.0±0.0 0.0±0.0
Running 0.0±0.0 0.0±0.0 0.3±0.4 99.4±0.7 0.3±0.4 0.1±0.3 0.0±0.0
Lying Down
(1)
0.9±0.6 2.0±1.1 0.1±0.3 0.0±0.0 82.1±1.9 7.5±1.4 7.4±1.3
Lying Down
(2)
0.0±0.0 0.0±0.0 0.1±0.3 0.5±1.0 1.1±0.0 90.4±0.9 8.0±1.3
Lying Down
(3)
0.0±0.0 0.0±0.0 0.0±0.0 0.0±0.0 0.1±0.3 0.4±0.5 99.5±0.5
The main challenge for future work in this area
will be the development of features and recognition
strategies that can work in an ambient assisted living
under a wide variety of environmental conditions.
REFERENCES
Ankerst, M., Breunig, M. M., Kriegel, H.-P., and Sander, J.
(1999). Optics: ordering points to identify the cluster-
ing structure. SIGMOD Rec., 28(2):49–60.
Bandini, L. G., Gleason, J., Curtin, C., Lividini, K., An-
derson, S. E., Cermak, S. A., Maslin, M., and Must,
A. (2013). Comparison of physical activity between
children with autism spectrum disorders and typically
developing children. Autism, 17(1):44–54.
Bouten, C. V., Koekkoek, K. T., Verduin, M., Kodde, R.,
and Janssen, J. D. (1997). A triaxial accelerometer
and portable data processing unit for the assessment of
daily physical activity. IEEE Transactions on Biomed-
ical Engineering, 44(3):136–147.
Bugan
´
e, F., Benedetti, M. G., Casadio, G., Attala, S., Biagi,
F., Manca, M., and Leardini, A. (2012). Estimation
of spatial-temporal gait parameters in level walking
based on a single accelerometer: Validation on normal
subjects by standard gait analysis. Comput. Methods
Prog. Biomed., 108(1):129–137.
Crockford, D. (2006). The application/json media type for
javascript object notation (json). RFC 4627, IETF.
Donalek, C. (2011). Supervised and Unsupervised Learn-
ing. (April).
Ester, M., peter Kriegel, H., S, J., and Xu, X. (1996).
A density-based algorithm for discovering clusters in
large spatial databases with noise. pages 226–231.
AAAI Press.
Foerster, F. and Fahrenberg, J. (2000). Motion pattern and
posture: correctly assessed by calibrated accelerome-
ters, page 32(3):450457.
Frey, B. J. and Dueck, D. (2007). Clustering by
passing messages between data points. Science,
315(5814):972–976.
Gomes, R., Nunes, N., Sousa, J., and Gamboa, H. (2012).
Long term biosignals visualization and processing. In
BIOSIGNALS, pages 402–405.
Heer, J., Kong, N., and Agrawala, M. (2009). Sizing the
horizon: The effects of chart size and layering on the
graphical perception of time series visualizations. In
ACM Human Factors in Computing Systems (CHI).
I. H. Witten, E. Frank and Hall, M. A. (2011). Data Mining:
Practical Machine Learning Tools and Techniques.
Khan, A. M., Lee, Y.-K., Lee, S. Y., and Kim, T.-
S. (2010). A triaxial accelerometer-based physical-
activity recognition via augmented-signal features and
a hierarchical recognizer. Trans. Info. Tech. Biomed.,
14(5):1166–1172.
Liao, L., Fox, D., and Kautz, H. (2005). Location-based ac-
tivity recognition using relational markov networks.
In Proceedings of the 19th international joint confer-
ence on Artificial intelligence, IJCAI’05, pages 773–
778, San Francisco, CA, USA. Morgan Kaufmann
Publishers Inc.
Liu, A. D. (2013). The Effect of Sensor Mass, Sensor Lo-
cation, and Delamination Location Of. PhD thesis,
California Polytechnic State University.
Lloyd, S. P. (1982). Least squares quantization in pcm.
IEEE Transactions on Information Theory, 28:129–
137.
Mannini, A., Intille, S. S., Rosenberger, M., Sabatini, A. M.,
and Haskell, W. (2013). Activity recognition using a
single accelerometer placed at the wrist or ankle. Med
Sci Sports Exerc.
Mannini, A. and Sabatini, A. (2010). Machine learn-
ing methods for classifying human physical activities
from on-body sensors.
Mathie, M. (2003). Monitoring and interpreting human
movement patterns using a triaxial accelerometer.
Oliphant, T. (2006). Guide to Numpy. Tregol Publishing.
Palmerini, L., Mellone, S., Avanzolini, G., Valzania, F., and
Chiari, L. (2013). Classification of early-mild subjects
with parkinson’s disease by using sensor-based mea-
sures of posture, gait, and transitions. In AIME, pages
176–180.
HumanActivityRecognitionfromTriaxialAccelerometerData-FeatureExtractionandSelectionMethodsforClustering
ofPhysicalActivities
161

Peeters, G. (2004). A large set of audio features for
sound description (similarity and classification) in the
CUIDADO project.
Phillips, S. M. and McAuley, E. (2013). Physical activ-
ity and fatigue in breast cancer survivors: A panel
model examining the role of self-efficacy and depres-
sion. Cancer Epidemiology Biomarkers & Prevention,
22(5):773–781.
Pour, G., Troped, P., and Evans, J. (2013). Environment
feature extraction and classification for context aware
physical activity monitoring. In Sensors Applications
Symposium (SAS), 2013 IEEE, pages 123–128.
Santos, J. M. and Embrechts, M. (2009). On the use of the
adjusted rand index as a metric for evaluating super-
vised classification. In Alippi, C., Polycarpou, M. M.,
Panayiotou, C. G., and Ellinas, G., editors, ICANN (2),
volume 5769 of Lecture Notes in Computer Science,
pages 175–184. Springer.
Simon, B. J., Errico, J. P., and Raffle, J. T. (2013). Non-
invasive magnetic or electrical nerve stimulation to
treat or prevent autism spectrum disorders and other
disorders of psychological development. US Patent
App. 13/783,319.
Smeja, J. F. F. F. M. and Muller, W. (1997). Assessment
of posture and motion by multichannel piezoresistive
accelerometer recordings. Psychophysiology, page
34(5):607612.
Song, M. R., Lee, Y.-S., Baek, J.-D., and Miller, M. (2012).
Physical activity status in adults with depression in
the national health and nutrition examination survey,
2005–2006. Public Health Nursing, 29(3):208–217.
Wren, C. R. and Tapia, E. M. (2006). Toward scalable ac-
tivity recognition for sensor networks. In In Lecture
Notes in Computer Science, pages 168–185. Springer.
Z. Ghahramani (2004). Unsupervised learning. Gatsby
Computational Neuroscience Unit, University College
London.
Zheng, Y., Wong, W.-K., Guan, X., and Trost, S. (2013).
Physical activity recognition from accelerometer data
using a multi-scale ensemble method.
BIOSIGNALS2014-InternationalConferenceonBio-inspiredSystemsandSignalProcessing
162
