
Multiple Segmentation of Image Stacks
Jonathan Smets and Manfred Jaeger
Department for Computer Science, Aalborg University, Aalborg, Denmark
Keywords:
Segmentation, Multiple Clustering, Probabilistic Models.
Abstract:
We propose a method for the simultaneous construction of multiple image segmentations by combining a
recently proposed “convolution of mixtures of Gaussians” model with a multi-layer hidden Markov random
field structure. The resulting method constructs for a single image several, alternative segmentations that
capture different structural elements of the image. We also apply the method to collections of images with
identical pixel dimensions, which we call image stacks. Here it turns out that the method is able to both
identify groups of similar images in the stack, and to provide segmentations that represent the main structures
in each group.
1 INTRODUCTION
Traditional clustering methods construct a single
(possibly hierarchical) partitioning of the data. How-
ever, clustering when used as an explorativedata anal-
ysis tool may not possess a single optimal solution
that is characterized as the optimum of a unique un-
derlying score function. Rather, there can be multiple
distinct clusterings that each represent a meaningful
view of the data. This observation has led to a re-
cent research trend of developing methods for multi-
ple clustering (or multi-view clustering). The general
goal of these methods is to automatically construct
several clusterings that represent alternative and com-
plementary views of the data (see (M¨uller et al., 2012)
for a recent overview,and the proceedings of the Mul-
tiClust workshop series for current developments).
The perhaps most typical application area for mul-
tiple clustering is document data (e.g. collections of
news articles or web pages). For example, the stan-
dard benchmarkWebKB dataset consists of university
webpages that can be alternatively clustered accord-
ing to page-type (e.g. personal homepage or course
page), or the different universities the pages are taken
from. Turning to image data, previously used bench-
mark sets are the CMU and the Yale Face Images
data, which consists of portrait images of different
persons in several poses, and accordingly can be clus-
tered according to persons or poses (Cui et al., 2007;
Jain et al., 2008). In this setting, each image is a
data-point, and (multiple) clustering means grouping
images. When, instead, one views as a data-point a
single image pixel, then multiple clustering becomes
multiple image segmentation.
Relatively few work has been done on finding
multiple, alternative image segmentations. (Kim and
Zabih, 2002) developed a quite specific factorial
Markov random field model in which an image is
modeled as an overlay of several layers, and each
layer corresponds to a binary segmentation. (Qi and
Davidson, 2009) apply a general multiple clustering
approach to a variety of datasets, including images.
Their multiple clustering approach falls into the cat-
egory of iterative multiple clustering, where given an
initial (primary) clustering, a single alternative clus-
tering is constructed. Our approach, on the other
hand, falls into the category of simultaneous multi-
ple clustering methods, where an arbitrary number of
different clusterings is constructed at the same time,
and without any priority ordering among the cluster-
ings. Finally, (Kato et al., 2003) generate alternative
segmentations based on color and texture features, re-
spectively. However, the objective here is not to pro-
vide different, alternative segmentations, but to com-
bine the two segmentations into a single one.
It is worth emphasizing that multiple clustering
in the sense here considered is different from the
construction of cluster ensembles (Strehl and Ghosh,
2003). In the latter, numerous clusterings are built
in order to overcome the convergence to only locally
optimal solutions of clustering algorithms, and to con-
struct out of a collection of clusterings a single con-
sensus clustering. The multiple segmentations in the
sense of (Hoiem et al., 2005; Russell et al., 2006) are
5
Smets J. and Jaeger M..
Multiple Segmentation of Image Stacks.
DOI: 10.5220/0004753200050013
In Proceedings of the 3rd International Conference on Pattern Recognition Applications and Methods (ICPRAM-2014), pages 5-13
ISBN: 978-989-758-018-5
Copyright
c
2014 SCITEPRESS (Science and Technology Publications, Lda.)

segmentation analogues of cluster ensembles, not of
multiple clusterings in our sense.
In this paper we developa method for constructing
multiple segmentations of images and image stacks,
which we define as a collection of images with equal
pixel dimensions. The most import type of image
stacks are the collection of frames in a video se-
quence. However, we can also consider other such
collections of pixel-aligned images. As we will see in
the experimental section, multiple clustering of such
image stacks can give results that combine elements
of clustering at the image and at the pixel level. For
the design of our method we build on the convolution
of mixtures of Gaussians model of (Jain et al., 2008)
which we customize for the segmentation setting by
combining it with a Markov Random Field structure
to account for the spatial dimension of the data.
Our approach is intended as a general method that
can be applied to image data of quite different types,
and that thereby is a quite general tool for explorative
image data analysis. For more specialized application
tasks, our general method may serve as a basis, but
will presumably require additional modifications and
adaptations.
2 THE CONVOLUTIONAL
CLUSTERING MODEL
Probabilistic clustering approaches are based on la-
tent variable models where a data point x is assumed
to be sampled from a joint distribution P(X, L | θ)
of an observed data variable X and a latent variable
L ∈ {1,...,k}, governed by parameters θ (throughout
this paper we use bold symbols to denote tuples of
variables, parameters, etc.; when talking about ran-
dom variables, then uppercase letters stand for the
variables, and lowercase letters for concrete values of
the variables). Clustering then is performed by learn-
ing the parameters θ, and assigning x to the cluster
with index i for which P(X = x,L = i | θ) is maximal.
This probabilistic paradigm is readily generalized
to multiple clustering models. One only needs to
design a model P(X,L | θ) containing multiple la-
tent variables L = L
1
,...,L
m
. Then the joint assign-
ment L
1
= i
1
,...,L
m
= i
m
(abbreviated L = i) maxi-
mizing P(X = x,L
1
= i
1
,...,L
m
= i
m
| θ) defines the
cluster indices for x in m distinct clusterings. Mod-
els for multiple clustering that are based on multiple
latent variables include the factorial Hidden Markov
Model (Ghahramani and Jordan, 1997), the factorial
Markov Random Fields of (Kim and Zabih, 2002),
convolution of mixtures of Gaussians (Jain et al.,
2008), the latent tree models of (Poon et al., 2010),
L
i,1
L
i,2
X
i
Figure 1: Multi-layer Hidden Markov Random Field.
and the factorial logistic model of (Jaeger et al.,
2011).
2.1 The Probabilistic Model
Our model is structurally identical to the factorial
Markov Random Field model of (Kim and Zabih,
2002). Figure 1 shows the structure of such a multi-
layer hidden Markov random field: with each pixel
i ∈ I (I the set of all pixels) are associated m la-
tent variables L
i,•
= L
i,1
,...,L
i,m
and a vector of ob-
served variables X
i
. For k = 1,..., m the variables
L
•,k
= L
1,k
,...,L
|I|,k
take values in the set {1, ...,n
k
},
so that the kth segmentation will consist of n
k
seg-
ments.
For this paper we assume that in the case of single
image analysis, X
i
is simply the 3-dimensional vec-
tor (R
i
,G
i
,B
i
) of rgb-values at pixel i. In the case
of image stacks with N images, X
i
will be a 3 · N-
dimensional vector containing the rgb-values of all
images in the stack. We denote with | X |
i
the dimen-
sion of X
i
. Though we do not explore this in the cur-
rent paper, we note that X
i
could also contain differ-
ently defined observed features of pixel i.
For every k = 1,.. .,m, the latent variables L
•,k
form a Markov random field with a square grid struc-
ture. The distribution of X
i
depends conditionally on
the latent variables L
i,•
.
The marginal distribution P(L | θ) is defined as a
product of m Potts models defined by a common tem-
perature parameter T:
P(L = l | θ) = P(L = l | T) =
1
Z
m
∏
k=1
e
V(L
•,k
=l
•,k
)/T
where Z is the normalization constant, and
V(L
•,k
= l
•,k
) =
∑
i, j:i∼ j
I(l
i,k
6= l
j,k
)
with I(l
i,k
6= l
j,k
) = 1 if l
i,k
6= l
j,k
, and = 0 otherwise.
For the conditional distribution P(X | L, θ) the
model of Figure 1 implies conditional independence
ICPRAM2014-InternationalConferenceonPatternRecognitionApplicationsandMethods
6

for different pixels of the observed pixel features X
i
given the latent pixel variables L
i,•
. Moreover, we
assume that the conditional model P(X
i
| L
i,•
,θ) is
identical for all i. It is defined as the convolution
of m mixtures of Gaussians as follows. For k =
1,.. .,m and j = 1, ... ,n
k
let µ
k, j
∈ R
|X
i
|
. Writing
µ
k
= µ
k,1
,...,µ
k,n
k
, we obtain for everyk a distribution
for a variable Z
i,k
defined as a mixture of Gaussians
P(Z
i,k
| L
i,k
,µ
k
) =
n
k
∑
j=1
N(µ
k, j
,1)I(L
i,k
= j),
where 1 stands for the unit covariance matrix. For two
distributions P(Y),P(Z) of two k-dimensional real
random variables Y,Z, we denote with P(Y) ∗ P(Z)
their convolution, i.e., the distribution of the sum
X = Y + Z. The final model for X
i
now is defined
as the m-fold convolution:
P(X
i
| L
i,•
,µ
1
,...,µ
m
) =
P(Z
i,1
| L
i,1
,µ
1
) ∗ ·· · ∗ P(Z
i,m
| L
i,m
,µ
m
).
Combining the model for L and X | L, We now
obtain
log(P(L = l,X = x | µ,T)) ≈
− 1/T
m
∑
k=1
∑
i, j:i∼ j
I(l
i,k
6= l
j,k
)
−
∑
i∈I
k x
i
−
m
∑
k=1
µ
k,l
i,k
k
2
(1)
2.2 The Regularization Term
Maximizing the log-likelihood (1) alone is a sound
approach to probabilistic multiple segmentation.
However, (Jain et al., 2008) suggest to add to the like-
lihood the regularization term
−λ
∑
k,k
′
=1,...,m
k6=k
′
∑
j=1,...,n
k
j
′
=1,...,n
k
′
(µ
k, j
· µ
k
′
, j
′
)
2
(2)
Here λ ≥ 0 is a weight parameter that regulates the
strength of the influence of the regularization term.
This penalty term is minimized when the means
µ
k
,µ
k
′
corresponding to different segmentations lie
in orthogonal subspaces. The rationale given for
this regularization term is twofold. First, the like-
lihood function (1) does not have a unique maxi-
mum. Indeed, taking the case m = 2, the two so-
lutions (µ
1,1
,...,µ
1,n
1
,µ
2,1
,...,µ
2,n
2
,T) and (µ
1,1
+
c,...,µ
1,n
1
+ c,µ
2,1
− c,..., µ
2,n
2
− c,T) (c ∈ R
3
) de-
fine the same distribution, and thereforehave the same
likelihood score. Second, the likelihood alone does
not give an explicit reward for the distinctness, or
complementarity, of the resulting multiple cluster-
ings. Following other approaches to multiple clus-
tering, it is hoped that encouraging the means corre-
sponding to different clusterings to lie in orthogonal
subspaces will lead to a greater diversity of those clus-
terings.
We argue that the form and justification for this
particular regularization term is slightly flawed, and
that it should be replaced by a modified version. First,
we note that the non-uniqueness of the optimal so-
lution for (1) is not a real problem as long as two
different optimal solutions define the same multiple
segmentation. This, however, is exactly the case for
the two solutions distinguished by the offset vector c
as described above. Second, regularization with (2)
is not invariant under simple shifts of the coordinate
system: adding a constant vector z to all data-points
x
i
should have no effect on the optimal segmentation,
which should be characterized by also adding z to all
model parameters µ
k, j
. Since (2) is not invariant un-
der addition of a constant to all µ
k, j
, this is not the be-
havior one obtains with this regularization term. We
therefore propose to modify (2) so as to reward means
µ
k
,µ
k
′
to lie in orthogonal affine sub-spaces, rather
than orthogonal linear sub-spaces. Thus, we propose
the following regularization term:
− λ
∑
k,k
′
=1,...,m
k6=k
′
∑
j,h=1,...,n
k
:j<h
j
′
,h
′
=1,...,n
k
′
:j
′
<h
′
µ
k, j
− µ
k,h
k µ
k, j
− µ
k,h
k
·
µ
k
′
, j
′
− µ
k
′
,h
′
k µ
k
′
, j
′
− µ
k
′
,h
′
k
2
. (3)
Thus, we reward solutions in which normalized
difference vectors between the means of different lay-
ers are orthogonal, rather than the means themselves.
The term (3) now is invariant under adding, respec-
tively subtracting, a constant vector c to all means of
two different layers, and hence we again have the non-
uniqueness of optimal solutions as for the pure like-
lihood (1). However, as argued above, we do not see
this as a problem.
One small practical problem arises when we de-
fine our objective function as the sum of (1) and (3):
the likelihood term (1) increases in magnitude lin-
early with the number of pixels. The regularization
term, on the other hand, only increases as a function
of the number of layers and the number of segments
per layer. The choice of an appropriate tradeoff pa-
rameter λ between likelihood and regularization term,
thus, would depend on the number of pixels. In order
MultipleSegmentationofImageStacks
7

to get a more uniform scale for λ across different ex-
periments, we therefore normalize the regularization
term with the factor |I| /K, where K is the number of
terms in the sum (3).
We remark that the probabilistic model (1) alone
also has some built-in capability to encourage a di-
versity in the parameters µ
k
for different layers, and
hence, in the different segmentations. This is because
having two layers with verysimilar means µ
k
does not
allow a much better fit to the data than a single layer
with those means. Exploiting the full parameter space
of the model to obtain a good fit to the data, thus, will
tend to lead to some diversity in the parameters µ
k
.
For this reason, in our experiments, we also pay par-
ticular attention to the case λ = 0, i.e., segmentation
according to the pure probabilistic model (1).
2.3 Clustering Algorithm
We take the model parameter β := 1/T and the reg-
ularization parameter λ as user-defined inputs that
may be varied in an iterative data exploration pro-
cess. Large values of β mean that high emphasis is
put on segmentations with large connected segments
and smooth boundaries. Larger values of λ mean that
diversity of segmentations as measured by the regu-
larization term (3) is more strictly enforced.
Thus, the only model-parameterswe have to fit are
the mean vectors µ
k
. Our goal, then, is to maximize
a score function S(µ
1
,...,µ
m
,l) which is given as the
sum of (1) and (3).
We use a typical 2-phase iterative process for this
optimization: in a MAP-step we compute for a cur-
rent setting of the µ
k
the most probable assignment
L = l for the latent variables according to the likeli-
hood function (1) (since (3) does not depend on l, we
can ignore it in this phase). In a M(aximization)-step
we recompute for the current setting L = l the µ
k
op-
timizing S(µ
1
,...,µ
m
,l). This well-known clustering
approach (sometimes referred to as hard EM) has also
been proposed for image segmentation in (Chen et al.,
2010).
2.3.1 MAP-step
For the MAP-step we make use of the α-expansion
algorithm of (Boykov et al., 2001; Kolmogorov and
Zabin, 2004; Boykov and Kolmogorov, 2004). This
algorithm provides solutions to segmentation prob-
lems characterized by an energy function E for seg-
mentations s, which are of the form
E(s) =
∑
i, j:i∼ j
V
i, j
(s(i),s( j)) +
∑
i
D
i
(s(i)), (4)
where s(i) is the segment label of pixel i, V
i, j
is a
penalty function for discontinuities in s, and D
i
is
any non-negative function measuring the discrepancy
of the label assignment s(i) with the observed data
for i. It is shown in (Boykov et al., 2001) that if
V
i, j
(s(i),s( j)) is a metric on the label space, then the
α-expansion algorithm is guaranteed to find a solu-
tion s that is within a constant factor of the globally
minimal energy E().
Up to a change of sign (and a corresponding
change from a minimization to a maximization ob-
jective) our likelihood function (1) has the form (4)
for the m-dimensional label space ×
m
k=1
{1,...,n
k
}
(i.e. s(i) = (l
i,1
,...,l
i,m
)), with V
i, j
(s(i),s( j)) =
∑
m
k=1
I(l
i,k
6= l
j,k
) and D
i
(s(i)) =k x
i
−
∑
m
k=1
µ
k,l
i,k
k
2
.
Furthermore, it is straightforward to see that our
V
i, j
is a metric on the m-dimensional label space.
To use the α-expansion algorithm we flatten our
m-dimensional label space to a one-dimensional label
space with
∏
m
k=1
n
k
different labels. Thus, our method
has a complexity that is exponential in the number
of layers. On the other hand, the α-expansion algo-
rithm in practice is quite efficient as a function of the
number of pixels. It is reputed to show a linear com-
plexity in practice (Boykov et al., 2001), which was
confirmed by our observations in our experiments.
2.3.2 M-step
The M-step is performed by gradient ascent, leading
to a local maximum of the score function given the
current segmentation L = l.
2.3.3 Implementation
The algorithm is implemented in Matlab, using the α-
expansion implementation provided by the gco-v3.0
library available on http://vision.csd.uwo.ca/code/.
3 EXPERIMENTS
In all our experiments we construct multiple segmen-
tations with the same number of segments in each
layer. We therefore refer to a multiple segmentation
with m layers and k segments in each layer as a (m,k)-
segmentation.
3.1 Single Images
Our first experiment establishes the baseline result
that the segmentation methods works as intended
when the input closely fits the underlying model-
ing assumption. To this end we construct the image
ICPRAM2014-InternationalConferenceonPatternRecognitionApplicationsandMethods
8
shown in Figure 2 (c) as the overlay of the two im-
ages (a) and (b), and used our method to construct
(2,3)-segmentations from the single input image (c).
First setting λ = β = 0, we performed 200 runs of the
algorithm with different random initializations. The
highest-scoringsolution that was foundconsists of the
segmentations (d) and (e). In these figures, the color
of the jth segment in the kth layer is set to ˜µ
k, j
, where
˜µ
k, j
is obtained from µ
k, j
by applying min-max nor-
malization to re-scale the components of all the mean
vectors µ
k
(k = 1,...,m) into the interval [0..255] of
proper rgb-values. Essentially the same optimal result
was found in 9 out of the 200 runs. In the remain-
ing runs the algorithm converged to local minima, an
example of which is shown by (f) and (g). These re-
sults were clearly identified by the algorithm as sub-
optimal by being associated with significantly lower
score function values.
With increasing λ parameter the results in this ex-
periment deteriorated. At λ = 5000 the “correct” so-
lution was not found in 200 restarts. This is not very
surprising, since for this image with λ = β = 0 the
correct solution is clearly distinguished as the solution
that can achieve a perfect score of 0 on the remaining
Euclidean part of the likelihood term (1).
(a)
(b)
(c)
(d) (e)
(f) (g)
Figure 2: Baseline: overlay image.
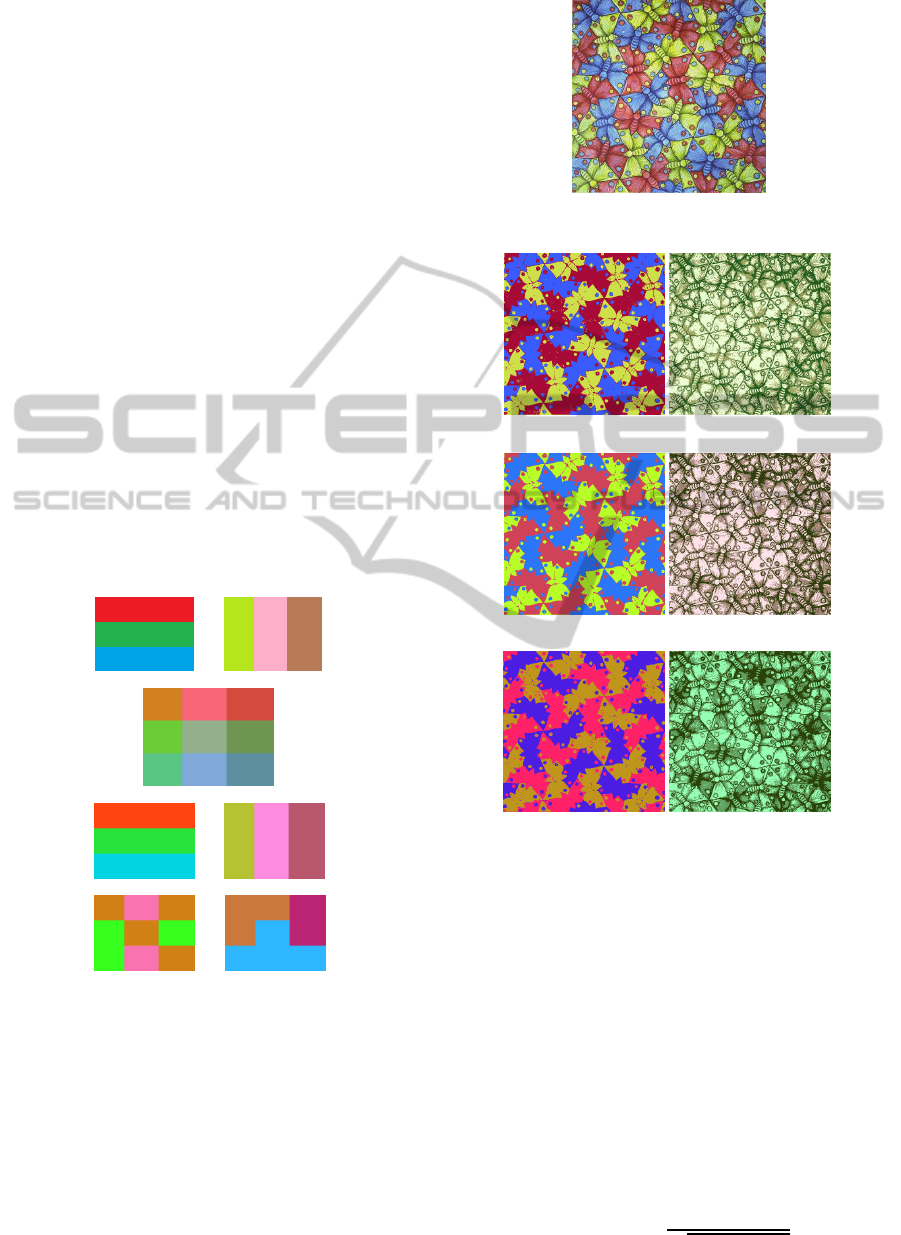
Next, we perform a series of experiments on the
butterflies image by M.C. Escher, shown in Figure 3,
which has previously been used in (Qi and Davidson,
2009). The size of this image is 402x401 pixels.
We first compute (2,3)-segmentations with vary-
ing values of λ (and β = 0). Figure 4 shows the high-
est scoring results (in 20 restarts) obtained for λ =
0,1000,10000. In all cases, essentially the same two
segmentations are computed: one that corresponds
to the main colors of the three types of butterflies
Figure 3: Escher’s butterflies.
λ = 0
λ = 1000
λ = 10000
Figure 4: Escher (2,3)-segmentations, varying λ
in the image, and one that captures the finer struc-
ture of the borders between the butterflies, as well
as the shading inside the butterflies. The main ef-
fect of the regularization term here is not a differ-
ence in the segmentations, but only a difference in
the means associated with the segments: for the high
value λ = 10000, the means in the second segmenta-
tion all have a strong green component, whereas the
means of the first component only have weak green
components. This makes the means of the two com-
ponents lie in near-orthogonalaffine spaces. A similar
color-separation does not appear at λ = 0.
A common way to measure dissimilarity of two
clusterings L
1
,L
2
is normalized mutual information
NMI(L
1
,L
2
) =
MI(L
1
,L
2
)
p
H(L
1
)H(L
2
)
,
MultipleSegmentationofImageStacks
9

where MI is the mutual information and H() the en-
tropy of L
1
,L
2
, as determined by the empirical joint
distribution of L
1
,L
2
defined by the cluster assign-
ments of the pixels. Low values of NMI indicate sta-
tistical independence, and hence dissimilarity of clus-
terings. Furthermore, a justification given by (Jain
et al., 2008) for the regularization term (2) is that it
induces a bias towards statistically independent clus-
terings. This justification carries over to our modified
version (3). Therefore, the NMI as an evaluation mea-
sure is quite consistent with our objective function.
However, while low values of the regularization
term can be due to statistical independence of the
segmentations, this is not a strict correlation. As
discussed above, the increasing weight of the regu-
larization term in Figure 4 only leads to a shift of
the mean rgb-vectors without a noticeable change in
the segmentations. This leads to an improvement in
the value of the regularization term from 8.28 · 10
6
at λ = 1000 to 1.82 · 10
6
at λ = 10000 (at λ = 0
no regularization term is computed). However, the
NMI values for the three solutions of Figure 4 are
8.4·10
−3
,5.4·10
−2
,7.1·10
−2
for λ = 0,1000, 10000,
respectively. Thus, the NMI values are even slightly
increasing for larger λ-values.
We note at this point that NMI values have to
be used with caution when assessing dissimilarity of
image segmentations (rather than other types of data
clusterings): NMI is a function only of cluster mem-
bership of pixels. However, for segmentations one
is perhaps more interested in the borders defined be-
tween segments, than in the global grouping of pix-
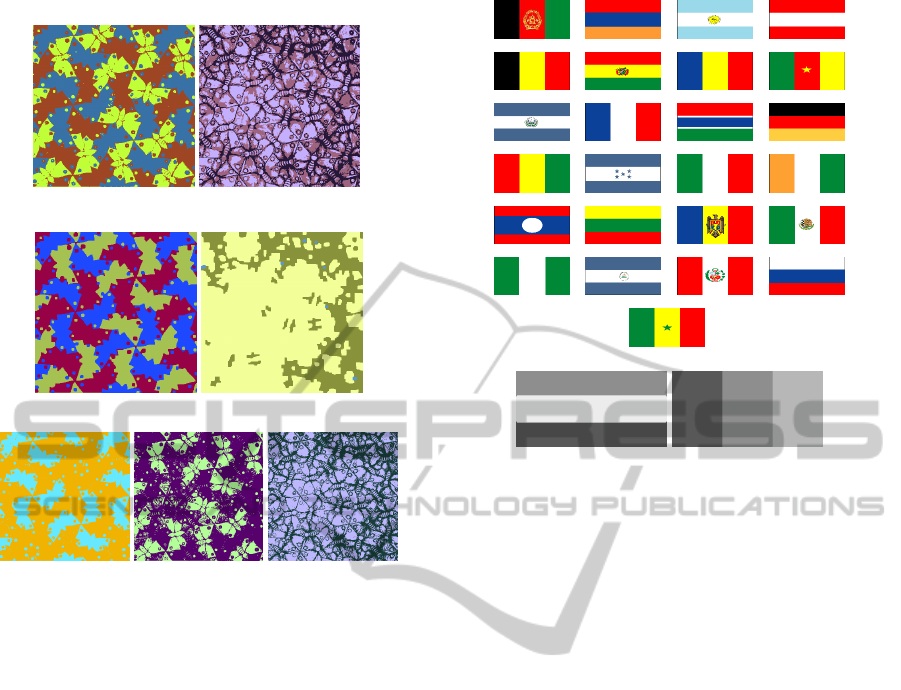
els into segments. Figures 5-7 illustrate this issue.
Figure 5 shows a modified version of Escher’s but-
terflies in which we have superimposed an additional
square grid structure on the butterfly image. Figure 6
is shows a hypothetical (2,4)-segmentation (not com-
puted by our method) of this image. Both segmenta-
tions identify the grid structure – the first one dividing
the structure according to columns (and background),
the second according to rows (and background). For
the non-background pixels row and column member-
ship are independent random variables. The mutual
information of the two segmentations therefore re-
duces to −P(b)logP(b) − (1 − P(b))log(1 − P(b)),
where P(b) is the probability of background pixels
(i.e. the relative image area covered by background).
In the limit where the size of the squares is increased,
and P(b) → 0, the mutual information of the two seg-
mentations, thus, goes to zero (and so does the nor-
malized mutual information). This shows that dissim-
ilarity as measured by low mutual information need
not correspond to the kind of complementarity we
may be looking for in different segmentations. Fig-
Figure 5: Butterflies with squares
Figure 6: Segmentations with low mutual information.
ure 7 shows the (2,4)-segmentation actually obtained
by our method. The result shown is for λ = 0, but re-
sults for higher λ-values are similar. Clearly, we will
not obtain segmentations similar to those in Figure 6,
since these would score very poorly in the likelihood
term (1), and their low NMI score also would not be
reflected in a low value of the regularization term.
We see, thus, that neither need there be a good
correspondence between low NMI values and com-
plementarity of segmentations in the intuitive sense,
nor does the regularization term necessarily induce a
strong bias towards low NMI solutions. Fortunately,
as Figure 7 shows, the likelihood score alone is quite
successful in producing segmentations that are com-
plementary in an intuitively meaningful sense.
In the next experiment we keep λ = 0 fixed, and
vary β = 1000, 16000. As the results in Figure 8 show,
the effect is quite consistent with expectations: the al-
ready fairly smooth first segmentation remains quite
stable (even though some further smoothing of the
borders occurs), whereas the smoothing of the ini-
tially rather fragmented second segmentation leads
to an eventual dissolving of the structure, including
the elimination of one of the three segments (we note
Figure 7: Actual (2,4)-segmentation for butterflies with
squares.
ICPRAM2014-InternationalConferenceonPatternRecognitionApplicationsandMethods
10
β = 1000
β = 16000
Figure 8: Escher (2,3)-segmentations, varying β.
Figure 9: Escher (3,2)-segmentation.
that we here always manually label segmentations as
“first” and “second” to facilitate the comparison; the
algorithm may return either segmentation with index
1 or 2).
Finally, we perform a (3,2)-segmentationwith λ =
β = 0. The result is shown in Figure 9. The first seg-
mentation again is based on the main underlyingcolor
distribution, isolating the blue butterflies from the
rest. The last segmentation again represents mostly
the border structure and shading. Finally, the segmen-
tation in the middle is mostly identifying the green
butterflies, but also represents some structure. (Qi and
Davidson, 2009) present a (2,2)-segmentation for the
butterfly image obtained from their iterative cluster-
ing method. Their two segmentations are quite simi-
lar in nature to the first two in Figure 9.
3.2 Image Stacks
As a first experiment with an image stack, we used the
collection of 25 flag-images shown in Figure 10 (each
at a resolution of 150× 75 pixels).
Again setting λ = β = 0, the highest scoring (2,3)-
segmentation is shown at the bottom of Figure 10.
Here we now depict the different segments using arbi-
trarily chosen greyscale values. The means µ
k, j
char-
acterizing segments now are 3 · 25 dimensional vec-
tors that can be interpreted as an average color se-
Figure 10: Stack of flag images.
quence for pixels in a segment. Taking for visualiza-
tion the average over all colors in the sequence typi-
cally leads to all segments represented by very similar
brownish colors (although, curiously, in this particu-
lar case the average colors for the segmentation with
the vertical stripes yield a somewhat washed-out look-
ing French flag). The same “correct” solution here
was found in 9 out of 50 random restarts.
A second image stack we constructed consists of
10 images each of trains and horses, as shown in Fig-
ure 11. We performed (2,3)-segmentation with λ = 0
and β = 50. The highest scoring result within 400
runs is shown at the bottom of Figure 11. The method
identifies the main structures in the two groups of im-
ages also in this somewhat more diverse collection of
images. The results in the different runs were rela-
tively stable, with other high-scoring solutions simi-
lar to the top-scoring one. Results with lower scores
often separated the two groups of images less clearly,
or contained segmentations in which on segment was
reduced to very few pixels.
In all our experiments results were quite robust
under variations of the λ and β parameters. Good re-
sults are typically already obtained at the baseline set-
ting λ = β = 0. Note that β = 0 means that the Markov
random field structure of the model is ignored, and
that the MAP step could be implemented in a much
simplified manner. In applications where smooth and
contiguous segments are required, settings of β > 0
will be needed. The impact of the λ parameter on the
segmentations was rather small. It appears that larger
values of λ affected the placement of the mean pa-
rameters representing the different segments, but not
MultipleSegmentationofImageStacks
11

Figure 11: Stack of Horse and Train images.
so much the resulting segmentations themselves.
We close this section with some information on
the runtimes of our experiments: a single run of a
(2,3) or (3,2)-segmentation of the 402x401 pixel but-
terfly image takes about 1 minute on average, with
an average of about 8 iterations of MAP and M steps
until our termination criterion is met that the score
improvement in one iteration is less than 2%. The
same experiments with the image at twice the resolu-
tion take about twice as long. The average runtime for
the Horse-Train image stack also is about 1 minute.
The higher dimensionality of the feature vector here
is offset by the smaller number of pixels at the res-
olution of 151x151 for the images in the stack. For
the Horse-Train stack most of the computation time
(about 90%) is taken by the M step, which is more
affected by the dimensionality of the feature vector.
For the butterfly image, on the other hand, most of the
time (approx. 70%) is spent on the MAP step.
4 CONCLUSIONS
We have introduced a method for constructing mul-
tiple segmentations of image stacks by combining
the convolution of mixtures of Gaussians model (Jain
et al., 2008) with a multi-layer Markov Random field.
While novel in this form, the resulting model is a quite
straightforward combination of existing components.
The main original contributionof this paper is the first
dedicated investigation of multiple clustering for im-
age segmentation, and the introduction of (multiple)
segmentation of image stacks. We note that the latter
is different from cosegmentation (Rother et al., 2006)
and standard video segmentation, where also “stacks”
of images are segmented simultaneously, but where a
separate segmentation is computed for each image (or
frame).
We have conducted a range of experiments that
demonstrate that the method is able to produce mean-
ingful results in a broad variety of datasets. Applied
to single images, it is able to identify the structures
of multiple constituent components. Applied to im-
age stacks, it can perform a simultaneous clustering
at the image and at the pixel level. All these results
were obtained using only the basic rgb pixel features.
No task-specific preprocessing or feature engineer-
ing was needed to obtain our results. One can thus
conclude, that the proposed method provides a useful
baseline approach for explorative image analysis.
For more specific application purposes or data
analysis objectives, it will be necessary to construct
more specific pixel features. One possible such appli-
cation domain is multiple segmentation of video se-
quences. The frames of a video can obviously be seen
as an image stack. Using only the rgb pixel features
our method is not very well adapted to video analysis,
since it does not take into account the temporal order
of the frames. New pixel features that capture some
of the temporal dynamics of the pixel values can be
constructed, for example, simply by considering the
variance of the pixel’s rgb values, or by constructing
features that describe the trajectory of the pixel’s rgb
values in rgb-space. Performing multiple segmenta-
tion of video sequences based on such features is a
topic for future work.
In this paper we have also tried to evaluate the
usefulness of regularization terms along the lines pro-
posed in (Jain et al., 2008) for stimulating diversity in
the multiple segmentations. Our results lead to some
doubts both with regard to the effectivenessof the reg-
ularization term to produce segmentations with low
mutual information, and with regard of the usefulness
of mutual information as a measure for diversity in
image segmentations. On the other hand, our results
ICPRAM2014-InternationalConferenceonPatternRecognitionApplicationsandMethods
12

indicate that the likelihood term (1) alone is quite ca-
pable of identifying the most relevant, distinct seg-
mentations.
REFERENCES
Boykov, Y. and Kolmogorov, V. (2004). An experi-
mental comparison of min-cut/max- flow algorithms
for energy minimization in vision. Pattern Analy-
sis and Machine Intelligence, IEEE Transactions on,
26(9):1124–1137.
Boykov, Y., Veksler, O., and Zabih, R. (2001). Fast ap-
proximate energy minimization via graph cuts. Pat-
tern Analysis and Machine Intelligence, IEEE Trans-
actions on, 23(11):1222–1239.
Chen, S., Cao, L., Wang, Y., Liu, J., and Tang, X. (2010).
Image segmentation by map-ml estimations. Image
Processing, IEEE Transactions on, 19(9):2254–2264.
Cui, Y., Fern, X., and Dy, J. (2007). Non-redundant multi-
view clustering via orthogonalization. In Proceedings
of Seventh IEEE International Conference on Data-
Mining (ICDM 2007), pages 133 – 142.
Ghahramani, Z. and Jordan, M. (1997). Factorial hidden
Markov models. Machine Learning, 29(2-3):245–
273.
Hoiem, D., Efros, A., and Hebert, M. (2005). Geometric
context from a single image. In Computer Vision,
2005. ICCV 2005. Tenth IEEE International Confer-
ence on, volume 1, pages 654–661 Vol. 1.
Jaeger, M., Lyager, S. P., Vandborg, M. W., and Wohlge-
muth, T. (2011). Factorial clustering with an ap-
plication to plant distribution data. In Proceed-
ings of the 2nd MultiClust Workshop: Discover-
ing, Summarizing and Using Multiple Clusterings,
pages 31–42. Online proceedings http://dme.rwth-
aachen.de/en/MultiClust2011.
Jain, P., Meka, R., and Dhillon, I. S. (2008). Simultaneous
unsupervised learning of disparate clusterings. Statis-
tical Analysis and Data Mining, 1(3):195–210.
Kato, Z., Pong, T.-C., and Qiang, S. G. (2003). Unsuper-
vised segmentation of color textured images using a
multilayer mrf model. In Proceedings or the IEEE
International Conference on Image Processing (ICIP
2003), volume 1, pages 961–964. IEEE.
Kim, J. and Zabih, R. (2002). Factorial Markov random
fields. In Heyden, A., Sparr, G., Nielsen, M., and Jo-
hansen, P., editors, Computer Vision – ECCV 2002,
volume 2352 of Lecture Notes in Computer Science,
pages 321–334. Springer Berlin Heidelberg.
Kolmogorov, V. and Zabin, R. (2004). What energy func-
tions can be minimized via graph cuts? Pattern Anal-
ysis and Machine Intelligence, IEEE Transactions on,
26(2):147–159.
M¨uller, E., G¨unnemann, S., F¨arber, I., and Seidl, T. (2012).
Discovering multiple clustering solutions: Grouping
objects in different views of the data. In Proceedings
of 28th International Conference on Data Engineer-
ing (ICDE-2012), pages 1207–1210.
Poon, L. K. M., Zhang, N. L., Chen, T., and Wang, Y.
(2010). Variable selection in model-based clustering:
To do or to facilitate. In Proceedings of the 27th In-
ternational Conference on Machine Learning (ICML-
2010, pages 887–894.
Qi, Z. and Davidson, I. (2009). A principled and flexi-
ble framework for finding alternative clusterings. In
Proceedings of the 15th ACM SIGKDD international
conference on Knowledge discovery and data mining
(KDD-09), pages 717–725.
Rother, C., Minka, T., Blake, A., and Kolmogorov, V.
(2006). Cosegmentation of image pairs by histogram
matching-incorporating a global constraint into mrfs.
In Computer Vision and Pattern Recognition, 2006
IEEE Computer Society Conference on, volume 1,
pages 993–1000. IEEE.
Russell, B., Freeman, W., Efros, A., Sivic, J., and Zisser-
man, A. (2006). Using multiple segmentations to dis-
cover objects and their extent in image collections. In
Computer Vision and Pattern Recognition, 2006 IEEE
Computer Society Conference on, volume 2, pages
1605–1614.
Strehl, A. and Ghosh, J. (2003). Cluster ensembles — a
knowledge reuse framework for combining multiple
partitions. J. Mach. Learn. Res., 3:583–617.
MultipleSegmentationofImageStacks
13
