
A Label-free Detection of Carcinoembryonic Antigen (CEA) using
Micromechanical Biosensors
Meisam Omidi
1
, Mohammadmehdi Choolaei
2
, F. Haghiralsadat
1
, M. Azhdari
3
,
N. Davodi Moghadam
4
and F. Yazdian
1
1
Faculty of New Science and Technology University of Tehran, Tehran, Iran
2
Research Institute of Petroleum Industry (RIPI), Tehran, Iran
3
Department of biochemistry, Medical University, Shahid Sadoughi University of Medical Sciences, Yazd, Iran
4
Department of Biology, Payame Noor, Yazd, Iran
Keywords: Micromechanical Biosensors, Carcinoembryonic Antigen (CEA), Surface Stress.
Abstract: we have used arrays of micromechanical biosensors to detect carcinoembryonic antigen (CEA), a protein
biomarker associated with various cancers such as colorectal, lung, breast, pancreatic, and bladder cancer.
The sensing principle is based on the surface stress changes induced by antigen–antibody interaction on the
micromechanical membrane (MM) surfaces. MM consists of a membrane suspended by four piezoresistive
sensing components. The isotropic surface stress on the membrane results in a uniaxial stress in each
sensing component, which efficiently improves the sensitivity. According to the experiments, it was
revealed that MMs have surface stress sensitivities in the order of 2 (mJ/m). This matter allows them to
detect CEA concentrations as low as 500 pg mL
-1
or 3 pM. This indicates the fact that the self-sensing MM
approach is beneficial for pathological tests.
1 INTRODUCTION
The simplest micro-electromechanical systems
(MEMS) structures are a new alternative technology
for fabricating simple, portable, fast response and
high sensitivity analytical devices for many
application areas including clinical diagnosis, food
quality control and environmental monitoring (Arlett
2011, Boisen et.al. 2011 and Alvarez and Lechuga
2010).
The central element in many traditional
mechanical biosensors is a small cantilever that is
sensitive to the biomolecule of interest. It is
possible to operate micro-cantilever sensors in two
different modes, i.e. cantilever bending (surface
stress method) and resonance response variation
(microbalance method). In the first mode, static
mode, the induced surface stress that is due to the
presence of the adsorbates results in a deflection in
the cantilever (Wu et.al. 2001), while in the second
mode, dynamic mode, the adsorbates change the
resonance frequency of a cantilever due to mass
loading (Omidi et al., 2013).
A sensitive readout system is crucial for
monitoring the deflection of cantilevers. For this
reason several read-out methods have been
presented. The most extended readout methods for
biosensing are optical, and piezoresistive ones. The
optical method is simple to implement and shows a
linear response with sub-angstrom resolution, also is
currently the most sensitive method. This method is
employed for detecting the cantilever deflection in
most studies (Omidi et al., 2013; Thunda et al.,
1994; Lang et al., 1999 and Ghatkesar et al., 2008).
Nevertheless, the optical detection mechanism
presents some disadvantages for example, bulky,
time-consuming laser alignment on each cantilever,
low applicability for large one- or two-dimensional
arrays, and the difficulty of performing
measurements in opaque liquids, such as blood, may
hinder the potential application of this method for
actual applications.
The piezoresistive sensing method is known as a
good alternative for the optical detection in
biosensing application. The benefit of this method is
that the principle works well in both liquid and gas
phase and large arrays can be realized and read-out.
Also, the technique is applicable for static as well as
dynamic measurements (Mukhopadhyay et al., 2005;
134
Omidi M., Choolaei M., Haghiralsadat F., Azhdari M., Davodi Moghadam N. and Yazdian F..
A Label-free Detection of Carcinoembryonic Antigen (CEA) using Micromechanical Biosensors.
DOI: 10.5220/0004800701340139
In Proceedings of the International Conference on Biomedical Electronics and Devices (BIODEVICES-2014), pages 134-139
ISBN: 978-989-758-013-0
Copyright
c
2014 SCITEPRESS (Science and Technology Publications, Lda.)

Aeschimann et al., 2006; Arlett et al., 2006; Boisen
and Thundat, 2009). Although piezoresistive
cantilevers have proven to be highly beneficial
detection methods, without effective mechanical
amplification schemes, their sensitivity is far below
that of optical methods. In order to overcome this
problem, several researches have focused on
applying structural modification, such as making a
through hole, (Yu et al., 2007) patterning the
cantilever surface, (Privorotskaya et al., 2008) or
variation of geometrical parameters (e.g., length,
width, and overall shapes) (Goericke et al., 2008 and
Loui et al., 2008). Although all these methods have
proven to improve the sensitivity of piezoresistive
cantilevers for surface stress sensing, they have still
not yielded significant stress amplification to make
piezoresistive detection comparable to the optical
approach, which this can be due to the fact that all
these approaches rely on suppressing one of the
isotropic stress components. Analytical
consideration of strain amplification schemes for
sensing applications based on the strategies of the
constriction and double lever geometries (Yang et
al., 2007) has resulted in the introduction of MMs,
which have shown a considerable improvement in
amplifying piezoresistive detection signals.
Yoshikawa et al. (Yoshikawa et al., 2011) have
experimentally evaluated a prototype
nanomechanical membrane and the results have
illustrated a significant sensitivity for piezoresistive
cantilevers. In comparison with the standard
piezoresistive cantilever, this study demonstrated a
factor of more than 20 times higher sensitivity than
that obtained with a standard piezoresistive
cantilever.
Presently, Lung cancer, breast cancer and
prostate cancer are considered as the most prevalent
form of cancer in Unite State. Research findings
indicate the importance of CEA as a useful marker
for early detection of various cancers such as
colorectal, lung, breast, pancreatic, and bladder
cancer, monitoring patients for disease progression,
and studying the effects of treatment (Brian et.al.
2011 and Noelia et al., 2012). It is worth mentioning
that the critical value of CEA concentration is
known as 3 ng/ml.
In this study, the performance of the signal
transduction biosensor was studied by using
different concentrations of CEA marker in human
serum albumin (HSA). A direct nano-mechanical
response of micro-fabricated self-sensing MM was
used to detect the surface stress changes of antigen–
antibody specific binding. After injecting the CEA
target, as model biocontents, the piezoresistive
responses were carefully analyzed and the feasibility
of the piezoresistive membranes for biosensing were
discussed in terms of device performance measures
such as sensitivity, accuracy, and specificity.
2 THEORETICAL
BACKGROUND
Molecular adsorptions on a surface do not only add
mass, but also can induce surface tension or surface
stress (Berger et al., 1997). As the molecules bind,
surface stress is developed — owing to electrostatic
repulsion or attraction, steric interactions, hydration
and entropic effects — and this can induce
deflection in the mechanical element. In the
piezoresistive micro/nanomechanical sensors the
electrical resistivity of a piezoresistive film varies
with the applied surface stress. The resistance of the
silicon piezoresistor is a function of stress and the
orientation of the piezoresistors. The relation
between resistivity and stress can be expressed as
(Tufte and Stelzer 1963):
0
[]{}[]
R
R
(1)
where R
0
is the isotropic resistivity of the
unstressed crystal, σ
i
is the stress components, and
the terms π
ij
the component of the piezoresistance
tensor. According to equation (1), for plain stress
(i.e., σ
z
= 0), relative resistance change can be
described as follows:
44
0
()
2
x
y
R
R
(2)
From equation (2), it is clear that (∆R/R
0
) is
completely dependent on σ
x
and σ
y
values. In
cantilevers sensors, surface stress induces an
isotropic stress, and the piezoresistive signal is
nearly zero except at the clamped end where the
isotropic symmetry is broken. Thus, the sensor
sensitivity efficiently reduces in comparison with
cantilevers when a point force is applied at the free
end. According to this problem MM approach was
presented by Yoshikawa et al. (Yoshikawa et al.,
2011).
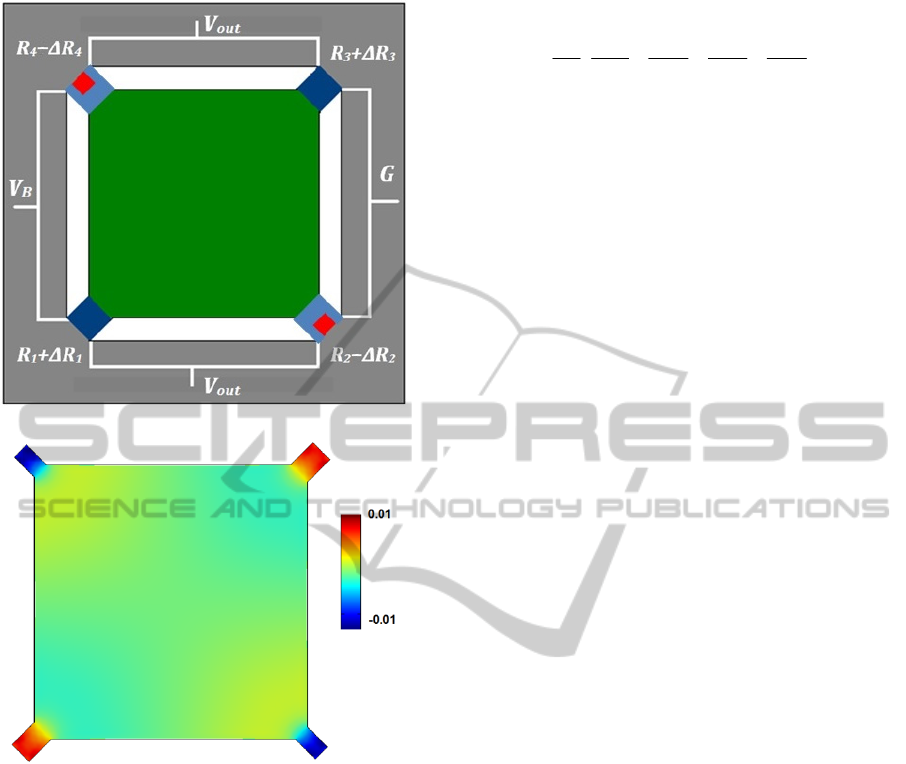
A simple illustration of the final MM sensor with
piezoresistive sensing component can be observed in
figure 1a. Owing to equation (2), isotropic surface
stress leads to zero piezoresistive signal, but in the
MM structure the isotropic deformation effectively
converts into a concentrated force at the connection
between the membrane and the piezoresistive
ALabel-freeDetectionofCarcinoembryonicAntigen(CEA)usingMicromechanicalBiosensors
135
(a)
(b)
Figure 1: (a) A schematic of the MM sensor with
piezoresistive sensing component (b) distribution of ΔR/R
on the surface of MM with a dimension of 400 μm 400 μm
2 μm when a compressive surface stress of -1.0 N/m
applied uniformly calculated by finite element analyses
(FEA) using COMSOL Multiphysics 4.2.
sensing component. Figure 1b shows (∆R/R
0
)
distribution for MM with a dimension of 400 μm x
400 μm x 2 μm, when a compressive surface stress
of -1.0 N/m is applied uniformly on the MM.
COMSOL Multiphysics 4.2 finite element software
was used for extracting (∆R/R
0
) distribution. The
number of elements for modeling the sensor was
about 25000, which gave sufficient resolution for the
present simulation.
The membrane-type geometry allows us to place
a full Wheatstone bridge on the chip, when all four
resistors are practically equal and the relative
resistance changes are small, the total output signal
V
out
can be approximated by:
3
12 4
1234
()
4
in
out
R
VRR R
V
RR RR
(3)
According to equations (1-3), the average values
of relative resistance change in the MM has a higher
value in comparison with the standard cantilever
(about 43 times) (Yoshikawa et al., 2011).
The intrinsic noise level for the modified
piezoresistor can be estimated by Johnson (thermal)
and Hooge (1/f) noise equations (Harley et al., 2000,
Yu et.al. 2002 and Hooge 1969). The total intrinsic
noise for MM is reported as 0.01- 0.5 µV
(Yoshikawa et al., 2011 and 2012), which is still
lower than the experimental noises (2.0~2.5 μV),
mainly caused by the electrical circuit.
3 EXPERIMENTAL
3.1 Fabrication of MM Sensor
We used Silicon on Insulator (SOI) wafers with a 2
μm device layer and a 0.3 μm buried oxide (BOX)
layer as the substrate material. Then a 25 nm silicon
dioxide layer was grown by a thermal oxidation to
electrically insulate the device layer from the
subsequent metal layers. The first lithographic
process to define the first metal layer for electrode
and sensor platform for subsequent liftoff process
has been accomplished. After patterning, the
photoresist, chrome (10 nm) and gold (50 nm) layers
were deposited by e-beam evaporator and patterned
by a liftoff process with the previously patterned
photoresist. The patterned metal layer from previous
step and the patterned layer of photoresist, from the
second photolithographic process were used to
define the areas to be etched to define the sensor
structure. The exposed device layer was etched
completely by RIE to define the sensor structure.
Then, a third photolithographic step for the second
liftoff process, followed by the deposition of a 30-
nm chrome layer and a 150-nm gold layer for wire-
bonding pads. After the liftoff, a release window
was photolithographically defined by the fourth
lithographic process and the exposed BOX was
etched by RIE leaving the Si substrate exposed.
Then the wafer was diced into individual chips.
Through the release window, the exposed Si
substrate was etched by vapor phase etching using
xenon difluoride (XeF
2
) to release the sensor
structure. After XeF2 etching, the photoresist and
the BOX were removed by BHF etching and solvent
cleaning. The die was cleaned with oxygen plasma
BIODEVICES2014-InternationalConferenceonBiomedicalElectronicsandDevices
136

and then a 100-nm thick silicon dioxide layer was
deposited with plasma enhanced chemical vapor
deposition (PECVD) for insulation. Chrome (20 nm)
and gold (50 nm) layers were deposited using an e-
beam evaporator for an immobilization layer for
protein–protein interaction. The PECVD oxide on
the bonding pads was selectively etched for wire-
bonding. Then each die was attached to a custom
made printed circuit board (PCB) and was wire-
bonded. Fig. 2 presents the final picture of MM
using a Scanning electron micrograph (SEM).
3.2 CEA Antibody Immobilization
Process
A fresh piranha solution (a 4:1 ratio of H
2
SO
4
(98.08%) and H
2
O
2
(34.01%)) was used to wash and
clean the membranes, in order to remove
experimental contamination of the Au surface. After
1 min, the membranes were taken out of the solution
and were rinsed using deionized water. To complete
the cleaning process, the rinsed membranes were
dried using a stream of N
2
gas. For 2 h at room
temperature in darkness a 0.1 M deoxygenated
cysteamine (Sigma, 95%) aqueous solution was used
to functionalize the devices. Then, MMs were
washed with deionized water and soaked in water
for 12 h to remove the physically adsorbed
cysteamine. Moreover, for creating a covalent cross-
linker molecule between the amine groups on the
MM surface and antibodies, chips were soaked in a
5% solution of gluteraldehyde (Sigma, 50%) in
borate buffer for 2 hours. Following this and all
subsequent steps, device chips were washed twice,
each washing step was for two minutes, in purified
DI water on an orbital shaker operating at 95 RPM.
It should be mentioned that fresh water was used
between washes. The reason of using water instead
of buffer for washing was to prevent the abundant
formation of buffer salt crystals on the surface of
devices which make the sensors effectively useless.
Next, one hour incubation was used to immobilize
the monoclonal anti- CEA (Anti-carcinoembryonic,
Sigma), affinity-purified, with a concentration of 50
mg/mL on the surface. By immersing the MM in 50
mM solution of glycine for 30 minutes unreacted
gluteraldehyde was then quenched. In addition,
dissolved bovine serum albumin (BSA, Sigma) in
phosphate buffered saline (PBS) with 10 mg/ml
concentration was used to prevent non-specific
binding. For this purpose, the membranes were
immersed in this solution for 1 h at room
temperature. Then, they were rinsed with PBS (pH
7.4) containing polyoxyethyethylenesorbitan
monolaurate (Tween 20) and finally washing was
performed by only using PBS solution.
Figure 2: Scanning electron micrograph (SEM) of 400 μm
x 400 μm x 2 μm MM.
3.3 Electrical Measurements
For the electrical measurement of sensor, internal
dc-bias Wheatstone bridge was used.
A bridge supply voltage of 1.5V was applied
using a dc power supply (Agilent, E3631A), and the
sensor output voltage was measured by a multimeter
(keithley, 2010 7-1/2). Moreover, a faraday cage
was adopted for noise reduction. The above
components were used to measure the piezoreisitive
response of the MM in a liquid environment.
4 RESULTS AND DISCUSSION
In order to reach results with high reliability, the
surfaces of the membranes were stabilized by
treating them with a PBS buffer. The PBS buffer
was directed with a typical flow rate of 0.4 – 0.5
ml/hour, for 1 h, to the MM sensor arrays using a
flexible PDMS polymer microfluidic channel sealed
to the device chip. As a general trend, at the point of
initial injection of the PBS buffer the induced
voltage of the MM increased rapidly and steadily
decreased with time, which in this case the induced
voltage of the MM reached dynamic equilibrium
after 10 min. For the bio-assay, CEA antigens were
injected into each liquid chamber, including the
ALabel-freeDetectionofCarcinoembryonicAntigen(CEA)usingMicromechanicalBiosensors
137
stabilized membrane. The liquid temperature was
precisely controlled and external noise sources were
excluded using a shield box. In order to estimate the
nonspecific adsorption on the MM surface, the
concentration of HSA in all solutions was stabilized
at 0.1 mg/ml.
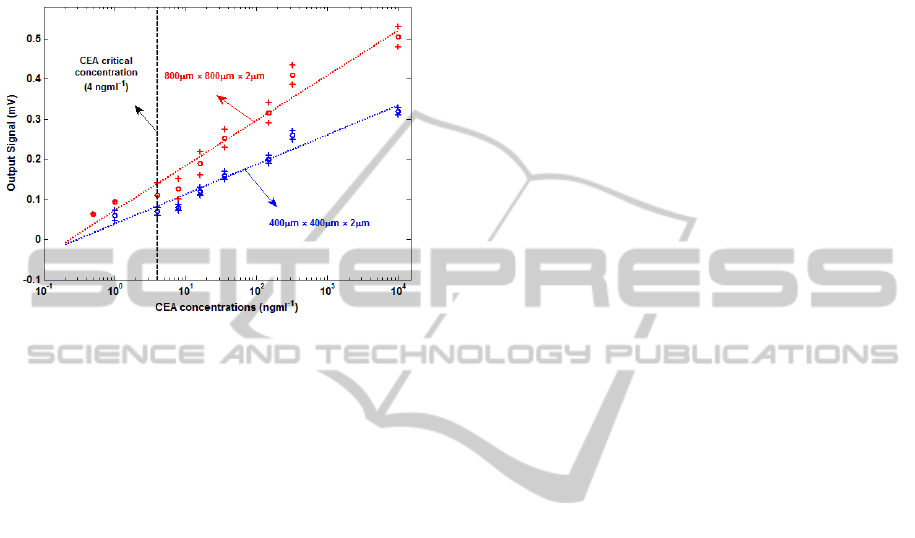
Figure 3: Steady-state output signals (V
out
) as a function of
CEA concentrations for two different MM geometries.
Every data point on this plot represents an average of
output signals obtained in multiple experiments done with
different MM, whereas the range of output signals
obtained from these experiments is shown as the error bar.
Figure 3 shows the steady-state output signals
(V
out
) as a function of CEA concentration in a HSA
background for different dimensions of MM. By
using a 400 µm x 400 µm x 2 µm MM, the lowest
CEA concentration that we could clearly detect
above noise was 1 ng/ml. However, when a 800 µm
x 800 µm x 2 µm MM was used, CEA concentration
as low as 0.5 ng/ml was detectable. This is close to
the resolution required for CEA-based diagnosis of
prostate cancer (Brian et al., 2011). The
experimental results presented a range of linearity of
0.5 ng/ mL to 10 µg/mL and 1 ng/mL to 10 µg/mL
for 800 µm x 800 µm x 2 µm and 400 µm x 400 µm
x 2 µm MM, respectively. The minimum detectable
surface stress for each sensor can be obtain when the
output signals are equal to the noise values. By using
the experimental results, 2 and 3.5 mJ/m were
respectively the minimum surface stress sensitivities
for the 800 µm x 800 µm x 2 µm and 400 µm x 400
µm x 2 µm MM.
5 CONCLUSIONS
We have reported a novel signal transduction
biosensor for detecting CEA, using a unique micro-
fabricated self-sensing array of MM sensors. Unlike
cantilever sensors, which are based on optical
readout systems, the MM integrated piezoresistive
readout sensors facilitate the detection of compact
devices in even non-transparent environments. our
unique MM design significantly improves sensor
sensitivity that allows us to detect CEA
concentrations as low as 500 pg/ mL, or 3 pM.
REFERENCES
Aeschimann L., Meister A., Akiyama T., Chui B. W.,
Niedermann P., Heinzelmann H., De Rooij N. F.,
Staufer U. and Vettiger P., Microelectron. Eng., 83
(2006) 1698.
Alvarez M. and Lechuga L. M., Analyst, 135 (2010) 827.
Arlett, J. L., Maloney, J. R., Gudlewski, B., Muluneh, M.,
Roukes, M. L. Nano Lett., 6 (2006) 10 00.
Arlett J. L., Myers E. B. and Roukes M. L., Nat.
Nanotechnol., 6 (2011) 203.
Berger R., Delamarche E., Lang H. P., Gerber C.,
Gimezewski J. K., Meyer E. and Guntherodt, H.-J.,
Science, 276 (1997) 2021.
Boisen A., Dohn S., Keller S. S., Schmid S. and Tenje M.,
Rep. Prog. Phys., 74 (2011) 036101.
Boisen A. and Thundat T., Mater. Today, 12 (2009) 32.
Brian B., Shaker A M., Nanotech. Sci. Applic, 4 (2011) 1.
Ghatkesar M. K., Lang H. P., Gerber C., Hegner M. and
Braun T., PLoS One, 3 (2008) 3610.
Goericke F. T. and King W. P., IEEE Sens. J., 8 (2008)
1404.
Guntherodt H. J., Anal. Chim. Acta 393 (1999) 59.
Harley, J.A.and Kenny, T.W., J. Microelectromech. Syst.,
9 (2000) 226.
Hooge, F. N., Phys. Lett. A, 29 (1969) 139.
Lang H. P., Baller M. K., Berger R., Gerber C.,
Gimzewski J. K., Battiston F. M., Fornaro P.,
Ramseyer J. P., Meyer E. And Guntherodt H. J., Anal.
Chim. Acta 393 (1999) 59.
Loui A., Goericke F. T., Ratto T. V., Lee J., Hart B. R.
and King W. P., Sens. Actuators, A, 147 (2008) 516.
Mukhopadhyay R., Sumbayev V. V., Lorentzen M.,
Kjems J., Andreasen P. A. and Besenbacher F., Nano
Lett., 5 (2005) 2385.
Noelia D., Paula D., Sergio M., María G., Sara P., Alberto
O. and Manuel F., Sens., 12 (2012) 2284.
Omidi M., Malakoutian M. A., Choolaei M., Chin. Phys.
Lett., 30(6) (2013) 068701.
Privorotskaya N. L. and King W. P., Microsyst. Technol.,
15 (2008) 333.
Tufte O. N., and E. L. Stelzer, J. Appl. Phys., 34 (1963)
313.
Wu G., Datar R. H., Hansen K. M., Thundat T., Cote R. J.
and Majumdar A., Nat. Biotechnol. 19 (2001) 856.
Yang, S. M., Yin, T. I. and Chang, C. Sens. Actuators. B,
121 (2007) 545.
BIODEVICES2014-InternationalConferenceonBiomedicalElectronicsandDevices
138

Yoshikawa G., Akiyama T., Gautsch S., Vettiger P., and
Rohrer H., Nano Lett., 11 (2011) 1044.
Yoshikawa G., Akiyama T., Gautsch S., Vettiger P., and
Rohrer H., Sensors, 12 (2012) 15873.
Yu, X. M.; Thaysen, J., Hansen, O. and Boisen, A., J.
Appl. Phys., 92 (2002) 6296.
Yu X. M., Tang Y. Q., Zhang H. T., Li T. and Wang W.,
IEEE Sens. J., 7 (2007) 489.
ALabel-freeDetectionofCarcinoembryonicAntigen(CEA)usingMicromechanicalBiosensors
139
