
Feature Extraction in Pet Images for the Diagnosis of Alzheimer’s Disease
Jo
˜
ao Duarte, Helena Aidos and Ana Fred
Instituto de Telecomunicac¸
˜
oes, Instituto Superior T
´
ecnico, Lisbon, Portugal
Keywords:
Computer-Aided Diagnosis, Image Classification, Image segmentation, Alzheimer’s Disease.
Abstract:
Alzheimer’s disease accounts for an estimated 60% to 80% of cases of dementia and its victims are mainly
elderly people. Recently, several computer-aided diagnosis systems have been developed, based on extracting
information from FDG-PET scans. 3-dimensional FDG-PET images, under a voxel-as-feature approach, lead
to high-dimensional feature spaces, which results in system performance problems. In order to reduce the
dimensionality of these images, multi-scale methods may be used as feature extraction. We propose a multi-
scale approach for feature extraction of 3-dimensional images to improve the performance of a diagnosis
system using clustering techniques. To evaluate the performance of our approach we applied it to a database
obtained from Alzheimer’s Disease Neuroimaging Initiative (ADNI) and compare it with Gaussian pyramid
technique. Experimental results have shown that the proposed approach is a good option for image feature
reduction, outperforming the Gaussian pyramid technique.
1 INTRODUCTION
Alzheimer’s disease (AD) is the most common type of
dementia and is characterized by gradual increasing
difficulty in remembering new information, caused by
disruption of brain cell function, which usually starts
in brain regions responsible for forming new memo-
ries (Alzheimer’s Association, 2013). Mild cognitive
impairment (MCI) is a condition in which a patient
has noticeable decreased thinking abilities, but does
not restrain the individual to perform everyday ac-
tivities (Alzheimer’s Association, 2013). People with
MCI have higher probabilities of developing AD than
cognitive normal (CN) people.
The early diagnosis of AD is very important to al-
low the patients, and their families, to take the neces-
sary arrangements that empowers patients to live in-
dependently as long as possible, and find alternatives
when this is not possible. Despite AD has no cure,
early diagnosis may improve life quality and extend
life expectancy by enabling treatments to delay the
progression of AD symptoms. In order to facilitate
early diagnosis of the AD/MCI conditions, several
computer-aided diagnosis (CAD) systems have been
proposed, usually relying in processing of neuroim-
ages, such as, fluorodeoxyglucose positron emission
tomography (FDG-PET) (Gray et al., 2012; Mart
´
ınez-
Murcia et al., 2012; Ill
´
an et al., 2011), magnetic res-
onance imaging (MRI) (Natarajan et al., 2012; Mald-
jian et al., 2003), and single photon emission com-
puted tomography (SPECT) images (Ramirez et al.,
2013). Also, some CAD systems combine several of
the previous imaging modalities (Gray et al., 2013;
Dukart et al., 2011; Zhang et al., 2011)
Analysis of neuroimages typically translates in
high-dimensional feature spaces, leading to system
performance problems (i.e. high computational and
memory costs), and also tends to lower the accu-
racy of the diagnosis. Hence, different techniques
should be used to reduce the dimensionality of the
neuroimages. Various feature extraction techniques
have been applied for the diagnosis of Alzheimer’s
disease (Segovia et al., 2012; Morgado et al., 2013b),
which are very important as the resulting features are
used to differentiate between AD, MCI and CN con-
ditions. Also, several feature selection techniques
(Savio and Gra
˜
na, 2013; Morgado, 2012) have been
used to identify which (and how many) of these fea-
tures should be used by the classification algorithms,
since many of the features are redundant or may not
have discriminative power. The selected features may
be thought as a partial view of the brain contain-
ing the most relevant regions of it, and some studies
have shown that using them improves accuracy (Mor-
gado et al., 2013a). Other studies suggest that using
volumes-of-interest may be worse that using whole-
brain information when a single imaging modality is
used, although when using several imaging modalities
561
Duarte J., Aidos H. and Fred A..
Feature Extraction in Pet Images for the Diagnosis of Alzheimer’s Disease.
DOI: 10.5220/0004808705610568
In Proceedings of the 3rd International Conference on Pattern Recognition Applications and Methods (ICPRAM-2014), pages 561-568
ISBN: 978-989-758-018-5
Copyright
c
2014 SCITEPRESS (Science and Technology Publications, Lda.)

the converse may be preferable (Dukart et al., 2011;
Dukart et al., 2013).
We present a dimensionality reduction approach
based on data clustering to reduce the high-
dimensional feature space of neuroimages. This ap-
proach may be used with several imaging modalities
and/or combined with other feature extraction tech-
niques. In this paper, our approach is applied to the
voxel intensities of FDG-PET images and compared
with a scale-space representation using the Gaussian
pyramid technique in three classification problems:
AD vs CN, MCI vs CN, and AD vs MCI.
The remaining of this paper is organized as fol-
lows. Section 2 describes the feature extraction, selec-
tion, and classification steps included in the method-
ology presented in this paper. Section 3 exhibits the
data set, the experimental design and the correspond-
ing results. Finally, section 4 concludes this paper.
2 METHODOLOGY
Our goal is to diagnose the condition of a given pa-
tient using its FDG-PET scan by learning from a set
of labeled images whose conditions are known. We
use voxel intensities, V (x, y, z), obtained directly from
the FDG-PET scan, to identify the condition of a pa-
tient. V (x, y, z) denotes the value of the FDG uptake
detected at the voxel located at the space position
(x, y, z), where x, y and z are integer numbers.
Our methodology to build a computer-aided diag-
nosis system capable of distinguishing different pa-
tient conditions has three steps: reduce the number
of features to improve system performance; select the
most important features; and, finally, train a classifi-
cation algorithm. Note that, in this work we focus in
comparing feature extraction methods, namely, one
using the Gaussian pyramid and another using data
clustering. We also compare the previous techniques
that reduce the number of features with one strategy
that uses the whole-brain information. Also, we are
using the voxel intensities of FDG-PET images but
other imaging modalities, such as MRI or SPECT,
could be used instead.
2.1 Feature Extraction using the
Gaussian Pyramid
A problem when dealing with a 3-dimensional FDG-
PET image is the huge amount of features it contains,
which may degrade the performance of pattern recog-
nition algorithms. However, the intensities of voxels
that are close in space tend to be similar and, conse-
quently, some redundant information may be elimi-
nated.
The Gaussian pyramid (Burt, 1981) is a tech-
nique that creates a sequence of images which are
smoothed using a Gaussian average, and then scaled
down. These images are successively smaller due to
subsampling, and each voxel at a given level contains
the average neighborhood’s voxel intensity of the cor-
responding voxel on the previous level of the pyramid.
The technique works as follows. In the first step,
the image is smoothed as
V
l
(x, y, z) =
2
∑
m=−2
2
∑
n=−2
2
∑
o=−2
w(m, n, o)V
l−1
(2x + m, 2y + n, 2z + o),
(1)
for l = 1, 2, ···, with V
0
(x, y, z) = V (x, y, z) where
V
l
represents the l
th
level of the pyramid, and
w(m, n, o) = w(m) · w(n) · w(o) is a weighting func-
tion or generating kernel. The level 0 corresponds
to the original image. The generating kernel used
in this work has width 5 and is defined as w(m) =
w(n) = w(o) = w
m+3
, m ∈ {−2, −1, · ·· , 2}, where
w =
1
16
[1 4 6 4 1], which resembles a Gaussian func-
tion. In the second step, the image is subsampled by
a factor of two in each of the dimensions.
Figure 1 shows an example of applying the Gaus-
sian pyramid to a 128 × 128 × 60 FDG-PET image (a
slice for each image is shown).
2.2 Feature Extraction using Data
Clustering
We propose to perform feature extraction using a data
clustering algorithm. The objective of data cluster-
ing consists of dividing a data set, X , composed of n
data objects {x
1
, ·· · , x
n
}, into K clusters {C
1
, ·· · ,C
K
}
such that similar objects, x
i
, x
j
, are placed in the same
cluster, i.e {x
i
, x
j
} ∈ C
k
, and dissimilar objects are
grouped in different clusters, i.e. x
i
∈ C
k
, x
j
∈ C
l
, k 6=
l. The resulting labels of a partition P = {P
1
, ·· · , P
n
}
indicate the cluster to which each object belongs. We
intend to group voxels in a FDG-PET image into
clusters to reduce redundant information and, conse-
quently, decrease the number of features for the clas-
sification task. The clusters should represent regions
in the 3-dimensional space with similar voxel inten-
sities. The methodology to find these regions is ex-
plained in the following.
Let V
p
(x, y, z) represent the voxel (x, y, z) of the
p
th
FDG-PET image in a database containing q im-
ages. First, a mean brain image V
∗
is computed by
averaging the corresponding voxel (x, y, z) over the
entire population:
V
∗
(x, y, z) =
1
q
q
∑
i=1
V
i
(x, y, z). (2)
ICPRAM2014-InternationalConferenceonPatternRecognitionApplicationsandMethods
562
(a) Original (b) Level 1 (c) Level 2 (d) Level 3 (e) Level 4
Figure 1: Gaussian pyramid example from a slice of a 3-dimensional FDG-PET image (all images are zoomed to the same
size).
Then, the voxels corresponding to background are
discarded, and the remaining n voxel intensities,
V
∗
(x, y, z), are stacked into a vector f = [ f
1
, ·· · , f
n
]
T
.
A vectorial representation of the data set X ∈ R
n×4
is built considering both the voxel intensities and the
corresponding position in space. This representation
is defined as
X =
f
1
posX(1) posY (1) posZ(1)
f
2
posX(2) posY (2) posZ(2)
.
.
.
.
.
.
.
.
.
.
.
.
f
n
posX(n) posY (n) posZ(n)
, (3)
where posX(i), posY (i), posZ(i) are functions that
indicate the space position of the i
th
voxel in each axis
of the 3-dimensional space. In order to bring all of the
dimensions into proportion with one another, a nor-
malization step is performed such that: a) all dimen-
sions have mean 0; b) the 3 dimensions corresponding
to space location have standard deviation 1; c) and the
dimension corresponding to the voxel intensity have
standard deviation α > 0. α is a parameter that influ-
ences the importance of voxel intensity in clustering.
Next, a partition of X into K clusters is obtained
by applying a clustering algorithm to it, and the labels
P
i
, ∀i ∈ {1, ·· · , n}, are used to identify the regions in
space.
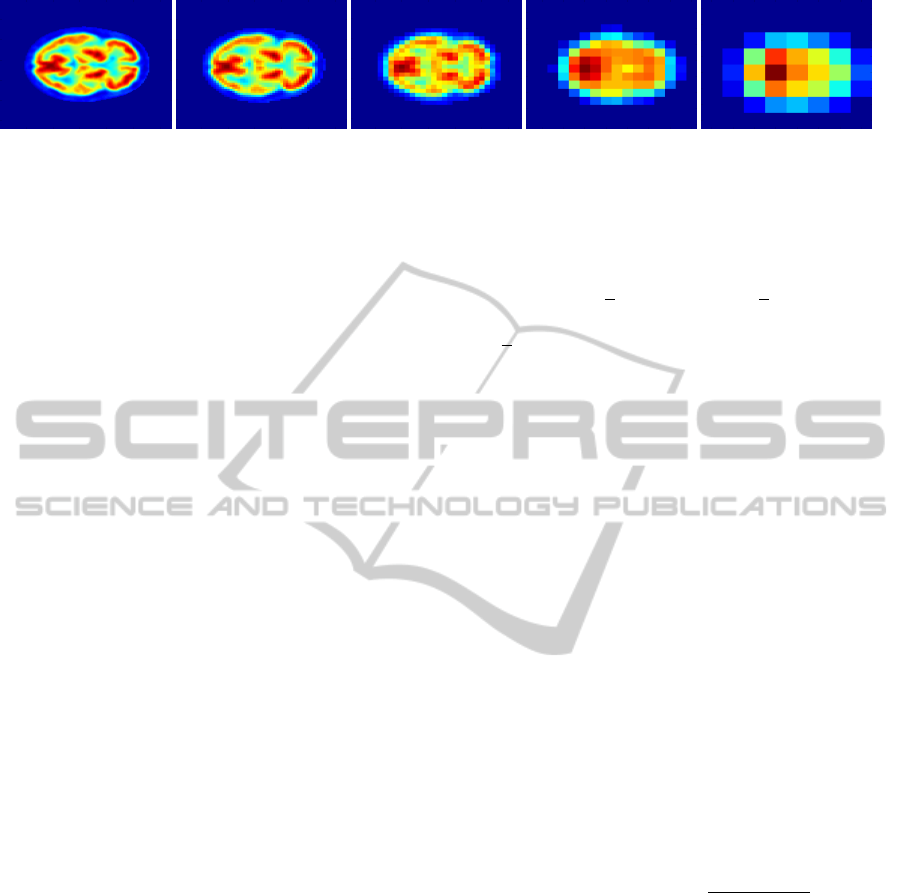
Finally, a new representation for each image V
i
is build containing K features (one for each cluster).
The value for each feature k for a patient i is com-
puted as the average intensity of the voxels belonging
to the corresponding cluster C
k
. Figure 2 shows an
example of this approach. Images obtained using a
high number of clusters are very similar to the origi-
nal one, while images obtained using few clusters are
smother.
The proposed approach has two main advantages
over the Gaussian pyramid approach: it is very easy
to specify the number of features by simply speci-
fying the number of clusters to the clustering algo-
rithm; and each resulting feature may represent space
regions with distinct shapes and size, thus the features
are more meaningful.
The well-known K-means algorithm (MacQueen,
1967) was chosen to perform the brain segmenta-
tion, due to its low-computational cost, using random
initialization of the centroids, however any cluster-
ing algorithm could be used instead. K-means (lo-
cally) minimizes the within-cluster sum of squares:
∑
K
k=1
∑
x
i
∈C
k
||x
i
− x
k
||
2
, where ||x
i
− x
k
||
2
is the Eu-
clidean distance between x
i
and its closest cluster cen-
troid x
k
.
2.3 Feature Selection using Mutual
Information
Feature selection is the process of choosing a subset
of features in a data set. The resulting data represen-
tation should improve the performance of classifiers,
reduce computational and memory costs, and facili-
tate data visualization and data understanding (Guyon
and Elisseeff, 2003). To reduce the number of fea-
tures for our task, we use mutual information (MI)
between features and class labels to rank the features
and choose the ones with higher value. Let F ∈ R
n
be a vector representing a feature in a data set, f
i
,
i ∈ {1, · ·· , n} its value for the i
th
individual in a pop-
ulation of size n, and F a random variable represent-
ing the distribution of F obtained by building a his-
togram with m bins. Also, let Y be a random variable
representing the labels of the population containing c
classes. The mutual information between the feature
F and the labels Y is computed as
MI =
m
∑
j=1
c
∑
i=1
P(F = j, Y = i)log
P(F = j, Y = i)
P(F = j)P(Y = i)
, (4)
where P(F = j) is the probability of the j
th
bin, and
P(Y = i) the probability if the i
th
class.
2.4 Image Classification
Once the feature extraction and the feature selection
steps are conducted, a supervised classification algo-
rithm is applied as the final step of the diagnostic
problem. In the learning phase, a classification algo-
rithm produces a function, using labeled data, capable
of assigning appropriate labels to unlabeled examples.
In this case, given non-redundant and labeled repre-
sentations of FDG-PET scans, the algorithm learns to
identify the condition of a new FDG-PET image. In
FeatureExtractioninPetImagesfortheDiagnosisofAlzheimer'sDisease
563

(a) Original (b) K=36209 (c) K=4723 (d) K=656 (e) K=111
Figure 2: Example of applying the clustering methodology to a 128 × 128 × 60 FDG-PET image (only a slice for each image
is shown).
Table 1: Clinical and demographic characteristics of each
class. Age and MMSE (Mini Mental State Exam) are repre-
sented by the corresponding mean values and standard de-
viations.
Attributes AD MCI CN
Number of subjects 59 59 59
Age 78.26 77.71 77.38
(±6.62) (±6.88) (±4.87)
Sex (% of males) 57.63 67.80 64.41
MMSE 19.60 25.68 29.20
(±5.06) (±2.97) (±0.92)
this paper, we consider three classification tasks: AD
vs CN, MCI vs CN, and AD vs MCI.
3 EXPERIMENTS
3.1 Data Set
In this study, we used FDG-PET images for AD, MCI
and CN subjects, retrieved from the ADNI database.
The subjects were chosen to obey a certain criteria:
the Clinical Dementia Rating (CDR) should be 0.5 or
higher for AD patients, 0.5 for MCI patients and 0 for
CN. This selection results in a dataset composed by
59, 142 and 84 subjects for AD, MCI and CN, respec-
tively. Since our task is classification using the SVM
algorithm, we decided to balanced the classes. In that
sense, 59 subjects from each MCI and CN groups
were selected randomly. Table 1 summarizes some
clinical and demographic information.
The FDG-PET images have been pre-processed
to minimize differences between images: each image
was co-registered, averaged, reoriented (the anterior-
posterior axis of each subject was parallel to the AC-
PC line), normalized in its intensity, and smoothed to
uniform standardized resolution. Details of the pre-
processing are available in the ADNI project web-
page
1
.
1
http://adni.loni.usc.edu/methods/pet-analysis/pre-processing/
3.2 Experimental Design
To assess the performance of the two feature ex-
traction approaches, we applied the methodology de-
scribed in section 2. We chose the Support Vector
Machine (SVM) (Cortes and Vapnik, 1995) using a
linear kernel as the classifier. The reason for this pref-
erence lies in the SVM being a common choice for the
purpose.
We applied the Gaussian pyramid technique to the
original voxel intensities to obtain 4 levels of feature
extraction. The clustering approach was performed,
also using the original voxel intensities, by applying
the K-means algorithm, setting the number of clus-
ters to the number of features obtained by the Gaus-
sian pyramid technique, so that we can fairly compare
both approaches. The values 2, 4 and 8 were tested
for the α parameter. Also, after the feature extrac-
tion step, the feature selection step was tested using
several number of features, as shown in table 2. Af-
ter some empirical testing, the number of bins to build
the features histograms for MI computation was set to
8, so that each bin could have a meaningful number of
points.
The parameter which controls the cost of mis-
classification in the SVM was tuned from the set
C ∈ {2
−16
, 2
−14
, 2
−12
, 2
−10
, 2
−8
, 2
−6
, 2
−4
, 2
−2
, 2
0
, 2
2
,
2
4
} using a 10 × 10 nested cross-validation proce-
dure (Varma and Simon, 2006). The nested cross-
validation procedure was repeated 20 times for better
performance assessment.
3.3 Results
Figure 3 shows the mean accuracies obtained for the
AD vs CN problem using the Gaussian pyramid with
4 levels, and the clustering approach with the cor-
responding number of clusters. Figure 3a depicts
the results obtained for the level 1 of the Gaussian
pyramid and for applying K-means with 36209 clus-
ters. The clustering approach with α = 8 obtained
the best accuracy of 87.56% using 2500 features, fol-
lowed by the Gaussian pyramid using 250 features
with 87.55%. The differences are not significant in
ICPRAM2014-InternationalConferenceonPatternRecognitionApplicationsandMethods
564
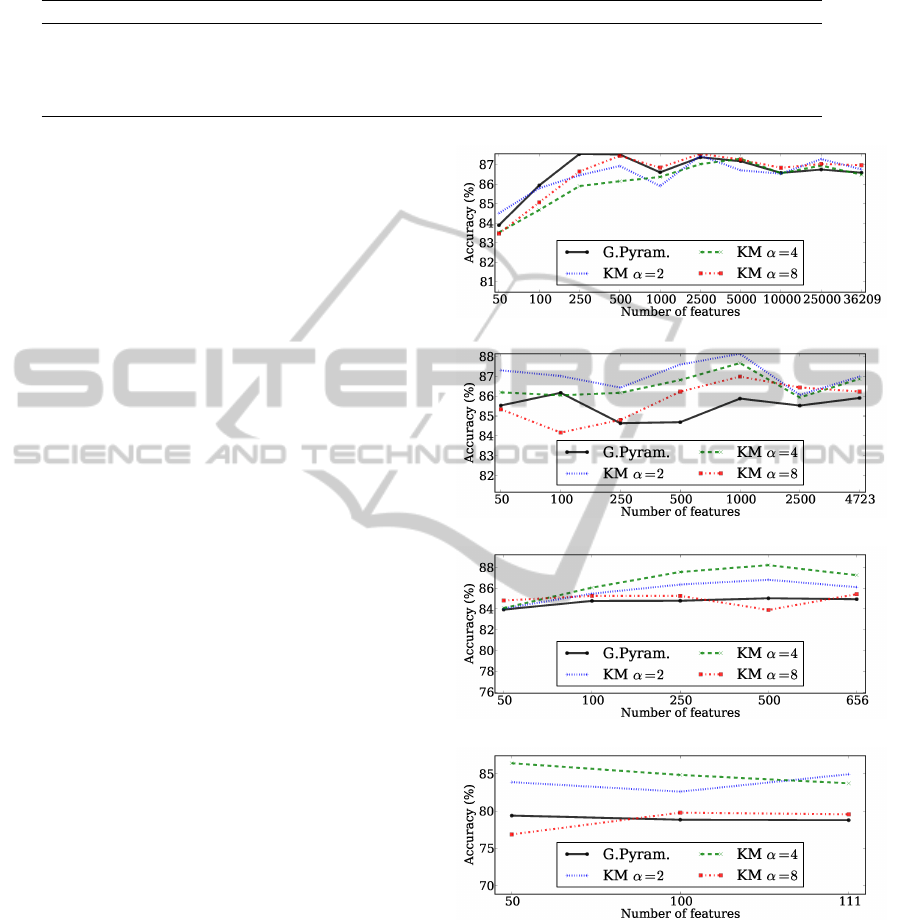
Table 2: Number of features for each level of the Gaussian pyramid (background removed) and corresponding number of
features tested for the feature selection step.
Level Total number of features Number of selected features
1 36209 50, 100, 250, 500, 1000, 2500, 5000, 10000, 25000, 36209
2 4723 50, 100, 250, 500, 1000, 2500, 4723
3 656 50, 100, 250, 500, 656
4 111 50, 100, 111
this case. Figure 3b shows the results for the second
level of the Gaussian pyramid technique and for K-
means with 4723 clusters. The clustering approach
with α = 2 achieved the best mean accuracy (88.14%)
using 1000 features. In general, the clustering ap-
proach was better than the Gaussian pyramid, for all
values of α. The results for the level 3 of Gaussian
pyramid and the clustering approach with 656 clus-
ters are presented in figure 3c. Usually, the clustering
approach was better than the Gaussian pyramid for all
values of α, being the best result of 88.21% obtained
using K-means with α set to 4. Figure 3c presents
the results for the fourth level of the Gaussian pyra-
mid and the corresponding clustering approach with
111 clusters. Again, the clustering approach almost
always outperforms the Gaussian pyramid for all val-
ues of α. The best result in this case was 84.94%
using α = 2. The overall best result for the AD vs CN
problem was obtained by reducing the original num-
ber of features to 656 using the clustering approach
with α = 4, and then selecting the best 500 features to
train the classifier.
Figure 4 presents the results for the MCI vs CN
problem. The best results obtained for the level 1
of the Gaussian pyramid was 79.45%, and 79.5% for
the corresponding number of clusters for K-means, as
shown in figure 4a. Figure 4b presents the results for
the second level of the pyramid and for the cluster-
ing approach with 4723 clusters. Generally, K-means
with α = 2 obtains good results, but the highest accu-
racy (78.88%) was achieved by setting α = 8 and se-
lecting the top 2500 features. For the level 3 and 4 of
the Gaussian pyramid and the corresponding number
of clusters for the clustering approach, it can be seen
in figures 4c and 4d that the clustering approaches
with α = 2 and α = 4 are clearly better than the Gaus-
sian pyramid technique. Overall, the K-means with
656 clusters obtained, again, the highest mean accu-
racy (80.22%), selecting the top 250 features.
Figure 5 shows the results for the AD vs MCI
problem. For the case of the level 1 of the Gaus-
sian pyramid and the corresponding clustering results
(figure 5a), it can be seen that all feature extraction
methods perform better using a small number of fea-
tures. The best result was achieved by K-means with
72.36% using the top 100 features and α = 2. Figure
(a) Gaussian pyramid level 1, K-means 36209 clusters.
(b) Gaussian pyramid level 2, K-means 4723 clusters.
(c) Gaussian pyramid level 3, K-means 656 clusters.
(d) Gaussian pyramid level 4, K-means 111 clusters.
Figure 3: Mean accuracies obtained for the AD vs CN prob-
lem using both the Gaussian pyramid and the data clustering
approach.
5b shows the mean accuracies for the second level of
the pyramid and for the clustering approach with 4723
clusters. As above, the best results were obtained us-
ing few features. K-means achieved again the best ac-
curacy with 70.31% using only 50 features and with
α = 8. Figures 5c and 5d presents the results for the
last two levels of the Gaussian pyramid and the cor-
FeatureExtractioninPetImagesfortheDiagnosisofAlzheimer'sDisease
565
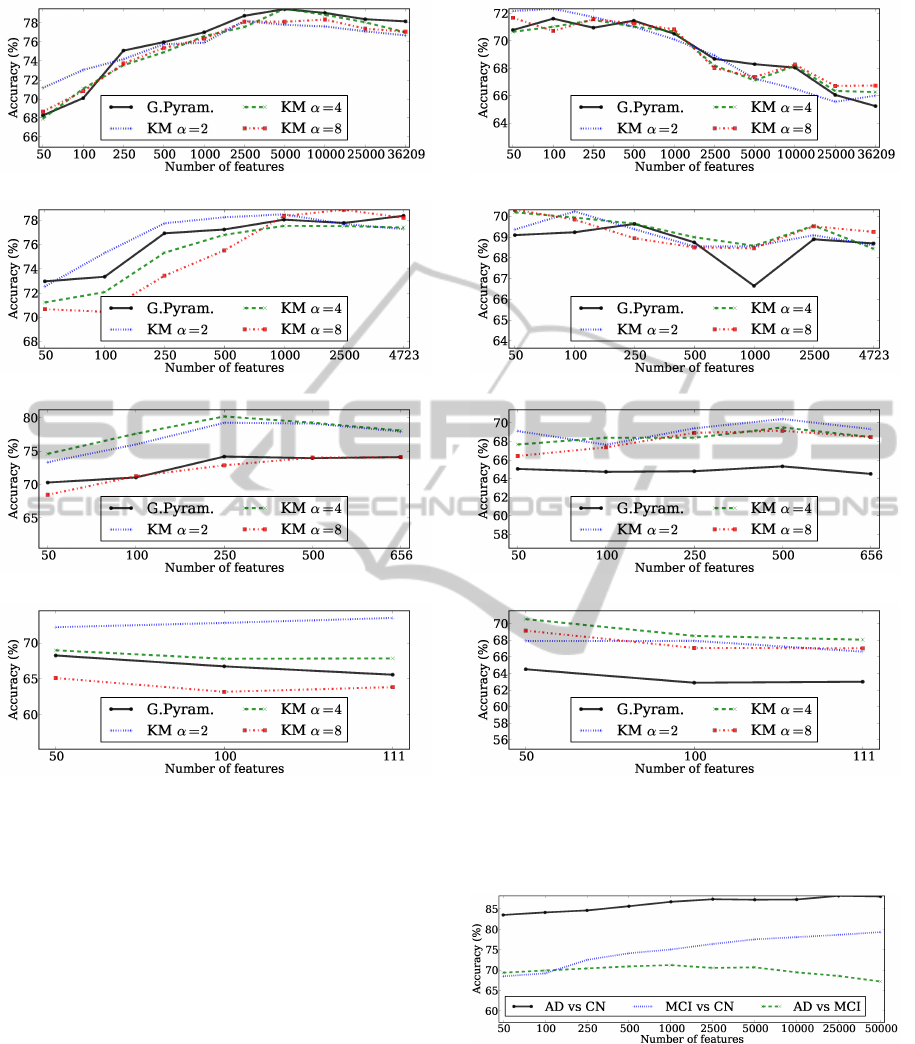
(a) Gaussian pyramid level 1, K-means 36209 clusters.
(b) Gaussian pyramid level 2, K-means 4723 clusters.
(c) Gaussian pyramid level 3, K-means 656 clusters.
(d) Gaussian pyramid level 4, K-means 111 clusters.
Figure 4: Mean accuracies obtained for the MCI vs CN
problem using both the Gaussian pyramid and the data clus-
tering approach.
responding clustering results. It can be clearly seen
that the clustering approach outperforms the Gaus-
sian pyramid technique for all values of α. In the
first case, the best result is obtained by K-means using
500 features and α = 2 with 70.42%, which is signif-
icantly higher than the 65.33% achieved by the Gaus-
sian pyramid. For the second case, the best result of
70.55% was achieved by setting α = 4 and selecting
the top 50 features, which is much superior that the
64.50% obtained by the Gaussian pyramid technique.
Overall, the best accuracy for the AD vs MCI prob-
lem (72.34%) was obtained by clustering the original
features with 36209 clusters with α = 2 and selecting
the top 100 features.
Next, we will compare the previous results with
the methodology without feature extraction, i.e., ap-
(a) Gaussian pyramid level 1, K-means 36209 clusters.
(b) Gaussian pyramid level 2, K-means 4723 clusters.
(c) Gaussian pyramid level 3, K-means 656 clusters.
(d) Gaussian pyramid level 4, K-means 111 clusters.
Figure 5: Mean accuracies obtained for the AD vs MCI
problem using both the Gaussian pyramid and the data clus-
tering approach.
Figure 6: Mean accuracies obtained for the AD vs CN, MCI
vs CN, and AD vs MCI using the original voxel intensities
(i.e. without feature extraction).
plying feature selection directly over the original
voxel intensities. Figure 6 presents the correspond-
ing mean accuracies. This representation contains
297735 features, corresponding to the voxel intensi-
ties of the original images after removing the back-
ICPRAM2014-InternationalConferenceonPatternRecognitionApplicationsandMethods
566

Table 3: Best mean accuracy values and standard deviations obtained by not using any feature extraction technique and the
corresponding results for the best approach using feature extraction.
AD vs CN MCI vs CN AD vs MCI
Without Accuracy 88.22% 79.34% 71.25%
Feature Standard Deviation 1.19% 2.45% 1.70%
Extraction #Selected Features 25000 50000 1000
Accuracy 88.21% 80.22% 72.34%
With Standard Deviation 1.67% 2.27% 1.66%
Feature Feat. Sel. Approach K-means α = 4 K-means α = 4 K-means α = 2
Extraction #Reduced Features 656 656 36209
#Selected Features 500 250 100
ground. For the AD vs CN and MCI vs CN problems,
the accuracy increases as the number of selected fea-
tures grows. The best results were 88.22% for the
AD vs CN classification task and 79.34% for the MCI
vs CN problem. For the AD vs MCI classification
task, high number of features leads to lower accu-
racies. The best result in this case was 71.25%. A
summary showing the best results achieved with and
without performing feature extraction is presented in
table 3. The main conclusion is that using the pro-
posed clustering approach have similar results in the
AD vs CN, and better results in the MCI vs CN and
AD vs MCI using far fewer features.
4 CONCLUSIONS AND FUTURE
WORK
A new approach to reduce features in neuroimages
was proposed based on clustering similar brain re-
gions with respect to both voxel intensity values and
voxel space positions. We integrated it in a method-
ology for performing computer-aided diagnosis of
Alzheimer’s disease and mild cognitive impairment
conditions, and compared it with the Gaussian pyra-
mid technique.
Results have shown that the proposed approach
outperforms the Gaussian pyramid technique for fea-
ture reduction. This is more evident when the brain is
represented by a lower number of features, suggesting
that the clustering approach is more robust. Also, the
proposed feature extraction technique leads to simi-
lar or better classification accuracies than using the
original voxel intensities but using a small fraction of
the number of features, which allows the development
of computer-aided diagnosis systems with fewer pro-
cessing and memory requirements.
In future work we intend to use constrained clus-
tering algorithms, capable of using a priori informa-
tion about specific domains. Our idea is to map infor-
mation about the neighborhood of the voxels as con-
straints in order to improve the brain segmentation.
We will also compare these approaches with recent
multi-scale techniques.
ACKNOWLEDGEMENTS
This work was supported by the Portuguese Founda-
tion for Science and Technology grants PTDC/SAU-
ENB/114606/2009 and PTDC/EEI-SII/2312/2012.
REFERENCES
Alzheimer’s Association (2013). Alzheimer’s disease facts
and figures Alzheimer’s association. ALZHEIMERS
& DEMENTIA, 9(2):208–245.
Burt, P. J. (1981). Fast filter transform for image processing.
Comp. graphics and image proc.
Cortes, C. and Vapnik, V. (1995). Support-vector networks.
Mach. Learn., 20(3):273–297.
Dukart, J., Mueller, K., Barthel, H., Villringer, A., Sabri,
O., and Schroeter, M. L. (2013). Meta-analysis
based SVM classification enables accurate detection
of Alzheimer’s disease across different clinical centers
using FDG-PET and MRI. Psych. Res.: Neuroimag-
ing, 212(3):230 – 236.
Dukart, J., Mueller, K., Horstmann, A., Barthel, H., M
¨
oller,
H. E., Villringer, A., Sabri, O., and Schroeter, M. L.
(2011). Combined evaluation of FDG-PET and MRI
improves detection and differentiation of dementia.
PLoS ONE, 6(3).
Gray, K., Wolz, R., Heckemann, R., Aljabar, P., Hammers,
A., and Rueckert, D. (2012). Multi-region analy-
sis of longitudinal FDG-PET for the classification of
Alzheimer’s disease. NeuroImage, 60(1):221–229.
Gray, K. R., Aljabar, P., Heckemann, R. A., Hammers,
A., and Rueckert, D. (2013). Random forest-based
similarity measures for multi-modal classification of
Alzheimer’s disease. NeuroImage, 65(0):167 – 175.
Guyon, I. and Elisseeff, A. (2003). An introduction to
variable and feature selection. J. Mach. Learn. Res.,
3:1157–1182.
FeatureExtractioninPetImagesfortheDiagnosisofAlzheimer'sDisease
567

Ill
´
an, I. A., G
´
orriz, J. M., Ram
´
ırez, J., Salas-Gonzalez, D.,
L
´
opez, M. M., Segovia, F., Chaves, R., G
´
omez-Rio,
M., and Puntonet, C. G. (2011).
18
F-FDG PET imag-
ing analysis for computer aided Alzheimer’s diagno-
sis. Inf. Sci., 181(4):903–916.
MacQueen, J. B. (1967). Some methods for classification
and analysis of multivariate observations. In Cam, L.
M. L. and Neyman, J., editors, Proc. of the fifth Berke-
ley Symposium on Mathematical Statistics and Prob-
ability, volume 1, pages 281–297. University of Cali-
fornia Press.
Maldjian, J. A., Laurienti, P. J., Kraft, R. A., and Bur-
dette, J. H. (2003). An automated method for neu-
roanatomic and cytoarchitectonic atlas-based interro-
gation of fMRI data sets. NeuroImage, 19(3):1233 –
1239.
Mart
´
ınez-Murcia, F. J., G
´
orriz, J. M., Ram
´
ırez, J., Puntonet,
C. G., and Salas-Gonzalez, D. (2012). Computer
aided diagnosis tool for Alzheimer’s disease based on
Mann-Whitney-Wilcoxon u-test. Expert Syst. Appl.,
39(10):9676–9685.
Morgado, P., Silveira, M., and Marques, J. (2013a). Effi-
cient selection of non-redundant features for the diag-
nosis of Alzheimer’s disease. In Biomedical Imaging
(ISBI), 2013 IEEE 10th International Symposium on,
pages 640–643.
Morgado, P., Silveira, M., and Marques, J. S. (2013b). Di-
agnosis of Alzheimer’s disease using 3D local binary
patterns. Computer Methods in Biomechanics and
Biomedical Engineering: Imaging & Visualization,
1(1):2–12.
Morgado, P. M. M. (2012). Automated diagnosis of
Alzheimer’s disease using PET images. Master’s the-
sis, Instituto Superior T
´
ecnico - Universidade T
´
ecnica
de Lisboa.
Natarajan, S., Joshi, S., Saha, B. N., Edwards, A., Khot, T.,
Moody, E., Kersting, K., Whitlow, C. T., and Mald-
jian, J. A. (2012). A machine learning pipeline for
three-way classification of Alzheimer patients from
structural magnetic resonance images of the brain. In
ICMLA, pages 203–208.
Ramirez, J., Gorriz, J., Salas-Gonzalez, D., Romero, A.,
Lopez, M., Alvarez, I., and Gomez-Rio, M. (2013).
Computer-aided diagnosis of Alzheimer’s type de-
mentia combining support vector machines and dis-
criminant set of features. Information Sciences - Pre-
diction, Control and Diagnosis using Advanced Neu-
ral Computations, 237(0):59 – 72.
Savio, A. and Gra
˜
na, M. (2013). Deformation based feature
selection for computer aided diagnosis of Alzheimer’s
disease. Expert Systems with Applications, 40(5):1619
– 1628.
Segovia, F., G
´
orriz, J., Ram
´
ırez, J., Salas-Gonzalez, D.,
´
Alvarez, I., L
´
opez, M., and Chaves, R. (2012). A
comparative study of feature extraction methods for
the diagnosis of Alzheimer’s disease using the ADNI
database. Neurocomputing, 75(1):64 – 71.
Varma, S. and Simon, R. (2006). Bias in error estimation
when using cross-validation for model selection. BMC
Bioinformatics, 7(91).
Zhang, D., Wang, Y., Zhou, L., Yuan, H., and Shen, D.
(2011). Multimodal classification of Alzheimer’s dis-
ease and mild cognitive impairment. NeuroImage,
55(3):856–867.
ICPRAM2014-InternationalConferenceonPatternRecognitionApplicationsandMethods
568
