
A Data Analysis Framework for High-variety Product Lines in the
Industrial Manufacturing Domain
Christian Lettner and Michael Zwick
Software Competence Center Hagenberg GmbH, Softwarepark 21, Hagenberg, Austria
Keywords:
Data Analysis, Generic Data Models, Extract Transform Load, Data Warehouse.
Abstract:
Industrial manufacturing companies produce a variety of different products, which, despite their differences
in function and application area, share common requirements regarding quality assurance and data analysis.
The goal of the approach presented in this paper is to automatically generate Extract-Transform-Load (ETL)
packages for semi-generic operational database schema. This process is guided by a descriptor table, which
allows for identifying and filtering the required attributes and their values. Based on this description model,
an ETL process is generated which first loads the data into an entity-attribute-value (EAV) model, then gets
transformed into a pivoted model for analysis. The resulting analysis model can be used with standard business
intelligence tools. The descriptor table used in the implementation can be substituted with any other non-
relational description language, as long as it has the same descriptive capabilities.
1 INTRODUCTION
Data analysis in the industrial manufacturing domain
rises some — often contradicting — challenges when
compared to traditional business centered data anal-
ysis. These challenges, which are addressed in this
paper are:
• Use of generic data models in operational
databases to represent product variability
• Product specific data analysis models that are fea-
sible for domain experts (in contrast to generic
data models without explicit metadata)
• High importance of correlation detection for de-
fect cause analysis in an environment with a huge
amount of independent dimensions
• Cope with technical issues like, e.g, repeated mea-
surement for calibration
Unlike conventional data models, which are lim-
ited to a specific domain scope, generic data mod-
els represent more abstract concepts in order to widen
the range of applicability and to a certain degree stan-
dardize the way different facts, which share a com-
mon structure, are represented in the model. E.g., the
pattern bill of material (Jiao et al., 2000) describes a
rather generic whole-parts relationship, which is us-
able for describing a wide range of real world phe-
nomena. The main incentive for using a generic data
models is the standardization that goes along with it,
i.e., it prevents the creation of different (conventional)
data models for the same domain. Especially for data
exchange and integration in a business intelligence
scenario, mappings need to be established between
these different data models which can be error-prone.
One of the most common generic modeling pat-
terns in the relational data model is the Entity-
Attribute-Value (EAV) model (Dinuab and Nadkar-
nia, 2007). The EAV model is used for describing
entities that can potentially have a vast amount of
attributes, but in a single instance of an entity typ-
ically only a few attributes actually occur. For ex-
ample, in industrial manufacturing, for a given prod-
uct many measurement types (temperature, pressure,
electric resistance, ...) are available and collected dur-
ing the whole production process, but at a given time
only a small subset of the available measurements are
actually recorded. The usual approach of reserving
one attribute per measurement type in a relational ta-
ble would lead to many NULL values and as a result
to a sparsely filled table. The structure of an EAV
table usually consists of three attributes (entity,
attribute, value), where entity and attribute
form the primary key of the relation. Sometimes, this
gets extended with an additional timestamp attribute.
Referring to the example above, entity could be
a pressure sensor being manufactured, attribute a
key value for the measure type ”internal resistance”,
209
Lettner C. and Zwick M..
A Data Analysis Framework for High-variety Product Lines in the Industrial Manufacturing Domain.
DOI: 10.5220/0004887802090216
In Proceedings of the 16th International Conference on Enterprise Information Systems (ICEIS-2014), pages 209-216
ISBN: 978-989-758-027-7
Copyright
c
2014 SCITEPRESS (Science and Technology Publications, Lda.)
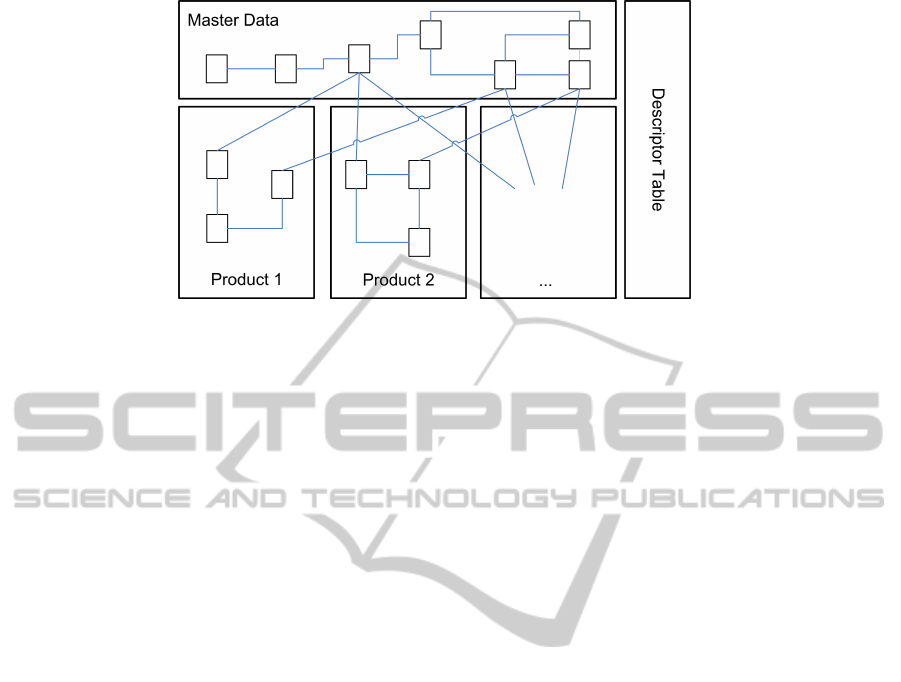
Figure 1: Semi-generic data model of an industrial manufacturing company.
e.g. ”RI”, and value the real value measured during
quality inspection.
One of the biggest downsides of generic data mod-
els is that they do not mirror the real world concepts
they where designed to represent in a recognizable
way, like documentation inherent in the description
of the data model via table names, attribute names
etc. This is why generic data models heavily rely
on outside documentation for users (application de-
velopers, business analysts) to make sense off. Espe-
cially for data analysis, generic data models need to
be transformed to a form that more closely represents
the mental image a data analyst has of the domain to
be analyzed. For example, in the case of the EAV
model, the transformation which brings the data back
into a columnar form for analysis is called pivoting
(Dinu et al., 2006).
Figure 1 depicts a data schema which is often
found in industrial manufacturing, especially in dis-
crete parts manufacturing like the machine and com-
ponent building industry. Within a product line, the
individual products share a lot of similarities, e.g.,
the are manufactured on the same assembly line and
can be represented by a bill-of-materials. In figure 1,
these similarities are represented by the master data
tables. However, every product is also distinct, in in-
dustrial manufacturing most notably the number and
kind of measurements taken during the production in
order to control the whole process, calibrate the prod-
uct and assure it meets quality requirements. In fig-
ure 1 these differences are represented by the prod-
uct specific tables, which are connected to the gen-
eral master data tables through various relations. Note
that this approach differs from a strictly generic ap-
proach using a EAV model, where all product specific
measurements are stored as (entity, attribute, value)-
tuples. Such a model is often used, to keep the de-
scriptive quality of the schema as a source of docu-
mentation, and also to establish a border between dif-
ferent products within the product line, which usually
have a separate domain specialist responsible for just
one product. Using this model, a new product gets
introduced by building upon the existing master data
and add product specific tables which can accommo-
date all the necessary information. Thus, it is on the
one hand flexible enough to meet the requirements of
the different products produced, and on the other hand
is still expressive enough to be used and extended by
domain experts.
Based on this semi-generic operational database
schema for industrial manufacturing processes, the
contribution of this paper is to introduce and evaluate
an analysis framework for data warehousing, which
needs a minimum amount of adaption when the un-
derlying operational database schema changes. The
main idea is to use a descriptor table, which func-
tions as a schema mapping (Bernstein and Melnik,
2007) between the operational schema and the anal-
ysis schema allowing to generate the ETL process
needed to load data into the data warehouse.
The rest of this paper is organized as follows: sec-
tion 2 describes the current work related to generic
data models as well as automatic generation of ETL
processes. Section 3 describes the architecture of our
approach to automatically generate ETL processes for
a semi-generic data model. Section 4 contains details
of the implementation. Finally, section 5 concludes
with an evaluation and intended further work.
2 RELATED WORK
In order to be able to automatically generate domain
independent ETL processes from arbitrary data mod-
els a theoretical basis for schema matching is needed,
as described in (Bernstein and Melnik, 2007). Mod-
ern ETL tools (Chaudhuri et al., 2011) provide such a
ICEIS2014-16thInternationalConferenceonEnterpriseInformationSystems
210

domain independent approach to data integration, but
require the mappings to be manually engineered.
Schema-less NoSql database management systems
like, e.g., Bigtable (Chang et al., 2008) or semi-
structured data models (Acharya et al., 2008) effi-
ciently store NULL-values, thus mitigating the draw-
back of domain oriented data schemas of having
many NULL values when comparing them to generic
schemas like EAV. However, NoSql is targeted to-
wards semi-structured mass data, it is not particularly
suited to deal with strongly structured, relationship
heavy data like, e.g., master data. This often leads
to heterogeneous IT infrastructures with both NoSql
and traditional relational database systems. Thus, it is
still desirable for many companies to exclusively use
a relational database management system.
Business intelligence development tools for ETL
(Stumptner et al., 2012) typically use available meta-
data, e.g., constraints and foreign keys, to create tem-
plates which need to be further parameterized by the
domain experts. In our approach, domain knowledge
is specified by end users beforehand, our generator
then uses this information to create the ETL processes
without further adjustments needed by the end user.
Thus, the domain metadata is available for all ETL
processes to be developed in the future.
(Mu
˜
noz et al., 2009) presents an approach to auto-
matic generation of ETL processes. It is based on the
Model Driven Architecture (MDA) framework and
generates Process Specific Models (PSM) from Pro-
cess Independent Models (PIM) using Query View
Transformations (QVT). One PIM describes a sin-
gle ETL process and is completely implementation-
independent. The PIM is the main source of doc-
umentation for the ETL process. In (Atigui et al.,
2012) a framework to automatically integrate data
warehouse and ETL design within the MDA is intro-
duced. It is based on the Object Constraint Language
(OCL). In the paper at hand, the descriptor table is
closely related to the PIM, as it describes the ETL
process in a platform independent way using classes,
attributes and filter criteria, even though our example
implementation is based on the relational data model.
The descriptor table functions as a documentation of
the ETL process, with the possibility of transform-
ing the condensed representation of the table into a
more human-readable format. Instead of process spe-
cific models, our approach uses SQL as a common
language in the data warehousing world.
In (Skoutas and Simitsis, 2006), ontologies are
used to specify structure and semantics of multiple
data source schemata as well as the data warehouse
schema. Using reasoning, conceptual ETL processes
are then inferred automatically, which specify the
transformation of one or more source schemata to the
data warehouse schema. The main motivation for us-
ing ontologies is to overcome structural and semantic
heterogeneity. Comparing this to our approach, we
use a semi-generic data model for different products
in a product line, where the non-generic, i.e., product
specific parts are explicitly mapped via the descrip-
tor table. Thus, because of our generic approach, we
have no need for an inferred mapping of schemata.
(Skoutas and Simitsis, 2006) is only concerned with
the generation of conceptual ETL processes, a sub-
sequent transformation into a platform dependent im-
plementation is required.
(Khedri and Khosravi, 2013) proposes and imple-
ments a delta-oriented approach to handling variabil-
ity in database schemata for software product lines.
The start out with a core schema containing manda-
tory features that gets modified using delta scripts de-
pending on with optional or alternative features are
selected for a specific product. In contrast, our ap-
proach uses a strict separation of database objects
which are common to all products, i.e., master data,
and product specific parts of the database schema.
3 ARCHITECTURE
Figure 2 gives an overview of the data analysis ar-
chitecture presented in this paper. Data is trans-
formed from the operational database to the analysis
database passing three different stages. The opera-
tional database is a relational database, the analysis
database is implemented as an OLAP (on-line ana-
lytical processing) database (Chaudhuri et al., 2011).
The first stage is responsible for dealing with activi-
ties specific to the operational database. The second
step executes activities not dependent on the source or
target database. The last stage is responsible for deal-
ing with specifics of the analysis database. Thus, each
stage is responsible for executing an arbitrary number
of activities falling in one of three groups: operational
database specific, independent and analysis database
specific. When a new type of activity is needed, it
can be implemented as a template for instantiation
and reuse. Operational as well as analysis database
specific activities are generated based on a descriptor
table and use a interval defintion table.
The main task of the operational database spe-
cific activities is to retrieve data from the operational
database representing the specific product variation of
interest and transform it into a domain independent
data structure, in our case into an EAV model. To do
so, at least a change data capture and staging activity
must be implemented. The change data capture ac-
ADataAnalysisFrameworkforHigh-varietyProductLinesintheIndustrialManufacturingDomain
211
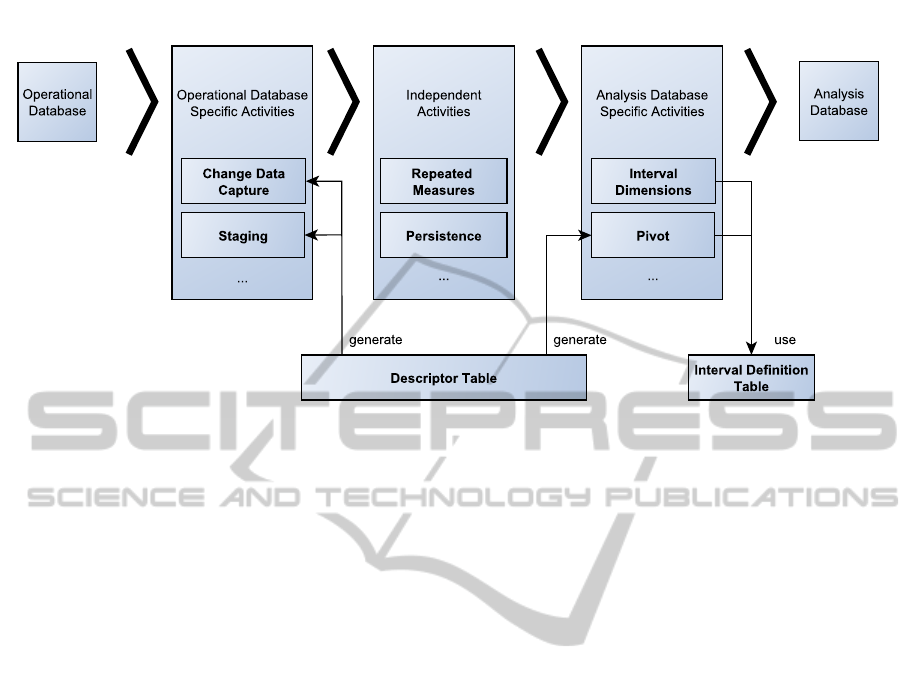
Figure 2: Overview of the data analysis architecture.
tivity implements a functionality to identify the data
from the operational database that needs to be loaded
into the analysis database. The staging activity is re-
sponsible to determine the location of the data in the
operational database and for applying filters when re-
trieving the data from the operational database. Be-
cause these types of activities are specific to the ap-
plied operational database, they are generated based
on activity templates and configurations found in the
descriptor table (see section 4.1).
Independent activities are domain specific and
perform transformations and calculations on the data
which are required in the analysis model and uni-
formly applied to all product variations. They operate
on an EAV data structure, which does not reflect any
product specific variability at the schema level. Two
activities implemented in this work are repeated mea-
sures and persistence. The repeated measures activity
implements a logic to deal with measurements that are
taken multiple times, that is often found in the indus-
trial manufacturing domains. The activity logically
groups measurements into measurement-cycles. New
measurement-cycles start at certain events or actions
within the production process, like applying a special
treatment or a repair. Measurements may be taken as
often as needed, but by the end of every measurement-
cycle only the last measured value of a measurement
type must be used in the analysis model as a reference
for the respective measurement-cycle. That means,
the measurement value may result from a previously
performed measurement-cycle as well. This calcula-
tion, technically also known as last-non-empty func-
tion, is implemented as an independent activity and
thus applied uniformly to all product variants (see
section 4.2). Even though last-non-empty is a fea-
ture present in most analysis front ends, our template
is independent and can be used with all OLAP front
ends, regardless of whether a last-non-empty function
is available.
Similar to the repeated measures activity, the per-
sistence activity is designed as an independent activ-
ity, that is responsible for persisting the data into a ta-
ble. It provides a mechanism for already loaded data,
i.e. apply insert, update or merge operations.
Finally, analysis database specific activities build
the connection to the analysis database. Because
these activities represent product specific variations,
the activities are generated based on the descriptor ta-
ble and use the interval defintion table. For example,
the pivot activity transforms the data from the prod-
uct independent EAV model to a more expressive and
explicit analysis model.
OLAP is often applied in analysis databases. In
standard OLAP only dimensions are allowed to be
used at the axis position of a query. As numerical
values must be modeled as facts, correlation analysis
between numerical measures can not be performed, as
it would require facts being placed at the axis position.
To overcome this drawback, some front end tools pro-
vide proprietary solutions for this problem, but in or-
der to be able to use standard OLAP front end tools,
the interval dimension activity performs a discretiza-
tion of the numerical measurements by mapping the
values to corresponding interval dimension elements.
Again, the interval dimension activity calculates the
dimension intervals according to the specification in
the descriptor table (see section 4.3).
ICEIS2014-16thInternationalConferenceonEnterpriseInformationSystems
212

4 IMPLEMENTATION
The architecture introduced in section 3 has been pro-
totypically implemented using Microsoft SQL Server
2008 Database, Integration Services and Analysis
Services.
4.1 Descriptor Table
The descriptor table captures the variability in the op-
erational database, as depicted in figure 1, with re-
spect to the requirements of the analysis model. For
every measure in the analysis model it defines: (i) the
location of the data in operational database, (ii) the
constraints that must be applied when querying the
operational database to get meaningful results, and
(iii) an interval specification for the measures in the
analysis model. Table 1 shows an example descrip-
tor table. Column MTYPE represents the measure in
the analysis model. TABNAME and COLNAME repre-
sent the table and column where the measure can be
found in the operational database. CHANNELNB and
CHANNELTYPE represent the filter conditions applied
to the master data subset of the operational database
when the measurement values are retrieved. INTVL
represents the interval specification applied when the
measures are loaded into the analysis database (for
further details see section 4.3).
Based on the descriptor table shown in table 1, the
following data access query is generated in the stag-
ing activity an installed as a data access view in the
staging area:
SELECT
P.SERIALNNB,
D.MTYPE
CASE D.TABNAME+’.’+D.COLNAME
WHEN ’MEASURE.STARTTIME’ THEN
CONVERT(varchar,MEASURE.STARTIME)
WHEN ’MEASUREDETAIL.REF’ THEN
CONVERT(varchar,MEASUREDETAIL.REF)
WHEN ’MEASUREDETAIL.ACTUAL’ THEN
CONVERT(varchar,MEASUREDETAIL.ACTUAL)
END as MVALUE
FROM
PRODUCT P,
MEASURE M,
MEASUREDETAIL MD,
DESCRIPTOR D
WHERE P.ID = M.PID
and M.ID = MD.MID
and M.CHANNELNB = D.CHANNELNB
and M.CHANNELTYPE = D.CHANNELTYPE
The query selects tables and columns, and applies
filters according to the descriptor table. Furthermore,
it defines the level of granularity required in the anal-
ysis model. For the reason of clarity, the pivot into
the domain independent EAV data structure is per-
formed by joining the DESCRIPTOR table along with
the case statement. An optimized query omites join-
ing the DESCRIPTOR table at all, utilizing SQL pivot
operations, thus increasing the performance.
4.2 Repeated Measurements
Table 2 shows an example of measured values
stored in the operational database. The column
SERIALNB identifies the entity or product being mea-
sures, MCYCLE the assigned measurement cycle for
the measurement, MTYPE the measurement type or
attribute being measured and MVALUE the measured
value. The query that enriches every measurement
cycle with the last available measurement for every
measurement type is given below:
SELECT
TMP.SERIALNB,
TMP.MCYC,
TMP.MTYPE,
TMP.MVALUE
FROM (
SELECT
T1_DATA.SERIALNB,
T1_CYC.MCYC,
T1_DATA.MTYPE,
T1_DATA.MVALUE,
rank() OVER (partition BY T1_DATA.SERIALNB,
T1_CYC.MCYC,
T1_DATA.MTYPE
ORDER BY T1.DATA.MCYC DESC) AS POS
FROM
T1 T1_DATA INNER JOIN
( SELECT DISTINCT SERIALNB, MCYCLE FROM T1) T1_CYC
ON T1_DATA.SERIALNB = T1_CYC.SERIALNB AND
T1_DATA.MCYCLE <= T1_CYC.MCYCLE
) TMP
WHERE TMP.POS = 1
The query performs a self join of all measured
values with the corresponding serial number and the
same or a previous measurement cycle. Then a rank-
ing is performed on a descending sort order of the
measurement cycle, yielding to the rank of 1 for the
last performed measurement. Table 3 shows the re-
sult of the query. Rows added by the query are de-
picted with grey background color. Table 4 presents
the result pivoted by SERIALNB and MCYCLE, showing
every MTYPE in a separate column, as performed in
the pivoting activity of the architecture described in
section 3.
4.3 Interval Dimensions
The interval dimensions are implemented using an
interval definition table intvlParams and two func-
tions uf SelectIntvlId and uf DimInterval. Ta-
ble 5 shows an example interval definition table for
ADataAnalysisFrameworkforHigh-varietyProductLinesintheIndustrialManufacturingDomain
213
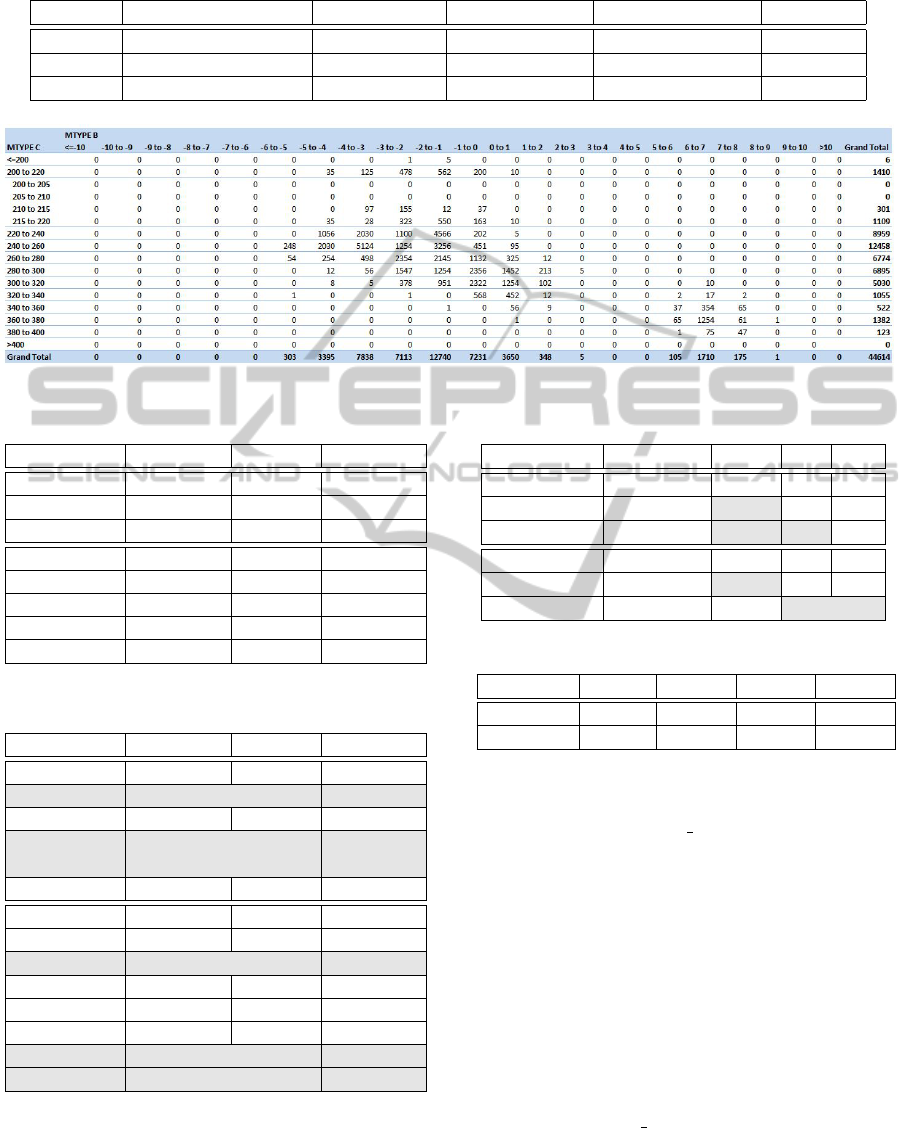
Table 1: Descriptor table DESCRIPTOR.
MTYPE TABNAME COLNAME CHANNELNB CHANNELTYPE INTVL
A MEASURE STARTTIME 10 E
B MEASUREDETAIL REF 1 S INVTL-B
C MEASUREDETAIL ACTUAL 10 E INVTL-C
Figure 3: Correlation analysis using interval dimensions for measurement type B and C.
Table 2: Measured values stored in the operational database.
SERIALNB MCYCLE MTYPE MVALUE
1 0 A 17:30
1 1 B 7.4
1 2 C 365
2 0 A 17:40
2 0 B 6.3
2 1 B 6.5
2 1 C 302
2 2 A 17:50
Table 3: Last measured values added to measurement cy-
cles.
SERIALNB MCYCLE MTYPE MVALUE
1 0 A 17:30
1 1 A 17:30
1 1 B 7.4
1 2 A 17:30
1 2 B 7.4
1 2 C 365
2 0 A 17:40
2 0 B 6.3
2 1 A 17:40
2 1 B 6.5
2 1 C 302
2 2 A 17:50
2 2 B 6.5
2 2 C 302
two intervals: INTVL-B and INTVL-C. The column
LBND defines the lower bound and UBND the upper
bound of the interval. The interval is specified using
two levels, where the interval size for the first level
is specified in the column STEP1, for the second level
Table 4: Pivoted raw data.
SERIALNB MCYCLE A B C
1 0 17:30
1 1 17:30 7.4
1 2 17:30 7.4 365
2 0 17:40 6.3
2 1 17:40 6.5 302
2 2 17:50 6.5 302
Table 5: Interval definition table intvlParams.
INTVL LBND UBND STEP1 STEP2
INVTL-B -10 10 1 0.1
INVTL-C 200 400 20 5
it is specified in the column STEP2. If the analysis
model requires finer intervals, additional levels may
be added. The function uf SelectIntvlId(intvl,
v) returns the interval dimension identifier id for the
given value v in the interval intvl. The function is
defined as:
id =
0, if v ≤ lbnd
1 +(ubnd − lbnd)/step2, if v > ubnd
b(v − ubnd)/step2c, otherwise
(1)
lbnd, ubnd and step2 are retrieved from the inter-
val specification table depending on the value intvl
passed to the function.
The function uf
DimInterval(intvl) returns
a table containing all interval dimension elements
for the certain interval. Table 6 shows the gen-
erated interval dimension for INTVL-B. The calcu-
lation of the identifier ID provided in the table is
ICEIS2014-16thInternationalConferenceonEnterpriseInformationSystems
214
Table 6: Interval dimension table for interval INTVL-B.
ID DESC1 SORT1 LBD1 UBND1 DESC2 SORT2 LBND2 UBND2
0 ≤10.0 0 NULL -10.0 ≤10.0 0 NULL -10.0
1 -10.0 to -9.0 1 -10.0 -9.0 -10.0 to -9.9 1 -10.0 -9.9
...
10 -10.0 to -9.0 1 -10.0 -9.0 -9.1 to -9.0 10 -9.1 -9.0
11 -9.0 to -8.0 2 -9.0 -8.0 -9.0 to -8.9 11 -9.0 -8.9
...
200 9.0 to 10.0 20 9.0 10.0 9.9 to 10.0 200 9.9 10.0
201 >10.0 201 10.0 NULL >10.0 201 10.0 NULL
based on the same algorithm used by the function
uf SelectIntvlId, i.e. the identifier returned by the
function uf SelectIntvlId represents the lookup
key to the interval dimension element.
Interval dimensions are calculated when the
OLAP model is processed, thus the interval dimen-
sions are not materialized in the analysis database.
Changes at the interval specification table only re-
quire a reprocessing of the OLAP model. Figure 3
shows an example correlations analysis based on in-
terval dimensions.
5 CONCLUSIONS
Focusing on the industrial manufacturing domain us-
ing a basic descriptor table allowed us to quickly
automatically generate an ETL process and its cor-
responding analysis model that reflects the different
analysis requirement of all product variations. When
dealing with changing products, quickly providing
analysis models for new products is crucial in the in-
dustry.
The approach in this paper uses a relational
descriptor table to automatically generate ETL
processes for semi-generic operational database
schemas. Filters based on constants on the opera-
tional database for retrieving data as well as interval
dimensions used in the analysis model can be spec-
ified to accommodate the differences in the analysis
requirements. The resulting analysis model does not
depend on proprietary client tool features, thus allows
to perform analysis with standard OLAP tools. The
modular organization of the architecture allows the
creation of additional activities when needed. The
distinction between dependent and independent activ-
ities ensures the decoupling of the analysis database
from the operational database.
Repeated measures and interval dimension repre-
sented the core operations in our application scenario.
Implementing them as separte and self-contained ac-
tivities allows them to be easily reused for other prod-
uct variations.
Nevertheless, in this work data have been loaded
from a single data source into the data warehouse. If
data have to be integrated from multiple sources, data
quality issues (Chaudhuri et al., 2011) like duplicates
or inconsistent representations may occur. Moreover,
the expressiveness of the description language used
should be increased, i.e. introducing variables and
conditions to be used in filter specifications.
ACKNOWLEDGEMENTS
This work has been supported by the COMET-
Program of the Austrian Research Promotion Agency
(FFG).
REFERENCES
Acharya, S., Carlin, P., Galindo-Legaria, C., Kozielczyk,
K., Terlecki, P., and Zabback, P. (2008). Relational
support for flexible schema scenarios. Proc. VLDB
Endow., 1(2):1289–1300.
Atigui, F., Ravat, F., Teste, O., and Zurfluh, G. (2012). Us-
ing ocl for automatically producing multidimensional
models and etl processes. In Data Warehousing and
Knowledge Discovery, pages 42–53. Springer.
Bernstein, P. A. and Melnik, S. (2007). Model management
2.0: manipulating richer mappings. In Proceedings of
the 2007 ACM SIGMOD international conference on
Management of data, SIGMOD ’07, pages 1–12, New
York, NY, USA. ACM.
Chang, F., Dean, J., Ghemawat, S., Hsieh, W. C., Wallach,
D. A., Burrows, M., Chandra, T., Fikes, A., and Gru-
ber, R. E. (2008). Bigtable: A distributed storage sys-
tem for structured data. ACM Trans. Comput. Syst.,
26(2):4:1–4:26.
Chaudhuri, S., Dayal, U., and Narasayya, V. (2011). An
overview of business intelligence technology. Com-
mun. ACM, 54(8):88–98.
Dinu, V., Nadkarni, P., and Brandt, C. (2006). Pivoting ap-
proaches for bulk extraction of entity-attribute-value
data. Comput. Methods Prog. Biomed., 82(1):38–43.
ADataAnalysisFrameworkforHigh-varietyProductLinesintheIndustrialManufacturingDomain
215

Dinuab, V. and Nadkarnia, P. (2007). Guidelines for
the effective use of entityattributevalue modeling for
biomedical databases. International Journal of Medi-
cal Informatics, 76(11-12):769–779.
Jiao, J., Tseng, M. M., Ma, Q., and Zou, Y. (2000). Generic
bill-of-materials-and-operations for high-variety pro-
duction management. Concurrent Engineering,
8(4):297–321.
Khedri, N. and Khosravi, R. (2013). Handling database
schema variability in software product lines. In To
appear: The 20th Asia-Pacific Software Engineering
Conference, APSEC 2013.
Mu
˜
noz, L., Maz
´
on, J.-N., and Trujillo, J. (2009). Automatic
generation of etl processes from conceptual models.
In Proceedings of the ACM twelfth international work-
shop on Data warehousing and OLAP, DOLAP ’09,
pages 33–40, New York, NY, USA. ACM.
Skoutas, D. and Simitsis, A. (2006). Designing etl processes
using semantic web technologies. In Proceedings of
the 9th ACM international workshop on Data ware-
housing and OLAP, DOLAP ’06, pages 67–74, New
York, NY, USA. ACM.
Stumptner, R., Freudenthaler, B., and Krenn, M. (2012).
Bia accelerator - a template-based approach for rapid
etl development. In ISMIS’2012, Foundations of In-
telligent Systems. Springer.
ICEIS2014-16thInternationalConferenceonEnterpriseInformationSystems
216
