
Physiological Signals in Driving Scenario
How Heart Rate and Skin Conductance Reveal Different Aspects of Driver’s
Cognitive Load
Thi-Hai-Ha Dang and Adriana Tapus
Computer Vision and Robotics Lab, ENSTA-Paris, Palaiseau, France
Keywords:
Physiological Signals, Heart Rate Activity, Skin Conductance, Driver’s Cognitive Load, Human-Machine
Interaction.
Abstract:
Driver’s cognitive load has always been associated with the driver’s heart rate activity and his/her skin con-
ductance activity. However, what aspects of cognitive load that these signals relate to have never been clearly
studied. This paper presents our preliminary results about the relationship between the different physiological
signals (heart rate and skin conductance) and the driver’s cognitive load. Via one experiment with simulated
car driving environment and one experiment in real flying environment, our data suggests that subjects’ heart
rate relates to the number of events to be processed by the human driver while the skin conductance relates
to the novelty of the driving task. Given the small population involved in these experiments, tests on more
subjects are planned and reported in the future.
1 INTRODUCTION
Advances in technology nowadays have created in-
creasingly intelligent devices, including smartphones,
high performance computers, and assistive robotic
systems. The ultimate objectives of all these new
technologies are always to ease human’s works, pro-
vide a better living environment, and help the human
in his/her daily activities. We argue that the user’s in-
ternal state is a very important information for these
systems during an interaction/cooperation task, and
by applying psychology knowledge about emotional
intelligence, we can customize the system to fit the
user’s preferences and thus maximize the benefit of
the Human-Machine Cooperation.
In fact, psychologists had recognized the undeni-
able role of human’s emotional process in the adapt-
ability of human race, as described in (Scherer, 1986),
(Lazarus, 1991). It is also well known that emo-
tional intelligence greatly relates the human’s abil-
ity to cope adaptively with changing situation and
thus stressful situations (Matthews and Zeidner, 2000)
(Zeidner et al., 2006). However, while emotion mod-
elling draws increasing interest of researchers in vir-
tual agents and social robotics to simulate human’s
emotional process in artificial creatures (Dang et al.,
2011), emotion-based interaction seems to occupy a
marginal place in research domains such as Human-
Machine Cooperation. Most of the research in the
field, study individual phenomena of human’s emo-
tional process (such as attentional tunnelling) (Tessier
and Dehais, 2012), anxiety (Liu et al., 2006), or neg-
ative and positive affective states in children (Leite
et al., 2013).
In the domain of intelligent vehicles, the inter-
nal state the most studied is the driver’s “Cognitive
Load”. The cognitive load represents how much in-
formation is processed in the working memory of the
driver. If the driver’s cognitive is overload, his/her
performance may decrease. When someone is cogni-
tively overload, his/her stress level may increase as
a result of intensive use of working memory. It is
thus possible to calculate the cognitive level of hu-
man driver from his/her physiological signals (such
as heart rate, skin conductance). For example, in the
works of (Engstrom et al., 2005), (Davies and Robin-
son, 2011), the effect of visual and cognitive load of
the drivers in simulated and real driving situation was
studied. Their results show that these measures can
be good candidates to assess drivers’ cognitive load,
especially in the real life situations. Tessier and col-
leagues in (Tessier and Dehais, 2012) studied the cog-
nitive load of people remotely controlling a robot for
search missions. They also tested and found that skin
conductance and heart rate variability are good indi-
cators of one’s cognitive load level.
378
Dang T. and Tapus A..
Physiological Signals in Driving Scenario - How Heart Rate and Skin Conductance Reveal Different Aspects of Driver’s Cognitive Load.
DOI: 10.5220/0004901203780384
In Proceedings of the International Conference on Physiological Computing Systems (OASIS-2014), pages 378-384
ISBN: 978-989-758-006-2
Copyright
c
2014 SCITEPRESS (Science and Technology Publications, Lda.)
However, while these researches are supporting
the theory that various physiological signals help to
predict the cognitive load, we’ve found very few
works that look into the role played by each of these
physiological signals in predicting human’s cognitive
load. This is the aspect addressed in our paper. We
present some preliminary results that show the link
between the various physiological signals (skin con-
ductance and hear rate) and the human’s behaviors
and we reveal interesting information about the hu-
man’s cognitive load.
2 DRIVING IN SIMULATED
ENVIRONMENT
The objective of the experiment with the simulated
environment is to study the change of cognitive load
of the human drivers in different driving situations,
such as changes in traffic flow, dangerous pedestri-
ans, changes of driving conditions (e.g., city driving,
countryside driving). To assess the driver’s cognitive
load, we use the physiological signals such as heart
rate activity and skin conductance activity.
2.1 Experimental Setup
To simulate the driving environment, we use the soft-
ware named TRS (Traffic Simulation) provided by the
company nisys GmbH
1
. TRS gives us a wide range
of possibilities to organize the traffic simulation for
our case. The virtual vehicle is controlled by the hu-
man subject via a Logitech’s G27 Racing Wheel and
Pedals.
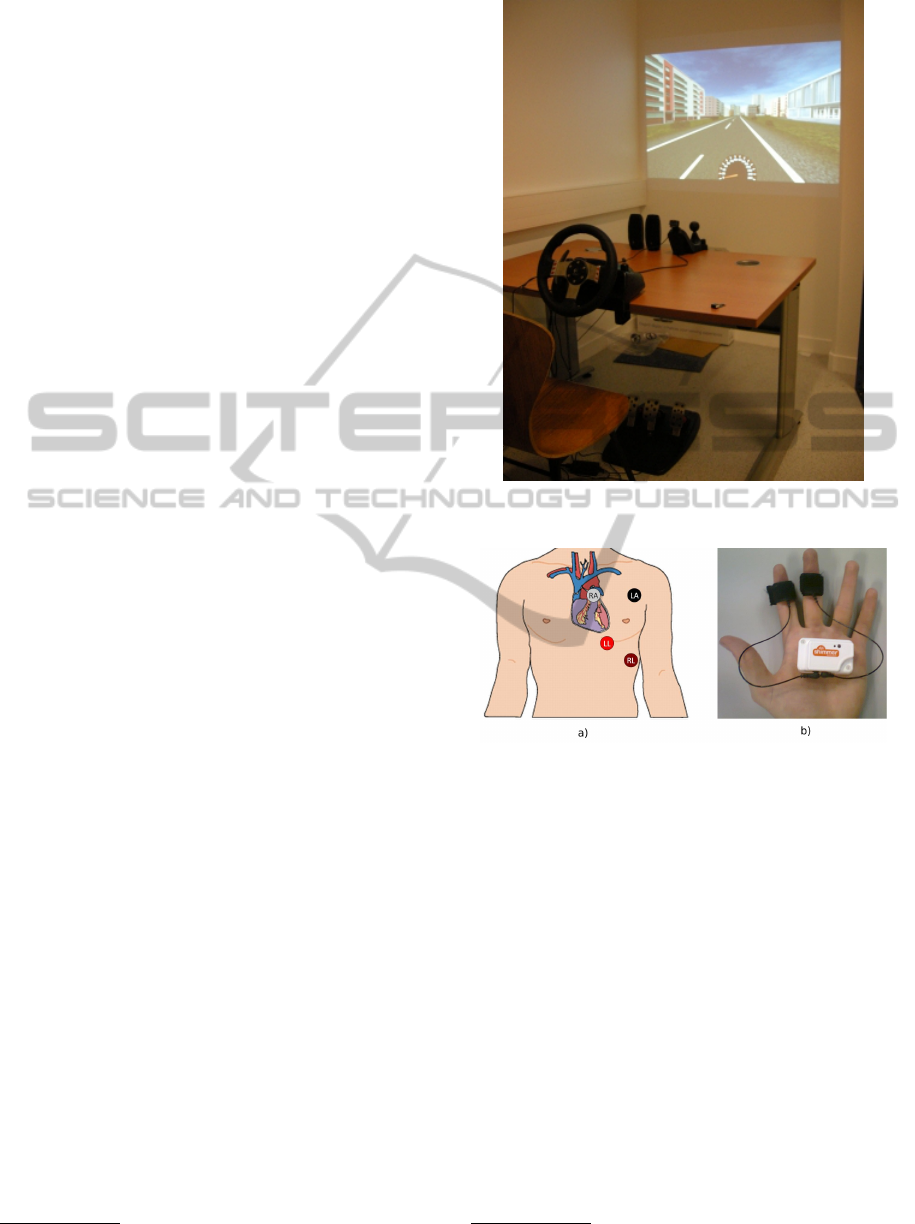
The equipment used in this experiment consists
of a computer that runs the TRS simulation, a pro-
jector to project the simulated driving scene on the
white wall, the Logitech G27 wheel and a gas pedal
and brake, and a chair where the driver sits during the
whole experiment (as shown in Fig. 1).
The driving course prepared for the experiment
consists of 47 km of road, including countryside lanes
and city streets. The parameterizable events of the
system are the pedestrians passing the road in a dan-
gerous manner, the number of simultaneous cars on
the road, the side-ward scene (busy city or peaceful
countryside). We designed two difficulty levels of the
drive: easy drive and difficult drive. The difficulty
level of the drive is measured by the interval between
two consecutive events of the same type. For exam-
ple, in the easy drive, a pedestrian passes in a dan-
1
http://www.nisys.de/
Figure 1: Scene setting of the experiment in simulated driv-
ing environment.
Figure 2: Positioning of a) Shimmer ECG electrodes and b)
Shimmer GSR electrodes.
gerous manner the road every two minutes, and in the
difficult drive, this interval is shortened to one minute.
For the retrieval of heart rate data (and skin con-
ductance) of the driver, we used Shimmer ECG (re-
spectively, GSR) sensor to acquire the driver data in
real-time and transfer this data via Bluetooth com-
munication to the computer for further processing.
ECG (GSR) sensor is strapped on the driver’s body
(left hand) and connected to the four (two) electrodes
as recommended in the Shimmer ECG (GSR) User
Guide
2
(Fig. 2). The sample rate is 51.2Hz for the
ECG sensor and 10.2Hz for the GSR sensor.
2.2 Subjects
The participants were recruited through local commu-
nity. Twelve subjects participated (2 females and 10
2
http://www.shimmer-research.com
PhysiologicalSignalsinDrivingScenario-HowHeartRateandSkinConductanceRevealDifferentAspectsofDriver's
CognitiveLoad
379

males), their age varies between 23 to 47, with a mean
age of 27. They all have technical background.
2.3 Procedure
Before starting the experiments, the participants filled
a pre-study questionnaire about their demographic in-
formation. At the beginning of the experiments a
short introduction about the context and the setting
was presented to the users. The physiological sensors
were attached to the body of the participants for the
measurement of the heart rate and the skin conduc-
tance in real-time. The participants are given 10 min-
utes to try the simulator and to get used to the driving
setting.
The main experiment consisted of 10 minutes of
music relaxation and 20 minutes of driving. The 10-
minute of music relaxation helped us to measure the
baseline threshold of the physiological signals of the
participant for further use. The step of music listen-
ing serves to put the participant in a relaxation state
(minimize the cognitive load), which can be used as a
reference to distinguish between the driving state and
non-driving state. In the 20-minutes driving setup, the
first half of the time-period is the easy driving part
and the second half corresponds to the difficult driv-
ing part. As explained earlier, the difference between
the difficulty levels consisted in the occurrence inter-
val of the traffic-related events. These traffic-related
events include passing pedestrians, traffic lights, other
cars on the road. In our design, the event’s occurrence
interval of difficult driving part is set-up as half as the
one used for the easy driving part. Moreover, the easy
drive setup corresponds to a peaceful countryside en-
vironment, while the difficult drive has busy city sight
environment.
During the 20-minutes driving, we also asked par-
ticipants to do a secondary task, which is the blink
their signal light when they see a particular light-
bulb on the side of the street. This task is intended
to help us assess the participant’s cognitive attention
during the drive. Unlike the traffic-related events, the
occurrence interval of this particular lightbulb is not
changed between easy and difficult drive.
Moreover, our driving system is equipped with a
vocal feature that warns the driver about some traffic-
related events, such as passing pedestrians and traffic
lights. The vocal warning messages are played about
3 seconds before the occurrence of the events, so as to
help the driver to better cope with the situation.
At the end of the drive, the participants are asked
to answer a questionnaire about their emotional im-
pression about the drive and the design system.
2.4 Hypothesis
With the experiment of driving in simulated environ-
ment, we want to test the following hypotheses:
• Hypothesis 1. Participants’ heart rate should cor-
relate with the difficulty level of the driving task.
The more difficult the task is, the higher the heart
rate level is.
• Hypothesis 2. The participants’ skin conductiv-
ity should correlate with the difficulty level of the
driving task. The more difficult the task is, the
higher the skin conductance level is.
2.5 Data Analysis and Discussion
In the scope of this paper, we will present the results
of the physiological signals collected from the exper-
iment. The average skin conductance level and the
average heart rate of each participant in the simulated
driving condition are depicted in Figure 3 and Figure
4. The overall average of these physiological signal
data are presented in the Table 1.
Figure 3: Average heart rate of the participants in simulated
driving condition.
Table 1: Overall average (and standard deviation) of the
physiological signals (heart rate in Beat Per Minute and skin
conductance in MicroSiemens) from the experiment of driv-
ing in simulated environment.
Physio. Signal Heart rate Skin Conductance
Baseline 75 (12) 3.25 (1.9)
Easy level 76 (12) 3.95 (2.3)
Difficult level 77 (12) 3.24 (1.9)
As observed in Figure 3 and from Table 1 about
the data related to the heart rate activity of the par-
ticipants, their heart rates have the lowest level in the
relaxation situation (i.e., only listening to the music)
and the highest level in the difficult driving level sit-
PhyCS2014-InternationalConferenceonPhysiologicalComputingSystems
380

Figure 4: Average skin conductance level of the participants
in simulated driving condition.
uation. Inversely, the skin conductance data reveals a
different view. From Figure 4 and from Table 1, par-
ticipants’ skin conductance measure in the easy driv-
ing level situation is higher than in the difficult driving
level situation. This finding supports our Hypothesis
1. but the skin conductivity does not support our Hy-
pothesis 1. For the Hypothesis 2, our finding shows
that skin conductivity does vary in terms of the task
difficulty, but not in the supposed manner, thus it re-
jects our Hypothesis 2 about the correlation between
the skin conductivity and task’s difficulty level.
To discuss further about our results of heart rate
activity and skin conductivity, we suggest that the dif-
ference between the two signals is completely normal.
That is, while heart rate correlates with the intensity
of events’ occurrence during the drive, skin conduc-
tance variability correlates with the complexity of the
driving task. In our design, the intensity of events’
occurrence changed between difficulty levels but the
types of events did not change across the levels. This
may suggest that heart rate signal might represent how
intense human subjects processed the driving situa-
tion at cognitive level and skin conductance signal
may be representative of how complicated the execu-
tion task is.
Moreover, the difference between the heart rate
activity and the skin conductivity can also be ex-
plained by the fact that the participants are exposed
to a simulated driving environment. This has already
been discussed in the work of (Davies and Robinson,
2011) that points out that when exposed to a simulated
environment, people do not necessarily get as stressed
as in real situations. In order to further investigate our
findings, we conducted a follow-up experiment where
people are invited to drive a real quadrotor drone fol-
lowing predefined trajectories. We present in details
the experiment setting and results in the next section.
Figure 5: Scene setting of the driving experiment in real
environment.
3 DRONE DRIVING IN A REAL
ENVIRONMENT
We conducted a follow-up experiment where we in-
vited people to drive a PARROT quadrotor drone us-
ing the Logitech’s G27 Racing Wheel. In this section,
we present the experimental setting, procedures and
preliminary results that we obtained recently.
3.1 Experimental Design
The real-world drone driving system consisted of the
Logitech’s G27 Racing Wheel, a computer running
Linux and ROS, and a PARROT quadrotor from PAR-
ROT company
3
. The computer served to map the
wheel signals to the quadrotor’s flying commands and
to do additional data collection and processing.
The driving environment is a closed room of 4x4
m2. On the ground there are coloured markers serv-
ing to define different flying trajectories. Markers are
connected by straight lines (serving as flying tracks)
(as shown in Figure 5). We designed two difficult lev-
els. Easy flying trajectory consisted of moving from
one marker to another while staying on the tracks until
all marker are visited. Difficult flying trajectory con-
sisted of moving from an initial marker to one marker
then going back to the initial marker before moving to
another marker. During the flight, the target marker is
shown on the screen so that the driver knows which
target he/she has to fly to. Images from the below
camera of the quadrotor are sent to an image process-
ing program that helps to detect if the quadrotor is on
track or not and to detect if the quadrotor is arrived at
the target marker or not.
3
http://www.parrot.com/
PhysiologicalSignalsinDrivingScenario-HowHeartRateandSkinConductanceRevealDifferentAspectsofDriver's
CognitiveLoad
381

A vocal system has also been implemented and
can be activated to additionally assist the driver during
the flight. It uses the result from the image processing
system to determine the appropriate message. The vo-
cal assistance system is used to warn the driver about
the quadromotor position (on/off track) and to an-
nounce the next marker when a new targeted marker
became available. It also helps the driver to keep track
of the timing.
For the retrieval of heart rate data and skin con-
ductance data of the driver we used the same system
as described in Section 2.1.
3.2 Subjects
The participants are recruited through local commu-
nity. Seven subjects participated (1 female and 6
males), their age varies between 24 to 33, with a mean
age of 27. They all have technical background. One
of them did not participate in the previous experiment
with the simulated driving system.
3.3 Procedure
Before starting the experiment, the participants were
asked to fill-up a pre-study questionnaire about their
demographic information. After that, a short intro-
duction about the experiment context and the setting
was made. The physiological sensors are then at-
tached to the body of the participant for the real-time
measurements of the heart rate and the skin conduc-
tance signals. The participants are given about 20
minutes to learn to fly the quadromotor with the Log-
itech’s G27 Racing Wheel and to get used to the driv-
ing setting.
The main experiment consisted of 5 minutes of
music relaxation and four times of 5-minutes flight.
We designed four different conditions: in terms of dif-
ficulty level (easy trajectory vs. difficult trajectory)
and vocal assistance (vocal assistance activated vs.
vocal assistance not-activated). Trajectories are pre-
defined and announced to the participant before the
beginning of each flight. The participant is asked to
finish each trajectory in 5 minutes or less. If he/she
finishes the trajectory before 5 minutes he/she can
pass to the next condition. The order of the four con-
ditions are changed from one participant to another.
After each condition, the participant is asked to an-
swer a questionnaire about his/her emotional impres-
sion about the flight before beginning the next flight.
At the end of the experiment, the participants are
asked to fill-up a last questionnaire about his/her over-
all impression about the system.
3.4 Hypothesis
With the experiment of driving in a real environment,
we want to test the following hypotheses:
• Hypothesis 1. Participants’ heart rate should cor-
relate with the difficulty level of the driving task.
The more difficult the task is, the higher the heart
rate level is.
• Hypothesis 2. The participants’ skin conductiv-
ity should correlate with the repetitiveness of the
driving task. The more repetitive the driving tra-
jectory is, the lower the level of the skin conduc-
tance is.
• Hypothesis 3. The variability of the participants’
physiological signals between task conditions in
the real world environment experiment should be
greater than the variability of these signals in the
simulated environment experiment.
3.5 Data Analysis and Discussion
As stated in the previous section, for the purpose of
this paper, we will present only the results of the phys-
iological signals collected from the experiment. The
average skin conductance level and the average heart
rate of each participant in the drone driving condition
are depicted in Fig. 6 and Fig. 7. The overall aver-
age of these physiological signal data is presented in
Table 2.
Table 2: Overall average (and standard deviation) of the
physiological signals (heart rate in Beat Per Minute and skin
conductance in MicroSiemens) from the experiment of driv-
ing the quadromotor drone in a real environment.
Physio. Signal Heart rate Skin Conductance
Baseline 79 (5) 3.66 (3.1)
Easy level 82 (8) 5.08 (3.2)
Difficult level 84 (9) 4.69 (3.3)
Interestingly, the heart rate and the skin conduc-
tance level of the participants collected during this ex-
periment show the same phenomenon as in the previ-
ous experiment with the simulated driving environ-
ment. This also supports our two hypotheses (i.e.
Hypothesis 1 and Hypothesis 2) about the activity of
these physiological signals for this experiment. It is
observable from Figure 6, Figure 7, and from Table
2) that heart rate correlates positively with the diffi-
culty level of the flight and the skin conductance sig-
nal correlates negatively with the difficulty level of the
flight. Moreover, the variation of physiological sig-
nals in this experiment is larger than in the previous
experiment. This can show that human subjects have
higher internal reactions in real situations rather than
PhyCS2014-InternationalConferenceonPhysiologicalComputingSystems
382
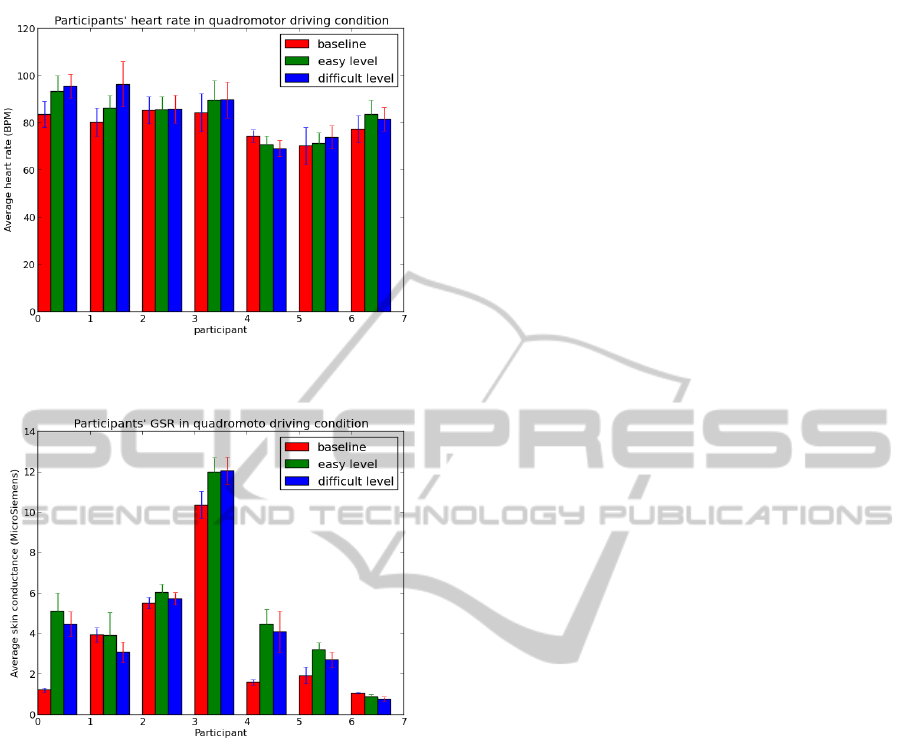
Figure 6: Average heart rate of the participants in quadro-
motor drone driving condition.
Figure 7: Average skin conductance level of the participants
in quadromotor drone driving condition.
in the simulated situations. This supports our Hypoth-
esis 3 about the variability of the subjects’ physiolog-
ical signals in real situations comparing to simulated
situations.
From these results, we suggest that heart rate is a
better indicator of the human subject’s cognitive load
while the skin conductance is best to describe how hu-
man subjects’ feel about the task’s novelty. The num-
ber of events to be processed while executing a task
can affect the human’s heart rate, the repetitiveness
of a task can influence the human’s skin conductance
level. However, our current findings are from a very
small population, thus need more experimental data
to be conclusive.
4 CONCLUSIONS
Throughout the paper, we have been presenting our
early findings about how to use heart rate activity and
skin conductance to predict different aspect of hu-
man’s cognitive load in driving situations (car sim-
ulation and drone real-world). Via one experiment
in simulated car driving environment and one exper-
iment in real drone driving situation, we found that
heart rate can reveal information about how cogni-
tively charged people are when confronting with oc-
curring events while driving, whereas skin conduc-
tance would help us to know if the driver is con-
fronting with a novel situation or not. However, sta-
tistical analysis on larger test population is needed in
order to validate the suggested hypotheses. More ex-
periments are schedule and we will report our further
findings in future publications.
ACKNOWLEDGEMENTS
This work was supported by the French National Re-
search Agency (ANR) through Chaire D’Excellence
program 2009 (Human-Robot Interaction for Assis-
tive Applications).
REFERENCES
Dang, T., Hutzler, G., and Hoppenot, P. (2011). Emotion
modelling for intelligent agents - towards a unifying
framework. In WI-IAT ’11, 2011 IEEE/WIC/ACM In-
ternational Conferences on Web Intelligence and In-
telligent Agent Technology. IEEE Computer Society.
Davies, I. and Robinson, P. (2011). Emotional investment
in naturalistic data collection. In International Con-
ference on Affective Computing and Intelligent Inter-
action.
Engstrom, J., Johansson, E., and Ostlund, J. (2005). Effects
of visual and cognitive load in real and simulated mo-
torway driving. In Transportation Research.
Lazarus, R. S. (1991). Emotion and Adaptation. Oxford
University Press, London, 2nd edition.
Leite, I., Henriques, R., Martinho, C., and Paiva, A. (2013).
Sensors in the wild: exploring electrodermal activity
in child-robot interaction. In Proceedings of the 8th
ACM/IEEE international conference on Human-robot
interaction, HRI ’13, pages 41–48. ACM/IEEE Press.
Liu, C., Rani, P., and Sarkar, N. (2006). Human-robot inter-
action using affective cues. In RO-MAN ’06.
Matthews, G. and Zeidner, M. (2000). Emotional intelli-
gence, adaptation to stressful encounters and health
outcomes. In Handbook of emotional intelligence.
Scherer, K. R. (1986). On the nature and function of emo-
tion: A component process approach. In Approaches
to emotion.
PhysiologicalSignalsinDrivingScenario-HowHeartRateandSkinConductanceRevealDifferentAspectsofDriver's
CognitiveLoad
383

Tessier, C. and Dehais, F. (2012). Authority management
and conflict solving in human-machine systems. In
The Onera Journal.
Zeidner, M., Matthews, G., and Roberts, R. D. (2006).
Emotional intelligence, adaptation, and coping. In
Emotional intelligence in everyday life: A scientific
inquiry. Psychology Press.
PhyCS2014-InternationalConferenceonPhysiologicalComputingSystems
384
