
Automatic Generation of Questionnaires for Managing Configurable BP
Models
A. Jim´enez-Ram´ırez
1
, B. Weber
2
, I. Barba
1
and C. Del Valle
1
1
University of Seville, Dpto. Lenguajes y Sistemas Inform´aticos, Seville, Spain
2
University of Innsbruck, Department of Computer Science, Innsbruck, Austria
Keywords:
Configurable Business Process Models, Classification Trees, Questionnaires.
Abstract:
Managing large collections of business process (BP) models is increasingly being necessary for organizations.
For this, configurable BP models can be used for managing these BPs while allowing analysts to understand
what these BPs share and what their differences are. Before the execution of the configurable BP model, a BP
model has to be selected from it. This selection is typically performed by an analyst who manually individual-
izes the model in order to address the business requirements. Unlike existing approaches, we propose a totally
automated method to create a questionnaire-based application for guiding a business expert on individualizing
a model.
1 INTRODUCTION
A Business Process (BP) can be defined as a set
of activities which are performed in coordination in
an organization to achieve a business goal (Weske,
2007). These activities can be manual activities, other
BPs, or even pieces of software. Nowadays, in or-
der to support BPs, BP Management (BPM) embraces
methods, techniques, and software to design, enact,
control, and analyze operational processes involv-
ing humans, organizations, applications, and other
sources of information (van der Aalst et al., 2003).
Such management generally follows a strict method-
ology to ensure the quality of the information systems
which are created. Typically, the traditional BPM life
cycle (Weske, 2007) includes four phases, i.e., pro-
cess design & analysis (i.e., a design of the BP is
created following the requirements), system config-
uration (i.e., the software defined in the BP design is
implemented), process enactment (i.e., the software
is executed following the BP design) and evaluation
(i.e., monitoring information or logs are analyzed to
look for design improvements) (Weske, 2007).
It becomes increasingly common for organiza-
tions to deal with large collections of BP models
(e.g., due to company mergers (Rosa et al., 2012),
BP models extracted from declarative specifications
(Jimenez-Ramirez et al., 2013), etc.). Therefore, as
shown in (Dijkman et al., 2012), more and more re-
search is done on BP model collections. In literature,
different techniques are proposed to manage such col-
lections (Dijkman et al., 2012). Among others, vari-
ant management techniques (Rosemann and van der
Aalst, 2007; Gottschalk et al., 2008; Hallerbach et al.,
2010) keep track of BP variants of a similar BP that
co-exist within a collection. Such collections are typ-
ically represented as a configurable BP model (Rose-
mann and van der Aalst, 2007; Rosa et al., 2012), i.e.,
a modeling artifact that captures a family of BP mod-
els in an integrated manner and that allows analysts
to understand what these BP models share, what their
differences are, and why and how these differences
occur. Configurable BP models include specific nodes
called configurable nodes which represent the varia-
tion points of the model.
Before the organizations can execute a config-
urable BP model, it needs to be individualized, i.e.,
a single BP model has to be selected from it. There-
fore, a new phase, namely configuration & individu-
alization, is defined in the BPM life cycle between the
process design & analysis and the system configura-
tion phases (La Rosa et al., 2008).
1.1 Problem Statement
Generally, in order to individualize a configurable BP
model (cf. Fig. 1 (1)), the analyst considers the busi-
ness requirements (i.e., which are typically specified
by the business expert, cf. Fig. 1 (2)) and manu-
ally performs the individualization (i.e., she selects
709
Jiménez-Ramírez A., Weber B., Barba I. and Del Valle C..
Automatic Generation of Questionnaires for Managing Configurable BP Models.
DOI: 10.5220/0004921407090714
In Proceedings of the 6th International Conference on Agents and Artificial Intelligence (ICAART-2014), pages 709-714
ISBN: 978-989-758-015-4
Copyright
c
2014 SCITEPRESS (Science and Technology Publications, Lda.)

Configurable BP Model
1.
X
Manual
Individualization
3.
3.
Analyst
Specific Business
Requirements
2.
Business
Expert
Potential Discrepancies
Restricted Flexibility
BP Model
to be executed
Time Consuming
4.
Figure 1: Motivation.
one of the variants which exist in the configurable
BP model, cf. Fig. 1 (3)). Therefore, this manual
task can be time-consuming and, in addition, it can
lead to discrepancies between the business expert and
the selected BP model. Furthermore, since the dif-
ferent BP models of a configurable BP model share
many commonalities (Rosemann and van der Aalst,
2007) (even in the initial parts of them), selecting
a single BP model at configuration-time unnecessar-
ily restricts the flexibility especially when the context
might change (cf. Fig. 1 (4)).
1.2 Contribution
The current work proposes a method for support-
ing the business expert in individualizing the model
through a questionnaire-based approach, i.e., a se-
quence of questions each one created for individualiz-
ing a part of the model (La Rosa et al., 2008). Taking
a configurable BP model as starting point (cf. Fig. 2
(1)), the questionnaire which is automatically gener-
ated consists of different questions written in the busi-
ness language (i.e., using properties that can be mea-
sured in the BP models of the configurable BP model
and that have enough semantic to be understandable
by the business expert, cf. Fig. 2 (2)). Therefore, the
business expert can individualize the models herself
by answering questions (cf. Fig. 2 (3)) without the
intermediation of the analyst. Furthermore, the gen-
erated questionnaires are intended to individualize the
model in an incremental way, i.e., guiding the execu-
tion of the configurable BP model. Therefore, the pro-
posed method starts individualizing initial parts of the
model and iteratively individualizes further succeed-
ing parts during run-time, i.e., when more information
is available to take decisions (cf. Fig. 2 (4)).
Unlike existing approaches (La Rosa et al., 2008;
Rosa et al., 2009), the current work proposes a
method for automatically generating questionnaires
for managing configurable BP models.
In this work, a preliminary study of the aforemen-
tioned process (cf. Fig. 2) is conducted. The main
contributions of this paper are: (1) the automatic gen-
eration of questionnaires for a configurable BP model
and (2) the method for using such questionnaires at
run-time for guiding the execution of a configurable
BP model.
This paper is organized as follows: Sect. 2 intro-
duces backgrounds on related areas, Sect. 3 shows
how the questionnaires are created from a config-
urable BP model and how they can used at run-time,
and Sect. 4 includes some conclusions and future
work.
2 BACKGROUND
In this paper, BP models (cf. Sect. 2.1) are consid-
ered as parts of configurable BP models (cf. Sect.
2.2). Such configurable BP models are used as start-
ing point for automatically generating questionnaires
(cf. Sect. 2.3) which will individualize them.
2.1 Business Process Models
BPs are commonly used to coordinate activities be-
tween organizations. To deal with BPs, in this work
the BP graph definition (cf. Def. 1) introduced in
(Rosa et al., 2012) is used.
Definition 1. A BP Graph G = (gid, N, Pairs) is iden-
tified by gid and consists of a set of pairs of nodes
n ∈ N, i.e., Pairs. Each pair denotes a direct edge
between two nodes in the graph. A node n ∈ N is a
tuple < nid, l, t > where nid is an unique identifier of
a node in the graph, l is its label, and t is its type.
Such definition of graph allows to represent a
BP model in many different BP languages (BPMN,
2011), e.g., BPMN or EPC (cf. Example 1). As an ex-
ample, the types of nodes (i.e., t) in BPMN language
(BPMN, 2011) are ’activity’, ’event’, or ’gateway’. A
node of type ’gateway’ allows labels (i.e., l) ’AND’,
’OR’, ’XOR’, etc., while ’event’ nodes allow ’start’
and ’end’ labels.
ICAART2014-InternationalConferenceonAgentsandArtificialIntelligence
710

Delayed Decissions
Business Language
Configurable BP Model
1.
X
Automatic
Business
Expert
Answers
3.
Guided Execution
Partial BP Model
4.
Questionnaire
2.
Figure 2: Overview of our contribution.
Book hotel
Select clothes
Pack luggage
0 1 2 3 4 5
select
+
(b) BP Graph (BPMN)
pack
book
+
(a) Gantt Chart
Figure 3: A schedule (a) as a BP Graph (b).
Example 1. Figure 3 (a) shows three activities which
are scheduled to prepare a holiday and they are de-
picted as a Gantt chart (Gantt, 1913). The activ-
ities ’book a hotel’, ’select the clothes’ and ’pre-
pare the luggage’ are considered. In addition, Fig.
3 (b) shows the related BP graph using BPMN.
This graph consists of the following 7 nodes (cf.
Def. 1): <1, start, event>, <2, AND, gateway>,
<3, book, activity>, <4, select, activity>, <5, AND,
gateway>, <6, pack, activity> and <7, end, event>;
which are paired (cf. Def. 1) as follows: (1, 2), (2, 3),
(2, 4), (3, 5), (4, 5), (5, 6), and (6, 7).
2.2 Configurable BP Model
Typically, different BPs (cf. Def. 1), also called
variants, can be performed in scenarios which en-
tail high variability. In most cases these plans share
many commonalities. Hence, these variations can be
combined in a configurable BP model (i.e., a mod-
elling artifact that capture a family of BP models in
an integrated manner) leading to a compact represen-
tation (Rosa et al., 2012; Rosemann and van der Aalst,
2007; La Rosa et al., 2008; van der Aalst et al., 2006).
Generally, configurable BP models allow analysts to
understand what these variations share, what their dif-
ferences are, and why and howthese differences occur
(Rosemann and van der Aalst, 2007).
Configurable BP models are typically created by
hand (1) from scratch, (2) from an existing BP model
by including possible adaptations (Gottschalk et al.,
2008), or (3) by merging some BP models related to
the same or similar goals which already exist (Rosa
et al., 2012; Jimenez-Ramirez et al., 2013). In the
last case, the source BP models need to be compared
and merged, which might result in a tedious, time-
consuming and error-prone process if it is performed
by hand (Rosa et al., 2012). To overcome these prob-
lems, there exist approaches focused on automatically
merging different BP models in a configurable BP
model (Rosa et al., 2010; Rosa et al., 2012).
Configurable BP models can be represented by
configurable BP graphs, which are defined (cf. Def.
2) based on (Rosa et al., 2012).
Definition 2. A Configurable BP Graph CG =
(G, E2I, N2LI) consists of: (1) a graph, G =
(gid, N, Pairs) (cf. Def. 1), (2) a function E2I that
maps each edge e ∈ Pairs to a set of BP graph identi-
fiers (i.e., E2I identifies which branches of CG belong
to each source BP graph which is merged in CG), (3)
a function, N2LI that maps each node n ∈ N to a set
of pairs < gpid, l > where gpid is a BP graph iden-
tifier and l is the label of node n in graph gpid (i.e.,
N2LI identifies which nodes, with the corresponding
label, belong to each graph which is merged in CG).
A configurable BP graph includes configuration
nodes for those points where the BP graphs which
are included differ (cf. Example 2). Therefore, each
branch and node of the configurable BP graph can be
related either to one or more BP graphs. To store these
relations, each branch/node of the configurable BP
graph includes identifiers related to the correspond-
ing BP graph (i.e., E2I function). In addition, nodes
also store the associated label related to each identifier
(i.e., N2LI function).
Example 2. Figure 4 shows 2 graphs which are
merged into a configurableBP model
1
. The first gate-
way in Fig. 4(b) is a configurable node which corre-
sponds to an ’OR’ gateway in the process 1 (it does
not explicitly appear) and an ’AND’ gateway in the
process 2.
2.3 Questionnaires
Questionnaire models (Rosa et al., 2009) are gener-
ally created to support the user during the individual-
1
As there is not ambiguity, some labels are not shown
(i.e., they are the same as in the branch).
AutomaticGenerationofQuestionnairesforManagingConfigurableBPModels
711

(a) Graphs (BPMN)
pack
select
book
R1
R1
R1
select
x
book
R1
R2
x
select
R1
x x
(b) Configurable BP Graph
1,2
1
2
2
<1,or>
<2, and>
1.
2.
select
+
pack
book
R1
R2
R1
+
pack
R1
Figure 4: Two BP graphs (a) are merged into a single con-
figurable BP graph(b).
ization of the configurable BP models. The main ben-
efits of using them are: (1) they guide the user in such
a way that choices are presented in a proper order and
(2) they avoid invalid configurations which may lead
to errors.
Typically, questions which are within a question-
naire are manually created. In addition, such ques-
tions are related to boolean facts which are associ-
ated to configuration actions (the reader is referred to
(Rosa et al., 2009) for a review on interactive ques-
tionnaires). Therefore, each time a question is an-
swered, an action is fired which individualizes a part
of the model. The sequence of answers to differ-
ent questions will individualize the configurable BP
model in such a way a single BP model is selected.
Unlike the work presented in this paper, question-
naires generally individualize configurable BP mod-
els before starting the execution and thus, unneces-
sarily restricting the flexibility.
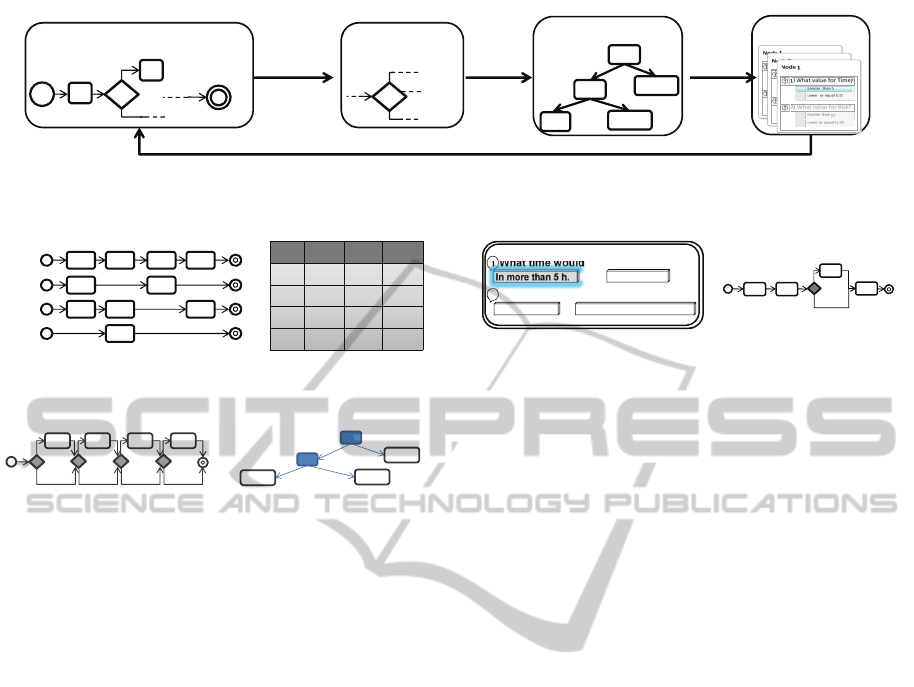
3 THE PROPOSED METHOD
In this section, the proposed method (cf. Fig. 5) is
described.
3.1 Configurable BP Model
As an initial step, to track the BP models during the
method, all of them are labeled (cf. Example 3).
Then, the configurable BP model (cf. Fig. 5 (2)) is
executed until a configurable node appears (cf. Fig. 5
(2)).
Example 3. For the sake of simplicity, the running
example of Fig. 6(a) comprises four BP models which
represent different ways of executing four activities
(i.e., A, B, C and D). Each BP model is label with
an integer. Furthermore, a group of properties of the
application domain for each BP model is provided
(cf. Fig. 6 (b) where time (T), benefit (B) and risk
(R) properties are provided for each model).
2
Such
2
This properties are manually provided and must be
well-defined to be understandable by the domain expert.
properties are related to the business language, e.g.,
T is related to how long the business is opened and
R refers to the maximum risk that the business can
afford.
The configurable BP model associated to the
aforementioned four BP models are depicted in Fig.
7(a). In this model, four different configurable nodes
are depicted with a bold diamond. In the first config-
urable node, labeled as 1, two alternatives are possi-
ble. The left branch comprises variant 4 (i.e., where
activity A is not executed), and the right branch com-
prises variants 1 to 3 (where activity A is executed).
3.2 Generating Classification Trees
When a configurable node is encountered we apply
a method for generating a set of questions related to
this node. Among other techniques as discrimination
or cluster analysis, the current method uses classifica-
tion trees (i.e., models that predict the value of a target
variable based on several inputs variables) (Breiman,
1984) to predict which outgoing branch would cor-
respond to a given assignment of property value.
3
Specifically, for each configurable node which is en-
countered, a classification tree is created (cf. Fig. 5
(3)) using the property values of the BP models as in-
put variables (cf. Example 4).
Example 4. Fig. 7(b) shows the classification
tree which results from using the CART algorithm
(Breiman, 1984)
4
by providing the table of Fig. 1(b)
as input variables and the strings left and right as
target variables. As can be seen, in the resulting clas-
sification tree, the BP models for which T > 5 corre-
spond to the right branch. In contrast, the BP models
for which T ≤ 5 correspond to (1) the righ branch if
R ≤ 10, (2) to the left branch otherwise.
3.3 Generating Questions
A set of questions is then created for each decision
tree (cf. Fig. 5 (4)). For this, one question is auto-
matically generated for each intermediate node of the
decision tree, and the possible answers for the ques-
tion are the different labels which are written on the
outgoing branches of this node. These questionnaires
are in charge of narrowing down the variants of the
configurable BP model.
3
Though other techniques can be use for classifying, we
select the decision trees because of its hierarchical feature.
4
Different methods can be used to create a classifica-
tion tree. The suitability and quality of each classification
method depend on the characteristics of the data. This anal-
ysis is out of the scope of the current approach.
ICAART2014-InternationalConferenceonAgentsandArtificialIntelligence
712
Questions
Decission Tree
Next Configurable
Node
1.
Execute until
Configurable
Node
X
Configurable BP Model
X
1-3,50
21,32
5,11,14
Generate
Decission
Tree
P1
>
right
P2
>
left
…
2. 3.
Create
Questions
4.
Answer questions to individualize the model
…
…
…
Figure 5: The proposed method.
label
T B R
1 12 11 30
2 5 3 10
3 10 13 30
4 5 4 20
1
2
3
4
a)
A B C D
A C
A B D
B
b)
Figure 6: (a) Different BP models. (b) Table of BP model
properties.
T
>5
≤5
right
R
>10
≤10
left
right
1
1
1
2 3 4
4
2
3,4
2,4
1,2,3
1,3,4
1,2
1,3
A B C D
a) b)
Figure 7: (a) Configurable BP model related to the BP mod-
els of Fig. 6(a). (b) Classification tree for node 1.
The text of the questions are automatically gener-
ated from the information of the properties (cf. Ex-
ample 5).
Example 5. A simple questionnaire related to the de-
cision tree of Fig. 7(b) is shown in Fig. 8(a). Since
this decision tree has two intermediate nodes (i.e., T
and R), two questions are created. Moreover, since
each node has two branches, each question has two
options. Initially, only the question related to T is
enabled. Considering that the well-defined business
properties stated that T is related to the closing time
of the office, the generated question would look like
What time would you close the office?. The second
question has to be answered only if the user selects
the second option of the first question (i.e., In 5h. or
less) which is related to the branch T ≤ 5 of the deci-
sion tree.f
3.4 Incremental Configuration
Once a questionnaire is resolved, the configurable BP
model is individualized by removing the BP models
that do not belong to the edge which result selected in
the questionnaire. Thereafter, the model is executed
until a new configurable node is reached (cf. Example
6).
Example 6. Supposing that the user selects the first
answer of the first question of the questionnaire of
Fig. 8(a) (i.e., In more than 5 h.), BP models 2 and
In more than 5 h. In 5 h. or less
What is the maximum ‘Risk’ affordable?
Can be over 10 Must be lower or equal to 10
1
2
a)
C
3
A B
3
D
1
What time would you close the office?
Node1
b)
Figure 8: (a) Questionnaire for node 1. (b) The resulting
configurable model after removing variants 2 and 4.
4 are removed from the configurable model since they
have a time property ”≤ 5”. This results in the con-
figurable BP model of Fig. 8(b). The second and
forth configurable nodes of Fig. 7(a) are not de-
picted in Fig. 8(b) since BP models 1 and 3 belong
to the same outgoing branches in these nodes, i.e., the
right branch. However, the third configurable node
requires to select one of the two branches, and then
a new questionnaire is generated. The configuration
process continues until only one BP model remains
(i.e., representing one specific variant) in the config-
urable BP model.
4 CONCLUSIONS AND FUTURE
WORK
The manual individualization of configurable BP
models is time consuming and typically requires sup-
port by an analyst. Questionnaire-based approaches
are suitable methods to support the user while indi-
vidualizing these models. However, to the best of our
knowledge, there is not an automatic method for gen-
erating such questionnaires (Rosa et al., 2009).
In this paper an automatic method for generating
questionnaires is proposed based on the domain vari-
ables of the configurable BP model. The generated
questionnaires are proposed to be used to individu-
alize the model during its execution. The initial ex-
perimental results over a case of study are promising.
As future work we plan to (1) improve the semantics
of the questions which are created since they seem
too artificial and (2) conduct several case studies to il-
lustrate the feasibility of the proposed method at run-
time.
AutomaticGenerationofQuestionnairesforManagingConfigurableBPModels
713

REFERENCES
BPMN (2011). Business Process Model and Notation
(BPMN), Version 2.0. url http:/www.omg.org/spec/
BPMN/2.0/. [Online; accessed 1-June-2011].
Breiman, L. (1984). Classification and regression
trees. The Wadsworth and Brooks-Cole statistics-
probability series. Chapman & Hall.
Dijkman, R., Rosa, M. L., and Reijers, H. A. (2012). Man-
aging large collections of business process models-
current techniques and challenges. Comput. Ind.,
63(2):91–97.
Gantt, H. (1913). Work, wages, and profits. Engineering
Magazine Co.
Gottschalk, F., van der Aalst, W. M., Jansen-Vullers, M. H.,
and La Rosa, M. (2008). Configurable workflow mod-
els. International Journal of Cooperative Information
Systems (IJCIS), 17(2):177–221.
Hallerbach, A., Bauer, T., and Reichert, M. (2010). Captur-
ing variability in business process models: The provop
approach. Journal of Software Maintenance and Evo-
lution: Research and Practice, 22(6-7):519–546.
Jimenez-Ramirez, A., Barba, I., Del Valle, C., and Weber,
B. (2013). Generating multi-objective optimized busi-
ness process enactment plans. In Salinesi, C., Nor-
rie, M., and Pastor, s., editors, Advanced Information
Systems Engineering, volume 7908 of Lecture Notes
in Computer Science, pages 99–115. Springer Berlin
Heidelberg.
La Rosa, M., Dumas, M., and ter Hofstede, A. H. (2008).
Modelling business process variability for design-time
configuration. Handbook of Research on Business
Process Modeling.
Rosa, M., Aalst, W., Dumas, M., and ter Hofstede, A.
(2009). Questionnaire-based variability modeling for
system configuration. Software & Systems Modeling,
8(2):251–274.
Rosa, M. L., Dumas, M., Kaarik, R., and Dijkman, R. M.
(2010). Merging business process models. In 18th
International Conference on Cooperative Information
Systems (CoopIS ‘10) 2010, pages 96–113, Crete,
Greece. Springer-Verlag Heidelberg.
Rosa, M. L., Dumas, M., Uba, R., and Dijkman, R. M.
(2012). Business process model merging : An ap-
proach to business process consolidation. ACM Trans-
actions on Software Engineering and Methodology
(TOSEM).
Rosemann, M. and van der Aalst, W. (2007). A configurable
reference modelling language. Inform Syst, 32:1–23.
van der Aalst, W., Dreiling, A., Gottschalk, F., Rosemann,
M., and Jansen-Vullers, M. (2006). Configurable pro-
cess models as a basis for reference modeling. In
Bussler, C. and Haller, A., editors, Business Process
Management Workshops, Lecture Notes in Computer
Science, pages 512–518. Springer Berlin Heidelberg.
van der Aalst, W., ter Hofstede, A., and Weske, M. (2003).
Business Process Management: A Survey. In Proc.
BPM, pages 1–12.
Weske, M. (2007). Business Process Management: Con-
cepts, Languages, Architectures. Springer.
ICAART2014-InternationalConferenceonAgentsandArtificialIntelligence
714
