
Should We Beware the Inheritance?
An Empirical Study on the Evolution of Seven Open Source Systems
Cristina Marinescu
1
and Mihai Codoban
2
1
HPC Center, West University of Timis¸oara; Politehnica University Timis¸oara, Timis¸oara, Romania
2
EECS School at Oregon State University, Oregon, U.S.A.
Keywords:
Inheritance, Class Hierarchies, Changes, Defects, Source Code, Software Repositories.
Abstract:
One of the key mechanisms of object-oriented programming is inheritance. Some empirical studies show that
classes inheriting behavior from more classes (i.e., ancestors) are more defect prone than the other classes.
Since various collaborations are found among the instances of classes, classes are not isolated within the source
code of object-oriented systems. In this paper, we investigate if classes using classes inheriting behaviour from
other classes are more change and defect prone than the other classes. We analyze at least three releases of
every system belonging to a suite of seven open source systems and investigate the relations between classes
that use/do not use class hierarchies and study the change and defect proneness of those classes. The results
frequently show that the clients of classes which inherit behaviour are more change and defect prone. These
findings show a new type of correlation between the clients of class hierarchies and changes/defects, bringing
evidence related to an increased likelihood of exhibiting changes and defects for the clients of class hierarchies.
We believe that the inferred correlations are due to an improper usage of class hierarchies but further studies
are needed for confirmation.
1 INTRODUCTION
One of the key mechanisms of object-oriented pro-
gramming is inheritance. Inheritance is a way to reuse
code of existing objects, establish a subtype from an
existing object, or both. It brings flexibility within the
source code of an object-oriented system but it can
also hamper its understandability and maintenance
when improperly used.
Different approaches that analyze classes coupled
by inheritance relations (i.e., class hierarchies) have
been developed in order to support their evolution.
Some of them analyze the existing class hierarchies in
isolation (Girba et al., 2005) (Lanza and Marinescu,
2006) while others analyze the class hierarchies in
term of theirs clients (Mihancea, 2006) (Mihancea,
2008). Several empirical case studies were conducted
in order to find out if the number of the ancestors used
by (sub)classes is significant in order to predict the
defect proneness of classes (Basili et al., 1996) (Gy-
imothy et al., 2005) (Singh et al., 2010). All of the
mentioned empirical studies analyze classes that are
coupled by inheritance relations in isolation. Accord-
ing to the definition given by Booch in (Booch et al.,
2007) object-oriented programming “is a method of
implementation in which programs are organized as
cooperative collections of objects, each of which rep-
resents an instance of some class, and whose classes
are all members of a hierarchy of classes united via in-
heritance relationships”. Classes do not stand in iso-
lation within the source code of a software system and
Martin points out that a model (i.e., class hierarchy)
cannot be meaningfully validated in isolation and that
it can only be validated in terms of its clients (Martin,
1996).
In this paper we perform an empirical study that
explores the relations between the clients of classes
extending other classes and the change and defect
proneness of those clients. Concretely, we investi-
gate if the clients of classes inheriting behavior have a
higher likelihood to exhibit changes and defects than
the clients of classes that do not inherit behavior from
other classes.
The paper is structured as follows: in Section 2
we explain how we extracted the data involved in this
study. In the first part of the next section (Section 3)
we present the context of the study as well as the ad-
dressed research questions. We continue with a brief
description of the employed statistical tests followed
by the presentation of the performed steps within our
246
Marinescu C. and Codoban M..
Should We Beware the Inheritance? - An Empirical Study on the Evolution of Seven Open Source Systems.
DOI: 10.5220/0005000702460253
In Proceedings of the 9th International Conference on Software Engineering and Applications (ICSOFT-EA-2014), pages 246-253
ISBN: 978-989-758-036-9
Copyright
c
2014 SCITEPRESS (Science and Technology Publications, Lda.)

study. We end the section by pointing out the results
of the study. In Section 4 we relate our empirical
study to existing works. The threats to validity are
presented in Section 5. In the last section (Section
6) we summarize the results and hint towards future
work.
2 DATA COLLECTION
In this work we inspect the correlations (if any) be-
tween the clients of classes extending other classes
and their change and defect proneness on seven evolv-
ing open source systems developed using Java. Some
characteristics of the inspected systems are presented
in Table 1. We analyze releases of the mentioned sys-
tems and the time distance between two releases is ap-
proximately one year – when a release was deployed
earlier or later than one year we consider the nearest
release to the specified period.
Extracting the required data involves three steps,
and we dedicate the next three sections to each of
these steps.
2.1 Extracting Entities from the Source
Code
In order to extract the existing classes from the source
code as well as the values of the used metrics we
use IPLASMA(Marinescu et al., 2005).
1
IPLASMA
is an integrated environment for quality analysis of
object-oriented software systems that includes sup-
port for different phases of analysis – from model ex-
traction (including scalable parsing for C++ and Java)
up to high-level metrics-based analysis or detection
of code duplication. This environment relies on the
MEMORIA (Rat¸iu, 2004) meta-model which spec-
ifies the main entities which are extracted from the
source code. We create within this environment a
new analysis which provides for each class having the
same name as the file it belongs to the values of the
used metrics. These values are stored within a CSV
(comma-separated values) file which is further pro-
cessed by the R environment
2
(R Development Core
Team, 2010). The values of the metrics strongly de-
pend on the quality of the entities that are extracted
from the source code. According to (Marinescu and
Marinescu, 2011) the existing entities (i.e., classes,
methods, calls and accesses) are captured from the
source code with a high precision and recall.
1
http://loose.upt.ro/iplasma.
2
http://www.r-project.org.
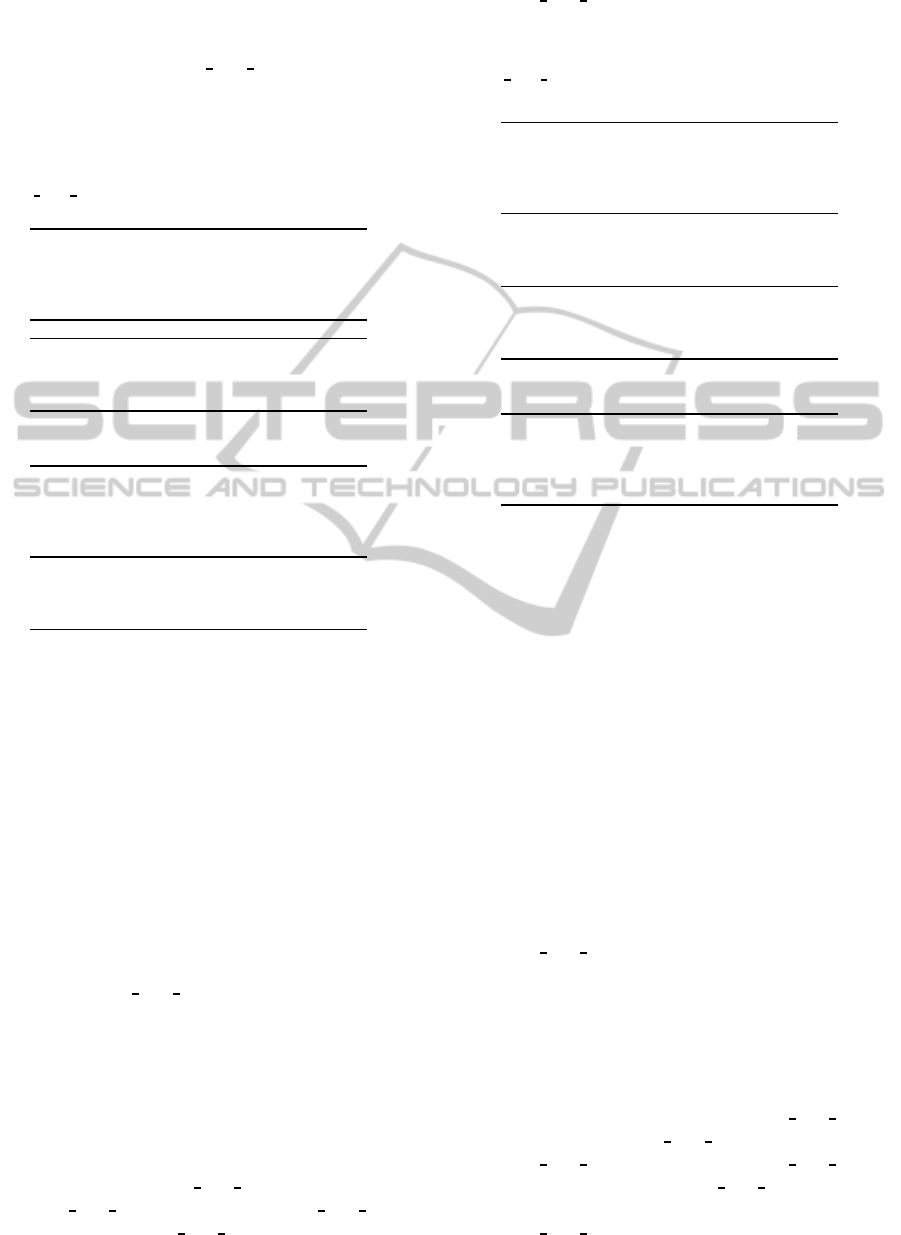
Figure 1: DIT and USED DIT MAX: an Example.
For each extracted class from the source code we
computed two metrics, DIT – Depth of Inheritance
Tree introduced in (Chidamber and Kemerer, 1994)
as the maximum length from the measured class to
the root of the tree and USED DIT MAX – a metric
for quantifying how clients use services from classes
involved in inheritance relations. We consider a class
being a client of another class if the client calls at least
one method from the other class. The value of the
USED
DIT MAX metric for each class is:
• 0 if the measured class (C) do not call external
methods (services) or do not use derived classes.
• MAXIMUM (DIT C
1
,DIT C
2
,...,DIT C
n
) where
DIT
C
1
,DIT C
2
,...,DIT C
n
denote the values of
the DIT metric for each class C
i
providing at least
one service to class C.
In Figure 1 we present an example that shows
the values of the two computed metrics, DIT and
USED
DIT MAX. For the hierarchy of classes lo-
cated left the values of DIT are 0 (C1 is the root of
the hierarchy), 1 (for C2) and 2 (for C3), while for the
hierarchy of classes located right the values of DIT
are 0 (for D1) and 1 (for D2 and D3). The values of
USED
DIT MAX for all the classes belonging to the
existing hierarchies are 0 because the classes do not
use external services. For the Client class, the value
of DIT is 0 and the value of USED
DIT MAX is 2.
2.2 Extracting Changes and Defects
For each class we extracted the corresponding
changes and defects between release i and release i+
1 using IPROBLEMS (Codoban et al., 2011). IPROB-
LEMS takes for each inspected release i as inputs the
xml dumps of the repository extracted from SVN or
CVS and the bug tracking system between release i
and release i + 1. For each class only the changes
that were performed at least between 200 seconds are
measured, as it is presented in (Zimmermann et al.,
2004). In order to tie defects to source code entities
we follow the approach presented in (Oram and Wil-
son(editors), 2010), Chapter 27, Mining Your Own
Evidence. This approach is probably the most used
when extracting defects and many empirical studies
ShouldWeBewaretheInheritance?-AnEmpiricalStudyontheEvolutionofSevenOpenSourceSystems
247
Table 1: Some Characteristics of the Analyzed Systems.
System Referred Start Date End Date Version Bug Tracking LOC Types USED
DIT MAX
Version Archive System
ArgoUML 1 30/11/2003 30/11/2004 SVN Issuezilla 83,487 1180 8
2 01/12/2004 09/02/2006 107,125 1237 9
3 10/02/2006 13/02/2007 155,223 1476 11
4 14/02/2007 27/09/2008 144,075 1550 11
5 28/09/2008 16/08/2009 170,777 1780 11
DrJava 1 11/05/2006 24/05/2007 SVN SourceForge 64,684 519 7
2 25/05/2007 20/08/2008 66,412 225 5
3 21/08/2008 21/08/2009 75,188 249 6
4 22/08/2009 13/09/2010 81,263 256 6
FindBugs 1 31/05/2006 31/05/2007 SVN SourceForge 52,206 635 6
2 06/01/2007 06/05/2008 73,484 791 6
3 05/07/2008 05/08/2009 84,638 931 6
4 08/06/2009 30/11/2010 98,082 1022 6
FOP 1 26/03/2008 31/07/2008 SVN Bugzilla 89,398 933 6
2 01/08/2008 02/08/2009 97,397 1089 6
3 03/08/2009 25/12/2010 120,255 1457 7
FreeCol 1 23/06/2005 23/07/2006 SVN SourceForge 30,901 184 6
2 24/07/2006 13/07/2007 42,556 234 6
3 14/07/2007 11/07/2008 58,572 334 6
4 12/07/2008 01/08/2009 66,695 399 6
5 02/08/2009 08/08/2010 74,815 432 6
JFreeChart 1 28/11/2003 30/11/2004 CVS SourceForge 71,827 679 6
2 01/12/2004 19/06/2007 75,660 664 6
3 20/06/2007 09/06/2008 SVN 70,803 516 6
4 10/06/2008 20/04/2009 77,445 546 6
JMeter 1 13/08/2005 13/06/2006 SVN Bugzilla 63,254 806 7
2 14/06/2006 11/07/2007 74,986 959 7
3 12/07/2007 10/06/2008 66,765 771 7
4 11/06/2008 17/06/2009 72,369 808 7
5 18/06/2009 08/07/2010 74,636 837 7
like the ones from (Zimmermann et al., 2007) (Gyi-
mothy et al., 2005) (Khomh et al., ) relies on it. It
is based on the following software developers’ good
practice that formalizes the way they handle and fix
bug reports: (i) all defects are reported through a
bug tracking system (e.g., Bugzilla, Issuezilla, bug
databases provided by SourceForge filled from the
bug tracking system), and (ii) upon committing bug
fixing code the developers enter the bug tracking sys-
tem defect’s id (bugID) in the revision’s commit mes-
sage, thus linking a repository transaction to a partic-
ular defect.
Outliers. We perform a manual inspection of the ex-
tracted changes and defects and find out that DrJava
exhibits three releases where only one class was not
changed (DrJava 2-4) and all the considered releases
extracted from the version control system of JMeter
exhibit a small number of classes affected by defects
(e.g., 7 classes in JMeter1, 5 classes in JMeter4). Con-
sequently we consider DrJava 2-4 as outliers when
considering changes and JMeter 1-5 outliers when
consider defects and this is the reason we exclude
these releases when analyzing changes, respectively
defects.
3 CONDUCTING THE
EMPIRICAL STUDY
The research questions of this study are:
• (RQ1.) Are the classes with high
USED
DIT MAX values more likely to change
than the classes with low USED
DIT MAX
values?
• (RQ2.) Are the classes with high
USED DIT MAX values more defect prone
than the classes with low USED
DIT MAX
values?
RQ1. In order to answer our first research ques-
tions we employ the Chi-Square Test (Sheskin, 2007).
This test evaluates if within the underlying popula-
tion represented by the sample in a contingency table
(rxc), the observed cell frequencies are different from
the expected frequencies. The evaluated hypothesis is
that the two involved dimensions of the contingency
table are independent of one another.
In our study the structure of the contingency ta-
ble corresponding to the Chi-Square Test consists
of two dimensions: USED
DIT MAX and Changes.
ICSOFT-EA2014-9thInternationalConferenceonSoftwareEngineeringandApplications
248
The USED DIT MAX dimension is the row dimen-
sion (i.e., independent) and the Changes is the col-
umn dimension (i.e., dependent). The hypothesis that
is evaluated is related to the independence of the two
dimensions from the contingency table.
The row dimension consists of seven categories,
each category revealing a USED
DIT MAX value be-
longing to the following set {0, 1, 2, 3, 4, >4}. We
make a distinction among classes that do not use ex-
ternal providers (NO) and classes that use external
providers which do not extend other classes (both of
these categories exhibit USED
DIT MAX = 0). We
establish for the last category a USED
DIT MAX
value greater than four based on our observation
showing that the higher than four USED
DIT MAX
is, the lower the number of classes belonging to this
category and, consequently, the higher chances of vi-
olating the assumption of the Chi-Square Test, in re-
spect to the expected frequency.
The two categories which compose the Changes
dimension are: Reveal changes – the class reveal at
least a change and Do not reveal changes – the class
does not reveal a change.
We create an instance of the described 7x2 contin-
gency table for each analyzed version of the inspected
systems. For example, Table 2 shows that ArgoUML1
has 103 classes that use classes which are not involved
in inheritance relations and reveal changes (the up-
per left value associated to the Cell O
21
), 73 classes
that use classes which are not involved in inheritance
relations and do not reveal changes (the upper right
value associated to the Cell O
22
), 136 classes that use
classes having at least a corresponding value of the
DIT metric equal to 5 (the bottom left value associ-
ated to the Cell O
71
) and show changes. The men-
tioned table also shows the Column Sums (e.g., 870
(O
.1
) classes revealing changes) and the Row Sums
(e.g., 176 (O
2.
) classes that use classes that do not in-
herit behavior).
Table 2: ArgoUML1: Contingency Table for Changes.
No
USED DIT MAX Changes Changes Sums
NO 142 93 235
0 103 73
176
1 224 60
284
2 140 11
151
3 55 3
58
4 70 6
76
>4 136 22
158
Sums 870 268 1138
The hypothesis that is evaluated with the Chi-
Square Test is related to the independence of the two
dimensions from the contingency table.
Null Hypothesis: H
0
: o
ij
= ε
ij
, where o
ij
rep-
resents the observed frequency of Cell
ij
, ε
ij
repre-
Table 3: ArgoUML1: Expected Values for Changes.
USED
DIT MAX Changes No Changes
NO 179.65 55.34
0 134.55 41.44
1 217.11 66.88
2 115.43 35.56
3 44.34 13.63
4 58.10 17.89
>4 120.79 37.20
sents the expected frequency of Cell
ij
in the under-
lying population of classes. Considering the sample,
it means that the observed frequency is equal to the
expected frequency for each cell. For the contingency
table revealing changes for ArgoUML1 (Table 2) the
expected values are presented in Table 3. Each ex-
pected value from Table 3 was computed according
to the formula E
ij
=
(O
i.
)(O
. j
)
n
, where (O
i.
) represents
the sum of observations in the row where the cell ap-
pears, while (O
. j
) represents the sum of observations
in the column where the cell appears. The reason be-
hind the above formula comes from the consideration
that the two dimensions of the contingency table are
independent.
Alternative Hypothesis: H
1
: o
ij
6= ε
ij
. This
formula states that in the underlying population of
classes the sample represents, the observed frequency
for at least one cell is different than the expected fre-
quency. With respect to the sample it means that the
observed frequency is not equal to the expected fre-
quency for at least one cell.
For the presented contingency structure from Ta-
ble 2 we compute the values of the Chi-Square test
χ
2
using R (R Development Core Team, 2010). For
the first investigated system the obtained p-value is
less than a 0.05 level of significance (α=0.05) and we
consider we have enough evidence to reject the null
Hypothesis. Consequently, the two dimensions of the
contingency table are not independent.
Next, based on the values of the observed and
expected frequencies, we establish the way (posi-
tive or negative) in which the involved dimensions
are correlated. A trait from the row dimension
is positively correlated with a trait from the col-
umn dimension if the observed frequency is greater
than the expected frequency. Based on this, it is
straight forward to infer that ArgoUML1 reveals a
negative correlation between classes belonging to the
first two categories (do not use external providers,
do not use classes inheriting behavior) and changes
(142<179.65,103<314.20) and a positive correlation
between classes belonging to the rest of the existing
categories and changes (224>217.11, 140>115.43,
55>44.34, 70>58.10, 136>120.79).
ShouldWeBewaretheInheritance?-AnEmpiricalStudyontheEvolutionofSevenOpenSourceSystems
249
In a similar manner we employ the Chi-Square
Test for all the inspected systems. We summarize the
obtained results in Table 4, where + denotes a positive
correlation between USED
DIT MAX and changes,
– denotes a negative correlation and a space denotes
no existing correlations (p-value greater than 0.05).
From Table 4 we can see that
Table 4: Correlations between Changes and
USED
DIT MAX.
NO 0 1 2 3 4 > 4
ArgoUML 1 – – + + + + +
2 – – + + + – +
3 – – + + + + +
4 – – + – + + +
5 – – + – + + +
DrJava 1 – – – + + - +
FindBugs 1 – – + + + + +
2 – – + – + + +
3 – – + + + + +
4 + – + – + + +
FOP 1
2 – – + + + + +
3 – – + + + + +
FreeCol 1
2 – – + + + + +
3
4 – – – + + + +
5 – – + + + + +
JFreeChart 1 + + + + – – –
2
3
4 – – + + + + +
JMeter 1 – + + – – + +
2 – + + – – + +
3 – – + + + – +
4 – + + + + + +
5 – + – + + – –
• There is no system among which the employed
statistical test reveals no correlation between the
two involved dimensions.
• Out of 27 analyzed versions of the systems, 22
tests reveal some correlations between the two di-
mensions of the contingency tables while 5 tests
reveal no existing correlations.
• With minor exceptions revealed by JFreeChart
and JMeter, all the correlations between classes
having USED
DIT MAX = 0 and changes are
negative. This finding means that classes using
classes that do not inherit behavior from other
classes are less likely to be changed. The same
is for classes which do not make use of external
providers.
• Most of the correlations between clients of classes
that inherit behavior and changes are positive
(e.g., 19 for USED
DIT MAX = 1, 16 for
USED
DIT MAX = 2, 19 for USED DIT MAX
= 3, 17 for USED DIT MAX = 4 and 20 for
USED DIT MAX > 4), meaning that these types
of classes are more likely to exhibit changes.
Table 5: Correlations between Defects and
USED
DIT MAX.
NO 0 1 2 3 4 > 4
ArgoUML 1 – – + – + + +
2 – – – – + + +
3 – – – – + + +
4 – – + + + – +
5 – – + + + + +
DrJava 1 – – – + + + +
2 – – – – – + +
3
4
FindBugs 1 – – + + + – –
2 – – – + + + +
3 – – – – + + +
4 – – + + + + –
FOP 1 – – + + + + +
2 – – + + + + +
3 – – + + + + +
FreeCol 1
2 – – + + + + –
3 – – – + + – +
4 – – – – + + +
5 – – – – + + +
JFreeChart 1
2
3 – – – + + – –
4 – – + – + + –
RQ2. In order to answer the second research
question we employ the same test, having the column
dimension (independent) comprised of the revealed
Defects. We summarize the obtained results in Table
5. From this table we can see that
• Like in the previous inspected case, there is no
system among which the employed statistical test
reveal no correlation between the two involved di-
mensions.
• Out of 25 analyzed versions of the systems, 20
tests reveal some correlations between the two di-
mensions of the contingency tables while 5 tests
reveal no existing correlations.
• All the correlations between classes having
USED
DIT MAX = 0 and defects are negative,
meaning that classes that do not use external
providers or classes that use classes that do not
inherit behavior from other classes are less likely
to exhibit defects.
• Most of the correlations between classes us-
ing classes extending other class/classes and de-
fects are positive (e.g., 10 for USED DIT MAX
= 1, 12 for USED DIT MAX = 2, 19 for
USED
DIT MAX = 3, 16 for USED DIT MAX
= 4 and 15 for USED DIT MAX > 4),
especially when encountering classes having
USED
DIT MAX values greater than 2.
ICSOFT-EA2014-9thInternationalConferenceonSoftwareEngineeringandApplications
250

In order to bring a stronger evidence re-
lated to the correlation between classes with high
USED
DIT MAX and their change and defect prone-
ness we calculate the Odds Ratio for the clients hav-
ing USED
DIT MAX > 0, with respect to the clients
having USED DIT MAX = 0. The Odds Ratio is the
ratio of the odds of an event to occur in one group to
the odds of the event to occur in another group. Odds
indicate how much likely is for an event to occur as
opposed to not occur. If we encounter a value greater
than 1 for the Odds Ratio, it means that the probabil-
ity that an event to occur into the first group is higher
than to occur into the second group.
The computations of the Odds Ratio firstly re-
quire the computation of the Odds. For example, for
the contingency matrix presented in Table 2 the odds
that a class reveal changes in the second condition
(USED
DIT MAX = 0) is computing by dividing 103
to 73 and the odds that a class reveal changes in the
third condition (USED
DIT MAX = 1) is computing
by dividing224 to 60. The Odds Ratio is computed by
dividing two values of the Odds computed for a con-
tingency table. The Odds Ratio for classes belonging
to the third condition with respect to the classes be-
longing to the second condition is ((224/60)/(103/73))
= 3.73, meaning that for the inspected system the
chances for a change to occur in the group of classes
with USED DIT MAX = 1 are 3.73 times higher than
the chances for change to occur in the group of classes
with USED
DIT MAX = 0. We computed the Odds
Ratio for each inspected system and, overall, the me-
dian value of the chances of changes to occur in the
group of classes with USED
DIT MAX > 1 is 3.15
times higher with respect to the group of classes with
USED
DIT MAX = 0. The median of the Odds Ratio
computed for defects is 3.2, for the same two types of
classes. Consequently, the chances for a class having
USED
DIT MAX > 1 to exhibit changes and defects
are significant higher than the chances for a class hav-
ing USED
DIT MAX = 0.
Remarks. Our findings shows that if a class
makes use of a class that inherit behavior from other
class/classes, then it is more likely to exhibit changes
and defects. We consider it is important to mention
that the provided results do not allow us to draw the
conclusion that inheritance is the cause of encounter-
ing more changes and defects among their clients; we
only provided evidence about an existing positive cor-
relation.
We consider our findings may be correlated with
an improper usage of inheritance in the source code.
For example, the clients of classes violating the
Liskov Substitution Principle (Martin, 1996) may re-
veal increased likelihood for exhibiting defects than
the clients of class hierarchies that do not violate
the mentioned principle and the same can happen
for classes that reveal a missing polymorphism de-
sign flaw. The commit messages associated to vari-
ous investigating clients (e.g., the commits messages
for FigModeModelElement class contain: harmonize
updateStereoText methods, addFig() so that it calls its
superclass and GEF knows that something has taken
place, make bigPort a Fig instead of FigRect so that
FigInitialState can use this as a FigCircle) as well as
the fact that we find various clients depending on con-
crete classes support this idea but further empirical
studies are needed to be conducted in order to inves-
tigate the cause/causes for our findings.
4 RELATED WORK
To the best of our knowledge an empirical study
which investigates if the clients of classes inheriting
behavior from other classes have an increased likeli-
hood to exhibit changes and defects than the clients
of classes which do not inherit behavior has not been
conducted. Since there are several works which ad-
dress different problems related to change and defect
proneness of classes in this section we present the
ones we consider closest to our study.
In (Zimmermann et al., 2007) are presented a set
of experiments revealing that complexity metrics, in
combination, can predict defects, suggesting that the
more complex source code is, the more defects it has.
The well-known suite of metrics introduced in (Chi-
damber and Kemerer, 1994) was validated as predic-
tors in various empirical studies like the ones from
(Basili et al., 1996) (Gyimothy et al., 2005) (Singh
et al., 2010) and most of them reveal that it is possi-
ble to predict the defect proneness of the classes be-
longing to the investigated system based on structural
metrics.
Recently many empirical studies whose goal is to
revealthe correlations between classes affected by de-
sign flaws and the exhibited changes and defects have
been conducted. Probably the most used automatic
approach for finding entities affected by various de-
sign flaws is the metrics-based technique. Currently
there are many design flaws that can be detected auto-
matically (like the ones proposed in (Lanza and Mari-
nescu, 2006) (Khomh et al., )) and different tools ac-
company the extraction of design flaws ((Marinescu
et al., 2005) (Moha et al., 2010)). In (Li and Shatnawi,
2007) entities revealing Shotgun Surgery, God Class
and God Methods design flaws were positively asso-
ciated with the number of exhibited defects. Similar
investigations are presented in (Khomh et al., ) (Mari-
ShouldWeBewaretheInheritance?-AnEmpiricalStudyontheEvolutionofSevenOpenSourceSystems
251

nescu and Marinescu, 2011), the last work shifting
the focus from the classes affected by design flaws to
the clients of classes affected by design flaws. The
study provides evidence about a positive correlation
between the clients of flawed classes and the defects
the clients exhibit. Taken in isolation, classes exhibit-
ing the identity disharmonies design flaws (e.g., Data
Class, God Class, Brain Class, Feature Envy) do not
have an increased likelihood to exhibit defects than
classes which do not reveal design flaws but when
those classes are used by their clients the likelihood
for the clients to exhibit defects greatly increases.
5 THREATS TO VALIDITY
In this section we present the threats to validity asso-
ciated to our empirical study, following the guidelines
from (Yin, 2002).
Construct Validity. This type of threats are con-
nected to the extent which the operational measures
for the concepts being studied were established cor-
rectly. Within the case study presented in this paper
they are mainly related to the errors performed during
the data extraction. The possible errors are due to the
extraction of:
• design entities and metrics values. We used the
IPLASMA(Marinescu et al., 2005) integrated en-
vironment that has been heavily used and, conse-
quently, well known and accepted tool in the field.
• changes and defects from version control repos-
itories and bug tracking system. We used prob-
ably the most wide-spread approach for extract-
ing defects (Zimmermann et al., 2007) (Khomh
et al., ) used for investigating defect proneness of
classes in numerous empirical studies and all the
encountered threats to the construct validity that
can be found in existing studies are also found in
our study.
We use only non parametric statistical tests and all the
assumptions required by the used tests were satisfied.
Internal Validity. This aspect of validity is related
to the causal relations that are inferred. Since our
study is an exploratory one, this aspect is not relevant.
External Validity. This threat concerns the pos-
sibility to generalise the provided results. We do
not suggest generalizing our research results to other
systems unless further case studies are performed,
accompanied by inspecting systems implemented in
other languages (C++, C#) or systems that do not be-
long to the open source repositories.
Reliability Validity. This aspect concerns the fact
that a later investigator that conducts the same case
study like the one presented here should obtain the
same results and reach the same conclusions. We
consider we provided enough information about the
conducted study in order for it to be replicated. The
source code of the inspected systems is available and
the xml files needed for extracting changes and de-
fects are also available.
6 CONCLUSIONS. FUTURE
WORK
In this paper we present an empirical study performed
upon a suite of seven open source Java systems that
provides evidence about a positive correlation be-
tween the clients of classes inheriting behavior from
other classes are the change and defect proneness of
those classes. We do not want to suggest that us-
ing a class inheriting behavior from one or more an-
cestors is the cause of an increased likelihood to ex-
hibit changes and defects. However, we do provide
evidence that the usage of classes that extend other
class/classes is most of the times statistically corre-
lated with changes and defects.
We consider our findings may be correlated with
an improper usage of inheritance in the source code.
Consequently, a further step is to answer the follow-
ing research question: Are classes which improperly
use inheritance more change and defect prone than
classes which properly use inheritance? In this con-
text an important question is which are the improper
usages of inheritance we should consider? Some
static analyses related to an improper usage of inher-
itance in the source code that captures the extent to
which the clients of a hierarchy polymorphically ma-
nipulate that hierarchy exist (Mihancea, 2008) . We
believe the list of relevant analyses we should take
into consideration is open for discussions.
We did not take into account polymorphic calls
when we established the clients of a class. Using the
metric-based approach which captures the extend to
which the clients of a hierarchy polymorphically ma-
nipulate the hierarchy from (Mihancea, 2008) and us-
ing fuzzy rules, we can further refine the rules accord-
ing to a class is considered to be used by another class.
We intend to provide within the PROMISE data
set (Boetticher et al., 2007) a database that contains
the extracted changes and defects and replicate this
study against other systems in order to see if the re-
sults obtained in this study can be generalized.
Acknowledgments. The work of Cristina Mari-
nescu was partially supported by the European Union
under Project No. FP7-REGPOT-CT-2011-284595-
HOST. The views expressed in this paper do not nec-
ICSOFT-EA2014-9thInternationalConferenceonSoftwareEngineeringandApplications
252

essarily reflect those of the corresponding project con-
sortium members.
REFERENCES
Basili, V. R., Briand, L. C., and Melo, W. L. (1996). A
validation of object-oriented design metrics as quality
indicators. IEEE Transactions on Software Engineer-
ing.
Boetticher, G., Menzies, T., and Ostrand, T. (2007).
PROMISE Repository of empirical software engineer-
ing data, http://promisedata.org/repository. West Vir-
ginia University, Department of Computer Science.
Booch, G., Maksimchuk, R. A., Engel, M. W., Young, B. J.,
Conallen, J., and Houston, K. A. (2007). Object-
Oriented Analysis and Design with Applications. Ad-
dison Wesley.
Chidamber, S. R. and Kemerer, C. F. (1994). A Metric Suite
for Object-Oriented Design. IEEE Transactions on
Software Engineering, 20(6):476–493.
Codoban, M., Marinescu, C., and Marinescu, R. (2011).
iProblems - an integrated instrument for reporting de-
sign flaws, vulnerabilities and defects. In Proc. Work-
ing Conference on Reverse Engineering (WCRE),
Limerick, Ireland. IEEE Computer Society Press.
Girba, T., Lanza, M., and Ducasse, S. (2005). Characteriz-
ing the evolution of class hierarchies. In Proceedings
of the 9th European Conference on Software Main-
tenance and Reengineering (CSMR). IEEE Computer
Society.
Gyimothy, T., Ferenc, R., and Siket, I. (2005). Empirical
validation of object-oriented metrics on open source
software for fault prediction. IEEE Transactions on
Software Engineering.
Khomh, F., Penta, M. D., Gu´eh´eneuc, Y.-G., and Antoniol,
G. An exploratory study of the impact of antipatterns
on class change- and fault-proneness. Empirical Soft-
ware Engineering, 2012.
Lanza, M. and Marinescu, R. (2006). Object-Oriented Met-
rics in Practice. Springer Verlag.
Li, W. and Shatnawi, R. (2007). An empirical study of
the bad smells and class error probability in the post-
release object-oriented system evolution. Journal of
Systems and Software, 80.
Marinescu, C., Marinescu, R., Mihancea, P., Rat¸iu, D., and
Wettel, R. (2005). iPlasma: An integrated platform for
quality assessment of object-oriented design. In Proc.
IEEE International Conference on Software Mainte-
nance (ICSM Industrial and Tool Volume), Budapest,
Hungary. IEEE Computer Society Press.
Marinescu, R. and Marinescu, C. (2011). Are the clients
of flawed classes (also) defect prone? In Proc.
IEEE International Working Conference on Source
Code Analysis and Manipulation (SCAM), Williams-
burg, USA. IEEE Computer Society Press.
Martin, R. (1996). The Liskov Substitution Principle. C++
Report.
Mihancea, P. F. (2006). Towards a client driven charac-
terization of class hierarchies. In 16th International
Conference on Program Comprehension.
Mihancea, P. F. (2008). Type highlighting: A client-driven
visual approach for class hierarchies reengineering.
In 8th IEEE International Working Conference on
Source Code Analysis and Manipulation.
Moha, N., Gu´eh´eneuc, Y.-G., Duchien, L., and Le Meur,
A.-F. (2010). Decor: A method for the specification
and detection of code and design smells. IEEE Trans-
actions on Software Engineering.
Oram, A. and Wilson(editors), G. (2010). Making Software.
What Really Works, and Why We Believe It. O’Reilly.
R Development Core Team (2010). R: A Language and
Environment for Statistical Computing. R Foundation
for Statistical Computing, Web page: http://www.R-
project.org. ISBN 3-900051-07-0.
Rat¸iu, D. (2004). Memoria: A Unified Meta-Model for Java
and C++. Master Thesis, ”Politehnica” University of
Timis¸oara.
Sheskin, D. J. (2007). Handbook of Parametric and Non-
parametric Statistical Procedures, 4th edition. Chap-
man&Hall/CRC.
Singh, Y., Kaur, A., and Malhotra, R. (2010). Empirical val-
idation of object-oriented metrics for predicting fault
proneness models. Software Quality Journal.
Yin, R. K. (2002). Case Study Research: Design and Meth-
ods., 3rd edition. SAGE Publications.
Zimmermann, T., Premraj, R., and Zeller, A. (2007). Pre-
dicting defects for Eclipse. In Third International
Workshop on Predictor Models in Software Engineer-
ing. IEEE Computer Society.
Zimmermann, T., Weisgerber, P., Diehl, S., and Zeller, A.
(2004). Mining version histories to guide software
changes. In International Conference on Software En-
gineering (ICSE).
ShouldWeBewaretheInheritance?-AnEmpiricalStudyontheEvolutionofSevenOpenSourceSystems
253
