
CANB v4.0: A Model for Simulating Residual Soil Nitrogen and
Nitrogen Leaching in Canadian Regional Scale
J. Y. Yang
1
, C. F. Drury
1
, R., De Jong
2
, E. C. (Ted) Huffman
2
and X. M. Yang
2
1
Greenhouse & Processing Crops Research Centre, Agriculture and Agri-Food Canada, 2585 County Road 20,
Harrow, Ontario, N0R1G0, Canada
2
Eastern Cereal & Oilseed Research Centre, Agriculture and Agri-Food Canada, 960 Carling Ave,
Ottawa, Ontario, K1A 0C6, Canada
Keywords: Canadian Agricultural Nitrogen Budget (CANB) Model, Agri-Environmental Indicators, Residual Soil
Nitrogen, Water Contamination by Nitrogen, Environmental Modeling.
Abstract: A Canadian Agricultural Nitrogen Budget model (CANB v4.0) was developed to calculate two Agri-
environmental Indicators; Residual Soil Nitrogen (RSN) and the Indicator of Risk of Water Contamination
by Nitrogen (IROWC-N) at 1:1M Soil Landscape of Canada scale for all Canadian farmland. The RSN (kg
N ha
-1
) is the amount of inorganic N which remains in the soil at the end of the growing season and it is
calculated as the difference between the total inputs of N and removal of N by the crop and atmospheric
losses. The IROWC-N provides an estimate of the concentration and amount of the RSN which can be lost
due to surface and groundwater via leaching. Both the growing season and non-growing season N leaching
losses were simulated by a daily N leaching model. The outputs are displayed using EasyGrapher software
and mapped using Arc-GIS software. The Ecoregion maps and graphs of the RSN, N lost and IROWCN
from the CANB v4.0 model were displayed and the results were interpreted. The results indicate that there
is an increasing risk of water contamination over time in Canadian farmland. The model can also be used for
policy scenario analysis or integrated into a GIS framework at watershed scales.
1 INTRODUCTION
Nitrogen losses to air and water from agricultural
practices are important issues affecting global
environmental health. For example, N
2
O emissions
from agricultural systems account for 50% of global
greenhouse gases (Rochette et al., 2008) and NH
3
emissions from the soil are involved in the formation
of the PM2.5 (Sheppard et al., 2010). NO
3
, on the
other hand, is easily removed with run off and
leaching water to surface and groundwater bodies,
affecting human and animal health (Drury et al.,
2007). To reduce NOx emissions and leaching losses
in agricultural production systems, we need to
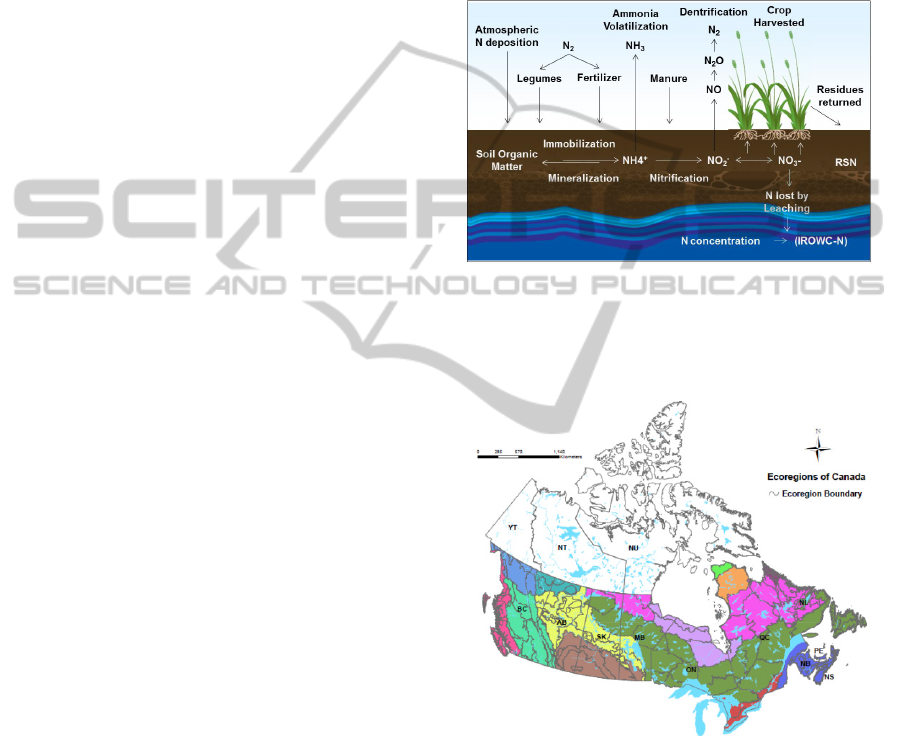
understand and manage the annual nitrogen cycle as
shown in Figure 1. N input to farmland is mainly
from inorganic N fertilizers, manures, legume N
2
fixation and atmosphere N deposition. N output
from farmland is mainly by N removal in harvested
crops, from ammonia volatilization, from
denitrificaiton (N
2
, N
2
O, NO), as well as from NO
3
-
N leaching (Figure 1). Field research or field
modeling on these processes has been conducted for
decades, but regional and national estimates of the
nitrogen cycle in agricultural systems is still a
challenge due to incomplete data sets and the
requirement for developing a larger scale model.
Models of the nitrogen cycle in a larger
agricultural system have been made during last two
decades using survey or census database. For
example, the Organization of Economic Cooperation
and Development (OECD) developed a series of
environmental indicators (OECD 2008), including
the residual soil N indicator. These larger scale
indicators/models show increasing importance in
assessing environmental health as affected by the
agricultural N cycle.
In Canada, a nationwide Agro-environmental
indicator program has been carried out over the last
15 years to develop regional and national water
quality policies (Eilers et al., 2010). For this reason,
a Canadian Agricultural Nitrogen Budget (CANB)
529
Yang J., Drury C., DeJong R., Huffman E. and Yang X..
CANB v4.0: A Model for Simulating Residual Soil Nitrogen and Nitrogen Leaching in Canadian Regional Scale.
DOI: 10.5220/0005005005290536
In Proceedings of the 4th International Conference on Simulation and Modeling Methodologies, Technologies and Applications (SIMULTECH-2014),
pages 529-536
ISBN: 978-989-758-038-3
Copyright
c
2014 SCITEPRESS (Science and Technology Publications, Lda.)
model has been developed to estimate two nitrogen
indicators; (1) the residual soil nitrogen (RSN) and
(2) the indicator of risk of water contamination by
nitrogen (IROWC-N), at the Soil and Landscapes of
Canada (SLC) 1:1M scale.
During the last 10 years, the CANB model has
been updated on a regular basis as new information
and data have become available. The CANB v1.0 to
v3.0 models were integrated with a Canadian
Regional Agricultural Model for policy scenario
analysis (Yang et al., 2007ab; 2011; 2013). A
graphic interface program, EasyGrapher, was also
developed to support visualization of the CANB
outputs (Yang et al., 2014).
Recently, the CANB v4.0 model have just been
updated (methods, parameters) with new databases
of 2011 agricultural census data, N deposition, N
2
O
emission rates and 10 by 10 grid daily weather data
at various scales, representing the state-of-the-art of
larger scale soil N model in Canada. Although the
CANB (v1.0-v3.0) model’s results have been
reported at the SLC, province and Canada scales (De
Jong et al., 2009; Yang et al., 2010, 2013), they were
never reported in ecoregional scales (ecodistrict,
ecoregion and ecozone). The objective of this paper
focuses on reporting the CANB v4.0 model’s design,
I/O structure, scaling up and data visualization
methods. The temporal changes of RSN and N
leaching during 1985-2010 will be illustrated at the
Ecoregion- an inter-mediate scale in Canada’s
ecological classification framework.
2 PROGRAM DESIGN
The CANB model is written using Intel Fortran
compiler. The graphic support software,
EasyGrapher, is written using MS Visual Studio
NET which is linked with MS Excel (Yang et al.,
2014). Arc GIS v10 is used for mapping the model
outputs. The CANB program can be run under
various computer Windows systems. The following
sections describe the CANB input/output data and
structure.
2.1 Soil Landscapes of Canada (SLC)
The SLCs are a series of GIS coverage at a 1:1
million scale organized by a uniform national soil
and landscape criteria based on permanent natural
attributes for the whole SLC polygons
(http://sis.agr.gc.ca/cansis) (Soil Landscapes of
Canada Working Group, 2005). In Canadian
ecosystem framework, the SLC v3.x polygons are
the most detailed spatial entities within the
ecological framework
(
http://sis.agr.gc.ca/cansis/nsdb/ecostrat/index.html),
including a nested hierarchy of 15 Ecozones (i.e.,
each color represent an ecozone in Figure 2), 194
Ecoregions (i.e., curved lines are boundaries of
ecoregions within ecozones in Figure 2), 1027
Ecodistricts (nested within Ecoregions) and 12353
SLC polygons (nested within Ecordistrict) (Table 1).
Figure 1: Conceptual view of the nitrogen cycle in
agricultural soils. Residual soil nitrogen (RSN) is the
amount of inorganic N remaining in the soil after harvest.
IROWC-N is the estimate of the amount of RSN which
leaches from the agricultural soils.
Figure 2: Canada Ecoregions - subdivisions of the
ecozones characterized by distinctive regional ecological
factors, including climate, physiography, vegetation, soil.
Water, fauna and land use.
The names of Canada province (Figure 2) in this
paper were coded as follows: BC: British Columbia,
AB: Alberta, SK: Saskatchewan, MB: Manitoba,
ON: Ontario, QC: Quebec, NB: New Brunswick,
NS: Nova Scotia, PE: Prince Edward Island, NL:
Newfoundland and Labrador. NT: Northwest
Territories, YT: Yukon Territory and NU: Nunavut.
SIMULTECH2014-4thInternationalConferenceonSimulationandModelingMethodologies,Technologiesand
Applications
530

Over the last 15 years, the SLC v3.x has also
compiled with agricultural census database (every
five year) and national climate data (every year) for
use by the National Agri-Environmental Health
Analysis and Reporting Program (Eilers et al.,
2010), the National Carbon and Greenhouse Gas
Emission Accounting and Verification System and
other related national programs.
2.2 Input Data and Collection
The CANB program requires input data from
various scales. (1) The SLC scale datasets that are
geographically located in 3247-3345 Soil
Landscapes of Canada 1:1M polygons (Soil
Landscapes of Canada Working Group, 2005).
These include crop area, animal numbers and crop
managements that come from the census of
agriculture every five years (Table 1). Canadian Soil
Information Service (http://sis.agr.gc.ca/cansis)
provides the SLC v3.2 mapping framework, soil
classification, and profile data. (2) Daily weather
data (1980-2012) were obtained from Canadian
weather framework, and was allocated to each SLC
to drive the water balance model to estimate soil N
loss over both growing and non-growing seasons
(De Jong et al., 2009). (3) Data that are collected at
the provincial scale include industrial fertilizer sales
(CFI, 2006), annual crop yields from Statistics
Canada (2003), fertilizer N application rates from
provincial agronomic recommendations and manure
storage and management methods from Farm survey
(Yang et al., 2011). (4) Data from the Canada scale
include average N fixation rates and animal N
excretion rates (Yang et al., 2007a).
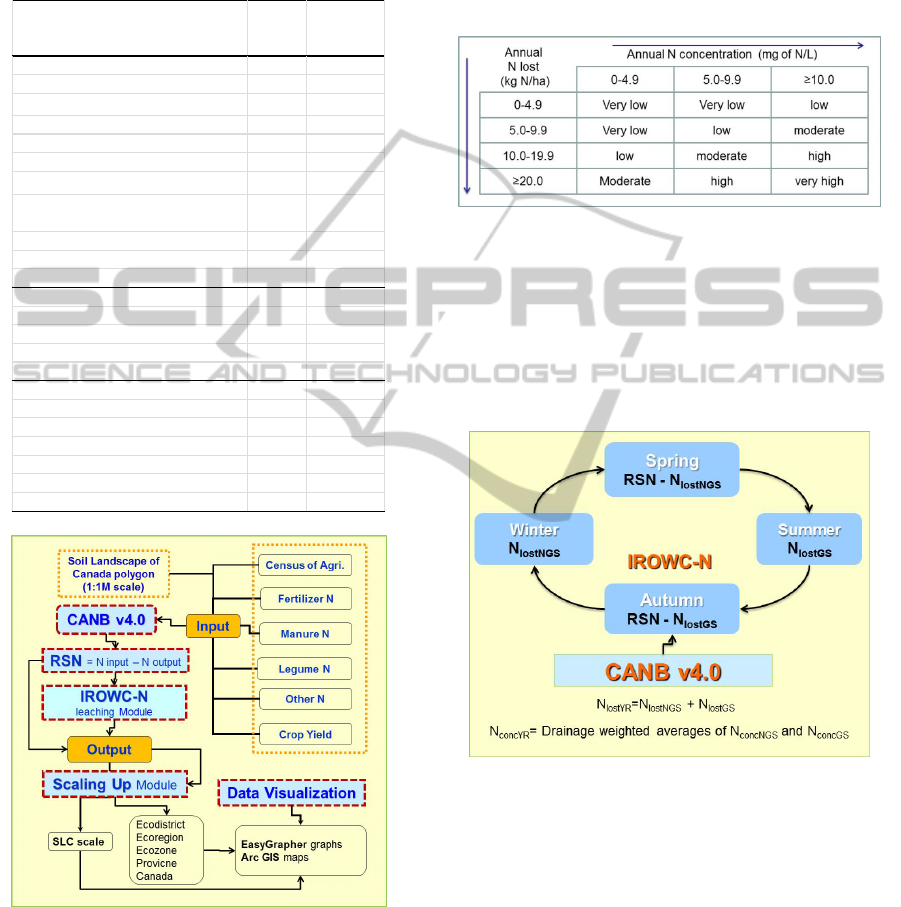
2.3 CANB Model Structure
The CANB v4.0 model’s data are structured into
data folders as illustrated in Figure 3. First the model
reads input data from their files and folders. Then
the CANB calculates the RSN and N lost to leaching
at the SLC polygon level from 1981 to 2011. The
outputs are either saved as text files or scaled-up
from the SLC level to the eco-regional scale (Figure
3). The output data are displayed either graphically
or as data sheets. The required maps for the CANB
output are mapped by the Are GIS software. The
detailed module links and I/O data flow in the
CANB model can be seen from Figure 3.
2.4 RSN Module
Residual Soil Nitrogen (kg N ha
-1
) is calculated as
the difference between the total N input into soil
(N
input
) minus the total N output (N
output
) for each
hectare of farmland (Farmarea) at the end of the
growing season. Detailed descriptions on N input
and N output equations were given in our previous
publications (De Jong et al., 2009; Yang et al.,
2007a, 2010; 2011; 2013) In this paper, for easy
illustration purpose, we present following basic
equations 1-3 as below. For each of the 3247 to 3345
soil polygons from 1981 to 2011, the RSN is
calculated by:
RSN N
input
N
output
/Farmarea
(1)
N
input
N
fert
N
man
N
fix
N
depo
(2)
N
out
p
ut
N
cro
p
N
2
O NH
3
(3)
where all N components in Eqs (2) and (3) are
expressed as kg N SLC
-1
. N
fert
is the total amount of
inorganic N from fertilizer applied; N
man
is the
amount of available inorganic N from manure
applied to crops and pasture after N losses, plus the
amount of N mineralized from the organic manure
that was applied in the previous 3 years; N
fix
is the
amount of N fixed by leguminous crops after
subtracting legume residue N being carried over to
the next year, plus the amount of N mineralized
from legume residue and roots remaining from the
previous 3 years; N
depo
is the amount of wet and dry
deposition of atmospheric N;. N
crop
is the amount of
N removed in the harvested portion of crops and
pasture, N
2
O is the amounts of greenhouse gas lost
to the atmosphere and NH
3
is the amounts of
ammonia N gas lost to the atmosphere.
2.5 IROWC-N Module
The IROWC-N module calculates N lost by leaching
and N concentration in the leached water based on
salt leaching concepts (De Jong et al., 2009). The
IROWC-N module first takes the RSN from the
CANB model as an input. The amount of N leaching
from the soil in the drainage water during the non-
growing season N
lostNGS
and growing season N
lostGS
(kg N ha
-1
) was simulated as shown in Figure 4.
The N concentration in the non-growing season
(N
concNGS
) (mg N L
-1
) and growing season (N
concGS
)
(mg N L
-1
) were then calculated using the
cumulative drainage water volumes in the growing
and non-growing seasons. These were simulated
using a modified daily Versatile Soil Moisture
Budget model (Baier et al., 1979) which was
CANBv4.0:AModelforSimulatingResidualSoilNitrogenandNitrogenLeachinginCanadianRegionalScale
531
integrated into the IROWC-N module using daily
weather datasets across Canadian farmland (De Jong
et al., 2009).
Table 1: List of CANB v4.0 Inputs, output datasets,
variables and numbers of locations from 1981 to 2011.
Figure 3: Flow chart of the Canadian Agricultural
Nitrogen Budget (CANB) v4.0 model.
2.6 RSN and IROWC-N class
For mapping and result interpretation purposes, the
RSN result is grouped into 5 classes; 0-9.9 (very
low), 10-19.9 (low), 20-29.9 (medium), 30-39.9
(high) and ≥40 (very high) in kg N ha
-1
farmland.
The water contamination indicator, IROWC-N, is
classified to 5 risk classes based on combination of
N lost and N concentration (Table 2) (De Jong et al
2007).
Table 2: The IROWC-N classification.
2.7 Scaling up Module
The RSN, N lost (N
lostGS
and N
lostNGS
) and N
concentration (N
concGS
and N
concNGS
) values were
scaled up from the SLC 1:1M scale to the
Ecodistrict, Ecoregion, Ecozone, provincial and
national scales using the farmland area weighted
averages developed as Yang et al. (2007a).
Figure 4: Data flow for N lost and N concentration in the
leached water over the non-growing, growing seasons.
3 DATA VISUALIZATION
3.1 Maps at the Ecoregional Scales
Maps of the CANB outputs are produced using Arc
GIS Map software and can be made at any
ecological scales of SLC, Ecodistrict, Ecoregion and
Ecozone. As examples, the RSN class in 1985 and
2010 and the IROWC-N risk classes for the same
years are mapped in Figure 5 and Figure 6.
CANBI/Odata Variable
No.of
agricultural
polygons
Inputs
Cropareafor27croptypes 27 3247‐3345
Animalnumbersfor21animaltypes 21 3247‐3345
FertilizerNfor27croptypes 27 3247‐3345
ManureNfor27croptypes 27 3247‐3345
Nfixationfor27croptypes 27 3247‐3345
AtmospherewetanddryNdeposition 3 3247‐3345
N
mineralizationfromlegumesand
manure 4 3247‐3345
Cropyieldfor27croptypes 27 3247‐3345
Nuptakefor27croptypes 27 3247‐3345
N2O,N2,NH3‐Nemissions 3 3247‐3345
Outputs
RSNandNcomponents 15 3247‐3345
Nlost(summer,winter&annual) 3 2780
Nconcentrationinleachedwater 3 2780
Drainage(summer,winter&annual) 3 2780
Scaleup
output
SLC(totalof12353) >20 3247‐3345
Eco‐district(totalof1027) >20 377
Eco‐region(totalof194) >20 68
Eco‐zone(totalof15) >20 8
Province >20 10
Canada >20 1
SIMULTECH2014-4thInternationalConferenceonSimulationandModelingMethodologies,Technologiesand
Applications
532
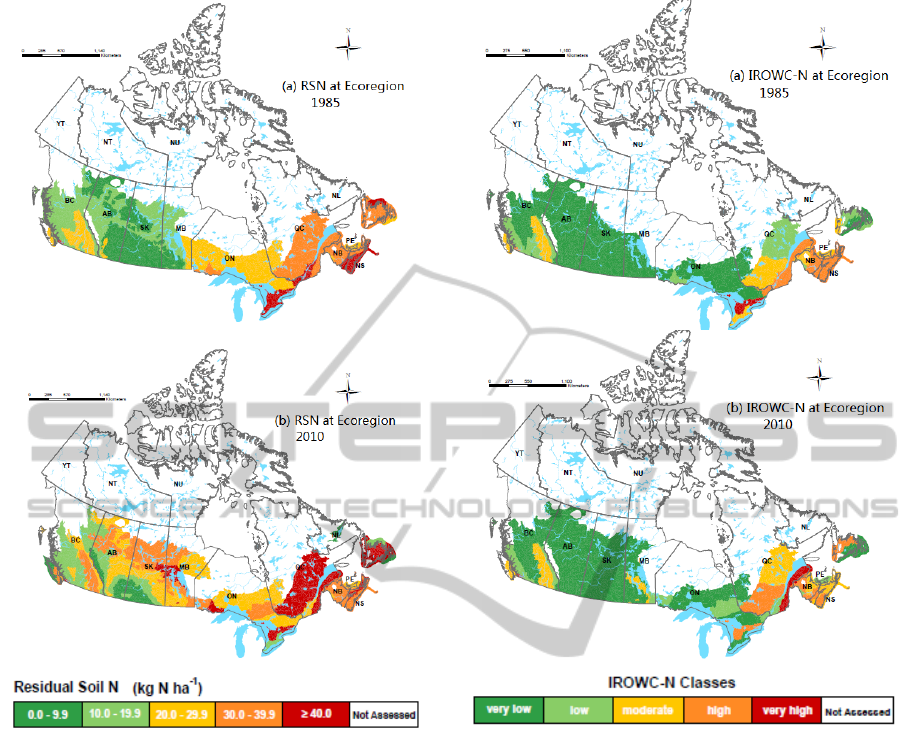
Figure 5: Residual Soil N (RSN) levels on Canadian
Ecoregion in 1985 (a), and 2010 (b).
3.2 Data Handling
The CANBv4.0 input and output files (more than
500) are saved as text files at various scales (Figure
3). To analyze these data efficiently, we have
developed two supporting programs to handle and
visualize the CANB outputs: EasyFormatter and
EasyGrapher, using the MS Visual Basic NET. The
EasyFormatter was designed to transfer the CANB
output files to Microsoft Excel, then save as the
Excel data file. For example, there are 31 files
named 1981RSN.out to 2011RSN.out, dealing with
yearly data for the ~3400 SLC polygons. Each file
has a data matrix of >3000 records and up to 50
variables. The program can transfer these 31 files to
a single MS Excel file with different sheets within
seconds. This way, the data can be viewed and
analyzed with MS Excel and Access easily.
Figure 6: Indicator of Risk of Water Contamination by
Nitrogen (IROWC-N) risk class on Canadian Ecoregion in
1985 (a), and 2010 (b).
3.3 Graph
Similarly, the EasyGrapher software was designed to
automatically graph the CANB’s outputs (Yang et
al., 2014). It first transfers CANB’s output into MS
Excel sheets, and then automatically performs a
series of graphical tasks. The bar graphs are
generated for all output variables within 30 seconds
for each CANB output file. The trend and variation
of each variable (Y axis) against their ecoregions (X
axis) are displayed in the output graphs.
EasyGrapher can plot graphs on CANB output at all
scales listed in Table 1. Examples of graphs at the
Ecoregion are shown in Figures 7-9. Detailed
descriptions on EasyGrapher software can be read
from our previous publications (Yang and Huffman,
2004, Yang et al., 2014))
CANBv4.0:AModelforSimulatingResidualSoilNitrogenandNitrogenLeachinginCanadianRegionalScale
533
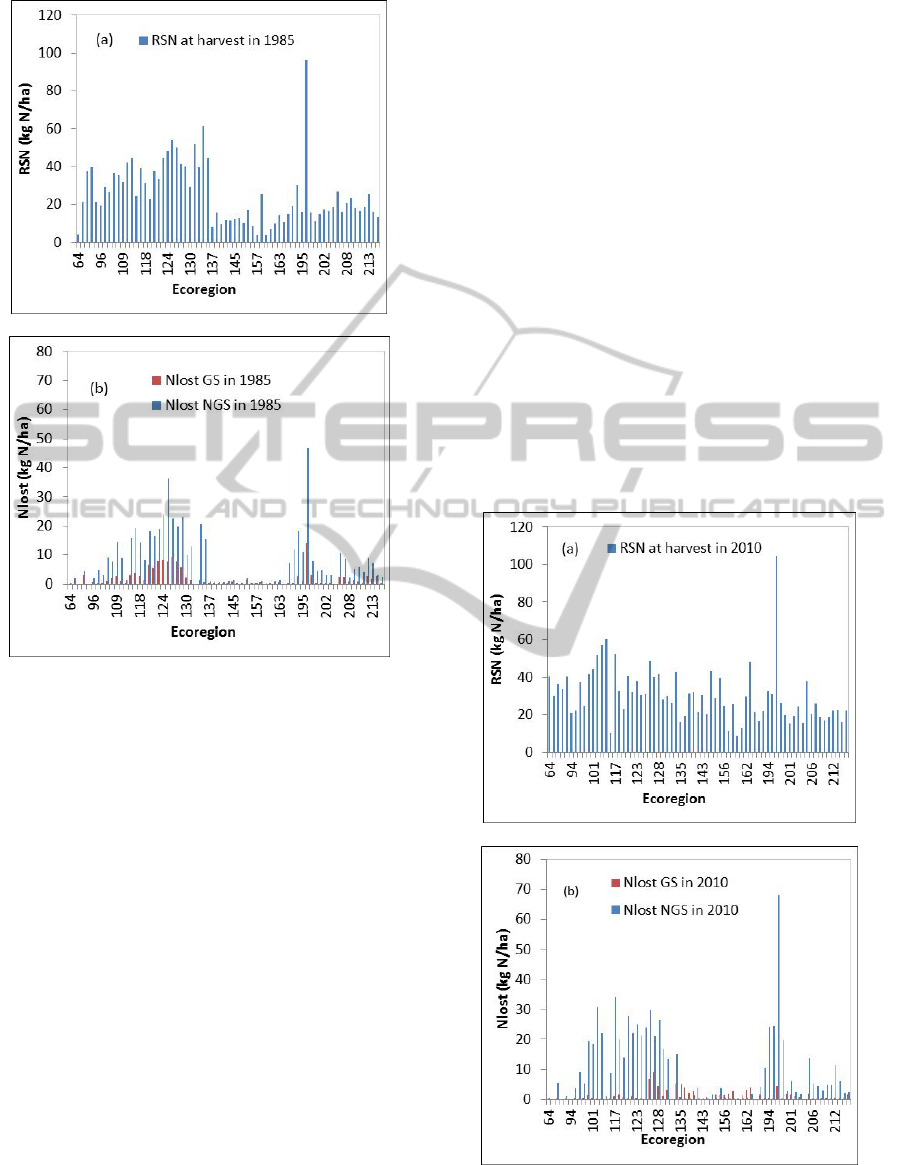
Figure 7: RSN at harvest (a), growing and non-growing
season N lost (b) and drainage (c) at the Canada Ecoregion
in 1985.
4 RESULTS INTERPRETATION
This section is to show how the map and figures are
interpreted but not a completed results and
discussion.
4.1 RSN and IROWC-N Risk Classes
at Ecoregion
The RSN distribution maps at the Ecoregion
(Figures 5) showed significant regional differences
in RSN. In 1985, the RSN level was lower in the
Western provinces (British Columbia, Alberta,
Saskatchewan and Manitoba) but it was high in
Central (Ontario, Quebec) and Eastern Canada
(Figure 5a). It was also observed that RSN risk
classes generally increased from low to high risk
classes over a 25 year time especially in Manitoba,
Ontario, Quebec and Eastern Canada (Figure 5b).
Similar regional differences were found for the
IROWC-N class distribution (Figure 6). The
IROWC-N classes were in the very low and low
classes in Western Canada except a moderate zone
in British Columbia. Most farmland in Central and
Eastern Canada showed moderate, high and very
high IROWC-N classes (Figure 6). In Central and
Eastern Canada, IROWC-N classes were shafted
from low, moderate in 1985 (Figure 6a) to moderate,
high and very high classes in 2010 during a 25 year
period (Figure 6b).
4.2 N Lost at the Ecoregion
In 1985 the RSN values were higher (> 20 kg N ha
-1
)
in Ecoregions 64-135 compared with the RSN
values (<20 kg N ha
-1
) in Ecoregions 137-213,
except in Ecoregion 196 where the RSN was
extremely high (48.5 kg N ha
-1
) (Figure 7a). The N
leaching loss was higher in Ecoregions 109-135 and
180-200 (Figure 7b) because the drainage water was
higher in these regions (data not shown).
Figure 8: RSN at harvest (a) and growing and non-
growing season N lost (b) at the Canada Ecoregion in
2010.
SIMULTECH2014-4thInternationalConferenceonSimulationandModelingMethodologies,Technologiesand
Applications
534
In 2010, the RSN levels were more than 20 kg N
ha
-1
in most of the Ecoregions (Figure 8a) and the N
lost levels increased (Figure 8b) compared with
1985, driven by both higher RSN and higher
drainage levels in 2010 (data not shown). It was
found that N lost in non-growing season was 2-5
times higher than in growing season in both 1985
(Figure 7b) and 2010 (Figure 8b).
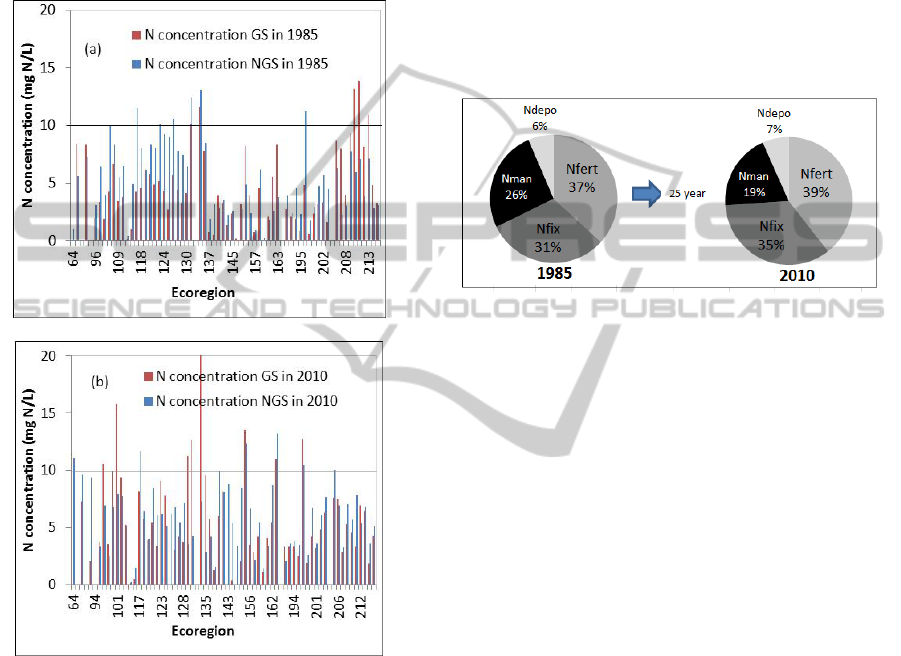
Figure 9: Growing season (GS) and non-growing season
(NGS) N concentration at Ecoregion in 1985 (a) and in
2010 (b).
4.3 N Concentration at the Ecoregion
N concentration increased from 0.5-13.8 mg N L
-1
in
1985 to 0.8-22.4 mg N L
-1
in 2010 at Ecoregion
(Figure 9), showing significant regional difference
among Ecoregions. There was an obvious increasing
trend of the N concentration in most Ecoregions in
2010 compared with 1985. For example, 5-7
Ecoregions in 1985 showed that N concentrations
were above the drinking water guideline of 10 mg N
L
-1
(i.e., horizontal lines in Figure 9a), while 8-10
Ecoregions were shown that N concentration was
greater than 10 mg N L
-1
in 2010 .
4.4 N Input Changes in Canada
N input increased gradually with time, while N
output increased slowly, fluctuating with climate
conditions (Yang et al., 2013). This fluctuation
resulted in the increase of RSN values of 13.4 kg N
ha
-1
from 1985 to 22.3 kg N ha
-1
in 2010.
The quick increase of N input was attributed to
the increased use of N fertilizer and legume N
fixation, while manure N and N deposition were
fairly constant over the last 25 year period (Yang et
al., 2013).
Figure 10: Percentage of fertilizer N (N
fert
), N fixation
(N
fix
), manure N (N
man
) and N deposition (N
depo
) in N
input in 1985 and 2010.
In summary, fertilizer N contributed 37-39% of
total N input, and N fixation accounted for 31-35%.
Manure N (19-26%) and N deposition (6-7%)
contributed small percentages of total N input
compared with fertilizer N and N fixation (Figure
10).
5 CONCLUSSIONS
RSN and the risk of N loss through leaching were
successfully simulated by the Canadian Agricultural
Nitrogen Budget model from 1981 to 2011 for
Canadian farmland at the Soil Landscapes of Canada
1:1 million scale.
Increasing trends of both the RSN and IROWC-
N indicators were significant during a 25 year period
in Canadian farmland as shown by Ecoregion maps.
We concluded that the Ecoregion maps of N
indicators are at a suitable ecological scale for
presenting the results to public users, such as citizen
and students at school and universities because the
detailed SLC map of the RSN and IROWC-N
indicators are designed for specialists, consultant,
researchers and policy makers, and difficult to
interpret. Increases in RSN values were found from
Western to Eastern Canada. In Western region
except BC, the RSN increased from Southern to
CANBv4.0:AModelforSimulatingResidualSoilNitrogenandNitrogenLeachinginCanadianRegionalScale
535

Northern regions.
Graphic display of the RSN and N loss values at
Canada Ecoregion provided quantitative
visualization of which Ecoregions the RSN and N
lost levels were high and we concluded that high N
input resulted in high RSN, and high N lost was
driven by both high N input and high precipitation
and drainage in a given ecoregion. The increased
RSN values were mainly due to the continuous
increase of N input from fertilizer, manure and
biological N fixation compared to moderate
increases in N uptake by crop yields. Farm
management response options should be established
to reduce nitrate N leaching in higher risk regions,
such as reducing livestock numbers, matching
fertilizer N to crop requirements etc.
The principle of the CANB v4.0 program can be
applicable to other regional scales, such as
watershed, forestry, urban areas or other countries
for estimating the amount of surplus N entering into
ecosystem, environment or human food chain.
ACKNOWLEDGEMENTS
We appreciate the funding support provided by
Agriculture and Agri-Food Canada.
REFERENCES
Baier, W., Dyer, J.A., Sharp,W.R., 1979. The Versatile
Soil Moisture Budget. Tech. Bull. No. 87. LRRC,
Research Branch, Agriculture Canada, Ottawa, ON, 52
pp.
Canadian Fertilizer Institute (CFI), 2006. Canadian
fertilizer information system. Available from:
http://www.cfi.ca/industrystats/ June 14 2014.
De Jong, R., Drury, C.F., Yang, J.Y. and C.A. Campbell.
2009. Risk of water contamination by nitrogen in
Canada as estimated by the IROWC-N model. Journal
of Environmental Management 90, 3169-3181.
De Jong, R., Yang, J. Y., Drury, C. F., Huffman, E. C.,
Kirkwood, V. and Yang, X. M. 2007. The indicator of
risk of water contamination by nitrate-nitrogen.
Canadian Journal of Soil Science 87, 179–188.
Drury, C.F., Yang, J.Y., De Jong, R., Yang, X.M.,
Huffman, E., Kirkwood, V. and Reid, K. 2007.
Residual soil nitrogen indicator for Canada. Canadian
Journal of Soil Science 87, 166-177.
Eilers, W, MacKey, R., Graham, L. and Lefebve, A. (eds).
2010. Environmental Sustainability of Canadian
Agriculture: Agri-Environmental Indicator Report
Series - Report # 3. Agriculture and Agri-Food
Canada, Ottawa, Ontario.
Organization for Economic Co-operation and
Development (OECD). 2008. Environmental
performance of Agriculture at a glance. ISBN978-92-
64-04589-7. Paris, France.
Rochette, P., Worth, D. E., Lemke, R. L., McConkey, B.
G., Pennock, D. J., Wagner-Riddle, C. and Desjardins,
R. L. 2008. Estimation of N2O emissions from
agricultural soils in Canada. I. Development of a
country-specific methodology. Canadian Journal of
Soil Science 88, 641654.
Sheppard, S. C., Bittman, S. and Bruulsema, T. W. 2010.
Monthly ammonia emissions from fertilizers in 12
Canadian Ecoregions. Canadian Journal of Soil
Science 90, 113127.
Soil Landscapes of Canada Working Group, 2005. Soil
Landscapes of Canada v3.0: digital map and database
at 1:1 million scale. Agriculture and Agri-Food
Canada, Ottawa, Ontario.
Statistics Canada. 2003. Canadian Socio-economic
Informaiton Management (CANSIM) Table Directory.
Minister of Industry, Ottawa, Ontario.
Yang, J.Y., De Jong, R., Drury, C.F., Huffman, E.C.,
Kirkwood, V. and Yang, X.M. 2007a. Development of
a Canadian Agricultural Nitrogen Budget (CANB
v2.0) model and the evaluation of various policy
scenarios. Canadian Journal of Soil Science 87, 153–
165.
Yang, J.Y., Drury C.F., Yang, X.M., De Jong, R.,
Huffman, E.C., Campbell, C.A., Kirkwood, V., 2010.
Estimating biological N
2
fixation in Canadian
agricultural land using legume yields. Agriculture.
Ecosystems and Environment 137, 192-201.
Yang, J.Y., Drury, C.F., De Jong, R., Huffman, E.C.,
Yang, X.M., Reid, K. 2013. Sensitivity analysis for
nitrogen inputs, nitrogen outputs, and changes in
biofuel crop acreages for predicting residual soil
nitrogen and nitrate leaching in Canadian agricultural
soils. Ecological Modelling, 267: 26-38.
Yang, J.Y., Drury, C.F., Yang, J.M., Li, Z.T.,
Hoogenboom, G. 2014. EasyGrapher: Software for
Data Visualization and Statistical Evaluation of
DSSAT Cropping System Model and the CANB
Model. International Journal of Computer Theory and
Engineering, Vol 6, No. 3.
Yang, J.Y., Huffman, E.C., De Jong, R., Kirkwood, V.,
MacDonald, K.B. and Drury, C.F. 2007b. Residual
soil nitrogen in soil landscapes of Canada as affected
by land use practices and agricultural policy scenarios.
Land Use Policy 24, 89–99.
Yang, J.Y., Huffman, E.C., Drury C.F., Yang, X.M., De
Jong, R. 2011. Estimating the impact of manure
nitrogen losses on total nitrogen application on
agricultural land in Canada. Canadian Journal of Soil
Science 91, 107-122.
Yang, J. Y. and Huffman, E. C. 2004. EasyGrapher:
Software for Graphical and Statistical Validation of
DSSAT Outputs. Computers and Electronics in
Agriculture, 45, pp 125-132.
SIMULTECH2014-4thInternationalConferenceonSimulationandModelingMethodologies,Technologiesand
Applications
536
