
Optimization of Adaptive Up-and-Down Method for Equivalent Time
Signal Conversion
K. Kruminsh and V. Plocinsh
Institute of Electronics and Computer Science, Dzerbenes Str. 14, Riga, Latvia
Keywords: Equivalent Time Conversion, UWB Radar, Adaptive Methods, Up-and-Down Method.
Abstract: This study relates to comparator type equivalent time signal conversion. The influence of parameters of
combined adaptive up-and-down method on accuracy of signal conversion is studied. Optimal values of
parameters are obtained, using which the minimal amount of the samples is ensured. As an input signal, a
model of UWB radar signal (sine monocycle) is used. Method is intended for application in UWB radar
receivers. The design guidelines for application of the method in UWB radar receivers are outlined.
1 INTRODUCTION
Two types of equivalent time converters are known,
namely, gate type converters (Kahrs, M., 2003) and
comparator type converters (Херманис, Э. Х.,
Карклиньш, В. Г., 1977), (Bergman, D. I., 2006.),
(Askerzade, I. N., 2006). This article refers to the
comparator type equivalent time converters. In such
converters, the measurement of the instantaneous
value of the signal is achieved through comparisons
with a known threshold. The threshold is changed
according to chosen procedure until the signal is
measured with sufficient precision. One of the most
efficient comparator type methods is the combined
adaptive up-and-down method, named as
α - k -up-
and-down method (Krumin’sh, K. and Plotsin’sh,
V., 2013). The aim of this study is to optimize the
parameters
r
, nn /
1
and v of this method. The
study uses an example of designing UWB radar
receiver.
The simplest of comparator type signal
conversion method is up-and-down method
(Krūmiņš, K. and Kārkliņš, V., 2005). According to
this method, the measurement of the signal proceeds
as follows. In a specified phase
i
t=t signal
i
U
1,
is
compared with the noisy threshold
e of comparator.
Therefore, we can assume that the signal
i
U
1,
is
masked with an additive noise
X
(variance
2
1
=DX and mean value 0=EX ):
X+U=u
i,i 11,
.
(1)
The threshold is adjusted according to expression:
ji,iji,+ji,
eUsigns+e=e
1,1
,
(2)
where
s
is the step of the method.
After a sufficiently large number
n of
comparisons, the last value of threshold is used as a
measurement result:
ni,i
e=u
2,
.
(3)
Afterwards the phase is shifted to the next point,
and the value of signal in that phase is measured.
The initial value of threshold in next phase point
remains the last threshold in previous phase point:
ni,,i
ee
11
.
(4)
According to the combined method the
measurement of instantaneous value of signal
proceeds as follows. Total number
n of
comparisons is divided in two parts
n=n+n
21
. In
the first part the threshold is changed according to
up-and-down procedure (2) with step
0
s=s . After
1
n comparisons the number
+
n
1
of threshold
exceedances is counted. Afterward the value of step
i
s=s is calculated according to expression
v+
n
n
ks=s
r
+
i
1
1
1
0
,
(5)
597
Kruminsh K. and Plocinsh V..
Optimization of Adaptive Up-and-Down Method for Equivalent Time Signal Conversion.
DOI: 10.5220/0005010205970603
In Proceedings of the 11th International Conference on Informatics in Control, Automation and Robotics (ICINCO-2014), pages 597-603
ISBN: 978-989-758-039-0
Copyright
c
2014 SCITEPRESS (Science and Technology Publications, Lda.)

where:
k - coefficient of adaptation,
r
and v - parameters
of method.
In the second part of measurement the up-and-
down procedure proceeds according to (2) with the
step (5). The result of measurement, similarly to the
up-and-down method, is the last value of threshold
ni,i
e=u
2,
. However, the initial value of the
threshold in the next point is set to
12,2,1,1
iini,+i
uuα+e=e ,
(6)
where
α - coefficient of adaptation.
The optimization of parameters of the combined
method occurred at the specified noise suppression
and accuracy of signal measurement. As an input
signal, a model of UWB radar signal was used.
There are known several models of UWB radar
signals (Chen, X. and Kiaei, S., 2002). We used a
sine monocycle
i
n
A=u
T
i
2π
sin
11,
,
(7)
where:
1
A - amplitude of the signal;
T
n - the
number of phase points per monocycle period.
Let's introduce following notations:
*
A
- the maximum amplitude of the undistorted
signal transformation;
1
1
=
- the normalized standard deviation of the
masking noise at the converter’s input;
2
- the standard deviation of the noise at the
converter’s output;
*
2
- the maximum allowed standard deviation of
the noise at the converter’s output;
f
- the coefficient showing the distortion of the
signal’s shape:
1
12
A
)ustd(u
=
f
;
(8)
c - the maximum allowed value of the distortion
coefficient of the signal’s shape for
T
n points of the
signal;
T
nN 2 - the sweep length (the sine monocycle is
located at the centre of the sweep) used for the
determination of
f
;
2
1
cc - the maximum allowed value of the
distortion coefficient of the signal’s shape within the
sweep range of
T
n2 ;
11
c
f
- criterion of signal conversion quality for
amplitude
1
1
A within the sweep range of
T
n2 ;
and
12
c
f
- criterion of signal conversion quality for
amplitude
*
1
AA within the sweep range of
T
n2 .
The distortion coefficients of the signal’s shape
1f
and
2f
σ are calculated within the sweep
range of
T
n2 , because signal distortions may spread
beyond the sine-wave period when adaptive methods
are used.
The optimization of parameters was based on
example of converter outlined in (Krumin’sh, K. and
Plotsin’sh, V., 2013):
V127
1
= ; V
15
*
2
;
mVA 25
*
; 0.7=
; 05.0c ; 0353.0
1
c ;
50
T
n . By reducing the values of
1
,
*
2
and
*
A
to relative values, we obtain
1
1
=
, 055.0
*
2
and
93
*
A .
Optimization of the parameters was carried out at
210=n because several tests showed that this value
might be close to the minimum of required number
of comparisons. As initial values of
r
, nn /
1
and v
values
6=r , 0.5/
1
=nn and 1=v were used. At
each selected pair of initial values of the parameters,
the influence of the third parameter was studied.
Research was conducted by statistical modeling.
2 THE RESEARCH OF
INFLUENCE OF PARAMETER
r
ON THE ACCURACY OF
SIGNAL CONVERSION
The following values of parameter
r
were used:
100.010.0;9.5;...1.5;1.0; ,=r . The values of step
ks
0
, which fulfill the condition
*
2
*
22
0.995;0.985
, were found at each
selected
r
. The obtained results are shown at Figure
1.
ICINCO2014-11thInternationalConferenceonInformaticsinControl,AutomationandRobotics
598

Figure 1: The values of step
0
s
k for fulfilling the
condition
*
2
*
22
0.995;0.985
at different values of
r
. The corresponding dependencies are shown from
1.0=r (bottom) to 100=r (top).
As seen in Figure 1, the value of step decreases
by increasing
k , however, beginning with 5r we
can assume that the value of step does not depend on
parameters
k and
r
. This property is beneficial to
use in practical implementation of
α - k -up-and-
down method.
The dependencies of coefficients
k
f 1
and
k
f 2
of signal distortions were investigated
within the same range of
r
. For calculating
k
f 1
and
k
f 2
the previously obtained values
0
s were
used. The acquired
k
f 1
and
k
f 2
are depicted
correspondingly in Figure 2 and Figure 3.
Figure 2: The dependence
1f
k
at different values of
r
. The corresponding dependencies are shown from
1.0=r (top) to 100=r (bottom).
As seen in Figure 2, the coefficient
k
f 1
of
distortion of small signal increases by increasing
k ,
however, beginning with
4
r
we can assume that
the value of
k
f 1
does not depend on parameters
k and
r
. This is another beneficial property to use
in practical implementation of
α - k -up-and-down
method.
Figure 3: The dependence of coefficient
1f
k
of signal
distortions at several values of
r
: 1.0=r – curve 1;
1.5=r – curve 2 and 1002.0 ÷=r – curve 3.
It was obtained that, beginning with 2
r
, the
dependencies
k
f 2
practically do not differ and
therefore in Figure 3 are depicted as one curve.
Besides, the fulfilling of conditions 1.5>r and
30>k makes the coefficient
2f
independent of
k , and, moreover, less than 0.008 . Therefore, the
condition
0.0353
2
<
f
is satisfied by a large
margin.
From the above it follows that in the practical
implementation of the method one should use the
values
5r of the parameter
r
. In addition, this
study showed that the requirements
0.0353
1
<
f
and
*
2
*
22
0.995;0.985
by adjusting the
coefficient
r
cannot be satisfied at 210=n .
3 THE RESEARCH OF
INFLUENCE OF THE RATIO
nn /
1
ON THE ACCURACY OF
SIGNAL CONVERSION
The following values of the ratio nn /
1
were used:
0.95;0.90.8;...0.2;0.1;0.05;/
1
,=nn
. The values of
step
ks
0
, which fulfill the condition
*
2
*
22
0.995;0.985
, and corresponding
k
f 1
and
k
f 2
were found at each selected
nn /
1
. Obtained results are shown accordingly in
Figure 4, Figure 5 and Figure 6.
OptimizationofAdaptiveUp-and-DownMethodforEquivalentTimeSignalConversion
599
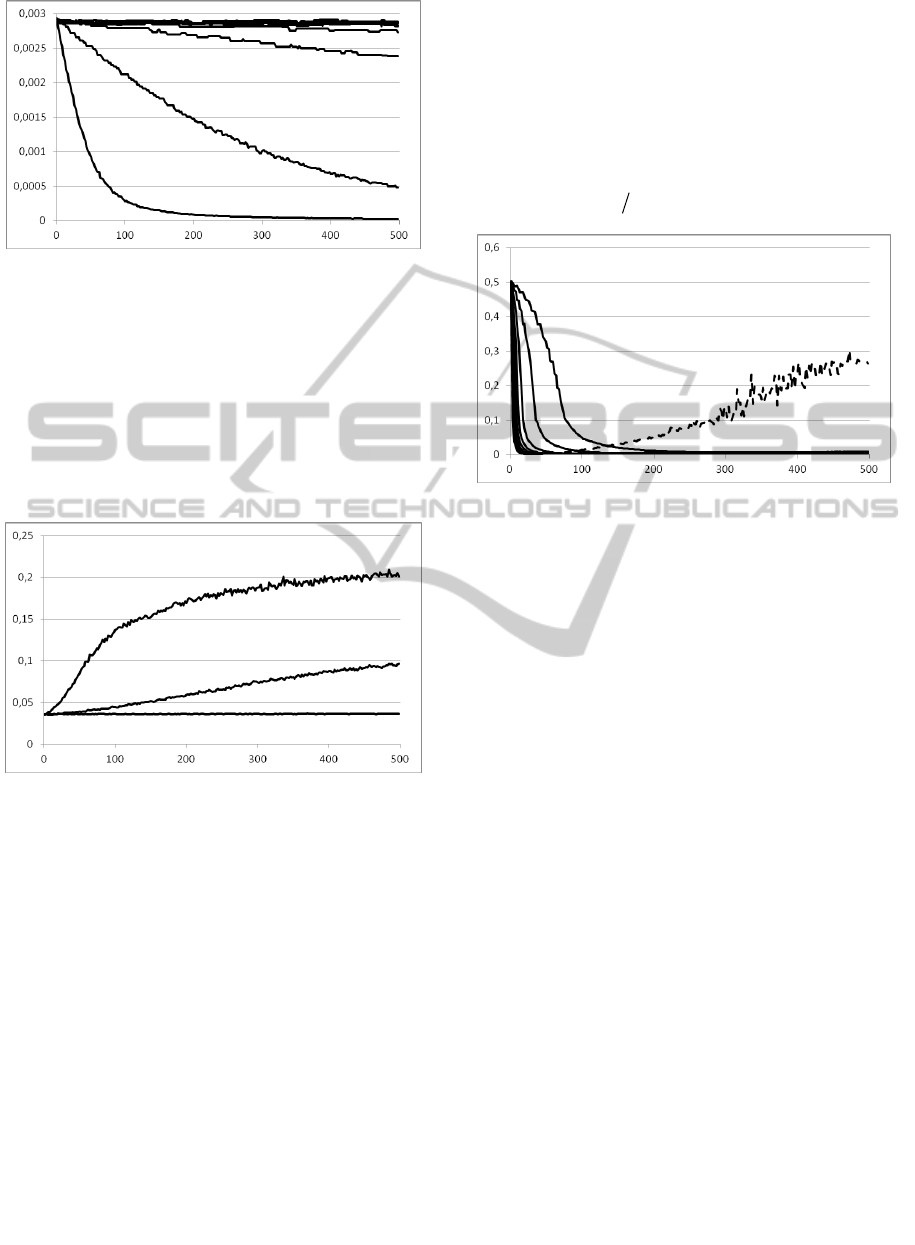
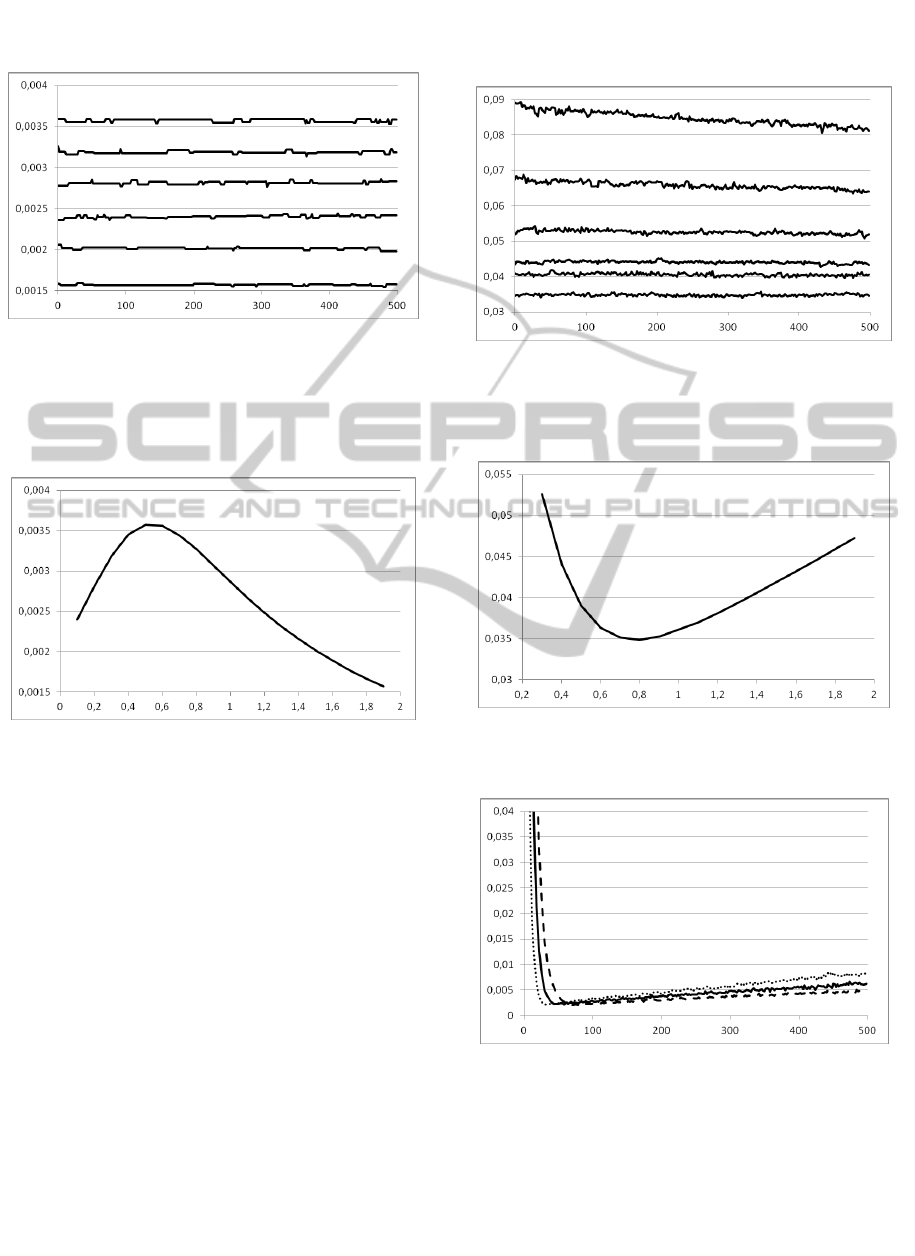
Figure 4: The values of step
0
s
k for fulfilling the
condition
**
222
0.985 ; 0.995
at different values of
nn /
1
. The corresponding dependencies are shown from
0.05/
1
=nn (bottom) to 0.95/
1
=nn (top).
As seen in Figure 4, condition 0.3/
1
nn
implicates the independence of step
0
s from
parameters
k and nn /
1
.
Figure 5: The dependence of coefficient
1f
k
of signal
distortions at several values of
nn /
1
0:
0.05/
1
=nn (top); 0.1/
1
=nn (middle) and
0.95/0.2
1
nn (bottom).
It was obtained that condition 0.95/0.2
1
nn
makes the dependencies
k
f 1
practically
undistinguishable, therefore those dependencies in
Figure 5 are depicted as one curve. Besides, the
condition
0.95/0.2
1
nn implicates that
1f
is
independent from parameter
k . Usage of
0.2/
1
<nn increases the coefficient
1f
of
distortions and the accuracy of signal conversion
worsens.
As seen in Figure 6, it's not beneficial to use the
values 0.1/
1
<nn because in this case the range of
allowable values of parameter
k narrows. Also it is
inadvisable to use the values
0.7/
1
>nn because in
this case the required value of
1f
is ensured at
large values of parameter
k . The studies have
shown that increase of parameter
k makes the
output noise spikier. Summarizing above-mentioned
(see Figure 4, Figure 5 and Figure 6), one can use
the values
0.70.3
1
nn .
Figure 6: The dependence of coefficient
2f
k
of signal
distortions at several values of
nn /
1
: 0.95/
1
=nn ;
0.8/
1
=nn ...; 0.1/
1
=nn (respectively, from right to
left) and
0.05/
1
=nn (dashed curve).
In addition, this study showed that the
requirements
0.0353
1
<
f
and
*
2
*
22
0.995;0.985
by adjusting the coefficient
nn /
1
cannot be satisfied at 210=n .
3 THE RESEARCH OF
INFLUENCE OF THE
PARAMETER
v ON THE
ACCURACY OF SIGNAL
CONVERSION
The following values of the parameter v were used:
1.9;1.8...0.3;0.2;;0.1 ,=v . The values of step
ks
0
, which fulfill the condition
*
2
*
22
0.995;0.985
, and corresponding
k
f 1
and
k
f 2
were found at each selected v .
Obtained results are shown accordingly in Figure 7,
Figure 9 and Figure 11.
As seen in Figure 7, the values of step
0
s do not
depend on
k . Using this property, the values of
ICINCO2014-11thInternationalConferenceonInformaticsinControl,AutomationandRobotics
600
dependence
vs
0
were obtained by averaging
ks
0
at each
v (see Figure 8).
Figure 7: The values of step
0
s
k for fulfilling the
condition
**
222
0.985 ; 0.995
at different values of
v : 1.5;0.10.2;;0.3;0.5=v and 1.9 (corresponding
dependencies are shown from top to bottom).
Figure 8: The dependence of step
vs
0
for fulfilling the
condition
**
222
0.985 ; 0.995
.
Using the obtained
vs
0
and corresponding v ,
the dependence
k
f 1
was studied. As seen in
Figure 9, the condition
0.3v implicates
independence of
1f
from parameter k . Using this
property, the dependence
v
f 1
was studied at
0.3v (see Figure 10).
As seen in Figure 10, the dependence
vσ
f 1
has
the optimum
0.8=v
opt
, at which
0.035
1
=v
optf
.
Consequently, the requirement
11
c
f
is fulfilled.
However, since the value of
optf
v
1
differs only
slightly from the criterion
0.0353
1
=c , we can
assume that
210=n is the minimal number of
comparisons for fulfilling criteria
0.0353
1
f
σ
and
*
2
*
22
0.9950.985
; .
Figure 9: The dependence
kσ
f 1
at different values of
v : 4.1;4.0;3.0;2.00.1;=v and 0.8 (corresponding
dependencies are shown from top to bottom).
Figure 10: The dependence of coefficient
vσ
f 1
of signal
distortion.
Figure 11: The dependence of signal distortion
2f
k
at
different values of
v : 0.1=v (continuous line);
0.5=v (dotted line) and 1.9=v (dashed line).
The study of dependence
k
f 2
was carried out
in the same range of parameter
v :
1.9;1.8...;0.3;0.2;0.1;=v . It was obtained that in
OptimizationofAdaptiveUp-and-DownMethodforEquivalentTimeSignalConversion
601

the beginning of the range of parameter k the values
of dependence
k
f 2
decreases very rapidly from
0.50
2
f
to
0.004
2
<
f
. Thereafter
dependence
k
f 2
slowly increases (see Figure
11). Besides it was obtained that the condition
0.0353
2
f
is fulfilled for all values of 30>k
regardless of
v . However, in order to minimize
2f
, it is recommended to use 70k . Still, as was
mentioned before, one should not choose too big
values of parameter k .
Summarizing all these studies of optimization of
parameters
r
, nn /
1
and v yields that the minimal
number of comparisons for fulfilling the
requirements
*
2
*
22
0.9950.985
; ,
11
c
f
and
12
c
f
is 210=n . The parameters at which
this number is obtained, are:
6=r , 0.5/
1
=nn ,
0.8=v , 70=k , 0.7=α and
10
0.00325
=s .
It should be mentioned that the usage of up-and-
down method in our example requires the minimal
number of comparisons
2076=n . That means that
the application of this adaptive method provides
almost 10-fold increase of speed of signal
conversion, In order to show the efficiency of the
combined method versus up-and-down method, the
results of converting of sine monocycle with
amplitude of
93
*
A at the same number of
comparisons
210=n are seen in Figure 12.
Figure 12: The result of sine monocycle conversion with
combined method (continuous line) and
up-and-down
method (dashed line) at
210=n .
The result of signal conversion with up-and-
down method (dashed line) is distorted beyond
recognition while the result of conversion with
combined method coincides with the input signal.
In designing of a similar converter it is
advantageous to use the above-mentioned values of
parameters:
0.7/0.3
1
nn , 5r , 0.8=v ,
0.7=α and 30k . The search of parameters
0
s ,
n and k should be carried out through computer
simulation. Let's assume that the reduced noise
suppression of the designed converter is
**
2
. The
modeling of signal conversion should begin with a
choice of
n . As an initial choice of n , one can use a
following empirical formula:
2
**
21
6525.0
n .
(9)
Using chosen
n , one should find the value of
step
0
s fulfilling the required sensitivity
**
2
. As an
approximate initial value of
0
s one can use the
following expression (Kruminsh, K., Plotsinsh, V.,
2012):
1
2
**
2
2
10
1.2541.5625
+=s .
(10)
The sensitivity requirement
**
2
**
22
0.9950.985
; is tested at the chosen
values of
0
s and n . If
**
22
0.995
, then the
value of step should be decreased. Conversely, the
value of step should be increased if
**
22
0.985
.
By applying such procedure, the value of step
0
s ,
which fulfills the requirement for necessary
sensitivity, is obtained. Afterwards the criterion
0353.0
1
=
f
is tested. If
0353.0
1
>
f
, then the
number
n should be increased and the procedure of
finding the value of step
0
s , as well as the testing of
criterion
0353.0
1
=
f
should be repeated. If
0353.0
1
f
, then the number n should be
decreased and the procedure of finding the value of
step
0
s , as well as the testing of criterion
0353.0
1
=
f
should be repeated. In such way the
values of
0
s and n are obtained. In order to find the
value of parameter
k , the criterion
0,01
2
f
will
be used. The testing of this criterion should begin
with value of
30
k . The value of k is increased
until the criterion
0,01
2
f
is fulfilled. Obtained
in such way values of
0
s , n and k are optimal for
fulfilling the required sensitivity and quality of
signal conversion.
Remark: A more strict condition
0.01
2
f
is
used instead of
0353.0
2
f
because dependence
ICINCO2014-11thInternationalConferenceonInformaticsinControl,AutomationandRobotics
602

k
f 2
is rather steep, and condition
0353.0
2
f
is fulfilled easily.
4 CONCLUSIONS
1. In implementation of the combined method one
should use the following values of the parameters:
0.7/0.3
1
nn , 5r and 0.8=v .
2. The conducted research showed that the value of
parameter
k can be changed within wide range
beginning with approximately
30k .
3. With equal accuracy and sensitivity requirements
for signal conversion the combined adaptive method
provides a nearly 10-fold increase in performance
than the up-and-down method.
4. Significant efficiency of adaptive method,
illustrated by computer simulations, indicates
advisability of analytical studies of this method.
ACKNOWLEDGEMENTS
This research was funded by projects of Latvian
State research program “Innovative signal
processing technologies for smart and effective
electronic system development” and “Next
generation ICT cities”.
REFERENCES
Askerzade, I. N., 2006. Josephson-effect samplers: A
review.
Technical Physics, Vol. 51, No. 4, pp 393-400.
Bergman, D. I., 2006. An Accurate Pulse Measurement
System for Real-Time Oscilloscope Calibration. The
Journal of Measurement Science.
Vol. 1, No. 3, pp.
22-29.
Chen, X. and Kiaei, S., 2002. Monocycle shapes for ultra
wideband system
. IEEE Int. Symp. on Circuits and
Systems (ISCAS)
. Vol. 1, pp. 597—600.
Kahrs, M., 2003. 50 Years of RF and Microwave
Sampling.
IEEE Transactions on Microwave Theory
and Techniques
, Vol. 51, No. 6, pp. 1787-1805.
Krūmiņš, K. and Kārkliņš, V., 2005. The Method “Up-
and-Down” Modifications at the Mode of Detection
Low Signals for Superwideband Radars.
Automatic
Control and Computer Sciences.
Vol. 39, No. 4, pp.
70–77.
Kruminsh, K., Plotsinsh, V., 2012. Adaptive k-up-and-
down method for comparator type equivalent time
conversion of UWB radar signals. Automatic Control
and Computer Sciences
. Vol. 46, No. 6, pp. 280-287.
Krumin’sh, K. and Plotsin’sh, V., 2013. Combined
Adaptive Up and Down Method for Equivalent Time
Signal Transformation.
Automatic Control and
Computer Sciences
. Vol. 47, No. 5, pp. 283–288.
Херманис, Э. Х., Карклиньш, В. Г., 1977.
Дискретные
стробоскопические преобразователи
. Зинатне,
Рига.
OptimizationofAdaptiveUp-and-DownMethodforEquivalentTimeSignalConversion
603
