
Simulation of HDS Tests in Trickle-Bed Reactor
V. Tukač
1
, A. Prokešová
1
, J. Hanika
1
, M. Zbuzek
2
and R. Černý
2
1
Institute of Chemical Technology, Prague, Technická 5, CZ-16628 Prague, Czech Rebublic
2
Research and education centre UniCRE Litvínov, CZ-43670 Litvínov, Czech Rebublic
Keywords: Hydrodesulfurization Simulation, Catalyst Tests, Trickle-Bed Reactor.
Abstract: The paper deals with methodology of simulation study devoted to evaluation of reliability of HDS catalyst
testing procedure in pilot three phase fixed bed reactor. Hydrodynamic behaviour of test reactor was
determined by residence time distribution method. Residence time and Peclet number of axial dispersion of
liquid phase were obtained by nonlinear regression of experimental data. Hydrodesulfurization reaction
kinetics was evaluated by analysis of concentration data measured in high pressure trickle-bed reactor and
autoclave. Simulation of reaction courses were carried out both by pseudohomogeneous model of ODE in
Matlab and heterogeneous reactor model of PDE solved by COMSOL Multiphysics. Final results confirm
presumption of eliminating influence of hydrodynamics on reaction kinetic results by dilution of catalyst
bed by inert fine particles.
1 INTRODUCTION
Sustainable development demands ultra-low
concentrations of sulfur and nitrogen compounds in
produced engine fuels – gasoline and diesel. Present
sulfur content valid in EU 10 ppm represents less
than one thousands of sulfur content of original
crude oil. Deep hydrodesulfurization (HDS) of
engine fuels is dominantly carried out in catalytic
trickle-bed reactors. Also testing of catalysts
affectivity and life cycle needs expensive long time
experimentation in pilot scale reactors to evaluate
catalyst decay and activity loses. Pilot trickle-bed
reactor for catalyst tests needs to produce reliable
results not affected by mass and heat resistance. To
avoid occurrence of temperature gradients, poor
catalyst wetting and fluid maldistribution a dilution
of bed of industry scale catalyst particles by fine
inert grains is used (Bej et al., 2001). In
contradiction to full scale reactors this dilution
changes interfacial area in the bed and affects
namely external mass transfer of hydrogen (Tukač et
al., 2007). Also hydrodynamics, pressure drop, gas
and liquid holdups and fluid axial dispersion seems
to be quite different (Mary et al., 2009).
The goal of this study was to compare
experimental HDS catalyst activity measurement
carried out in pilot scale trickle-bed reactor with
result of computational model. Catalyst activity tests
were supplemented by kinetic measurement of
reaction rate constants and activation energies of
selected sulfuric compounds. Parallel to HDS
reaction also hydrodenitrogenation (HDN) takes
place in the catalytic reactor. Hydrodynamic data
were evaluated by residence time distribution (RTD)
method in laboratory glass model of pilot reactor.
Mathematical models of the process (Ancheyta,
2011) were formulated both like 1D
pseudohomogeneous and 3D heterogeneous ones.
The aim of this work was generally to evaluate
extent of dilution influence on operation of pilot test
reactor and to forecast interaction between intrinsic
reaction kinetic, hydrodynamic parameters and mass
transfer.
2 EXPERIMENTAL
Pilot catalyst activity tests were carried out in high
pressure trickle-bed reactor of 30 mm I.D and 887
mm length. In the axis of the reactor 9 mm O.D.
temperature probe was located. Reactor bed consists
of three section of different porosity, from the top to
the bottom: 765 mm calming section of 1-2 mm
grain inert, which was followed by two section (110
and 172 mm) of commercial catalyst diluted by
different amount (2:1 and 1:1, resp.) of inert.
Catalyst particles were in form of trilobe alumina
739
Tuka
ˇ
c V., Prokešová A., Hanika J., Zbuzek M. and
ˇ
Cerný R..
Simulation of HDS Tests in Trickle-Bed Reactor.
DOI: 10.5220/0005090807390744
In Proceedings of the 4th International Conference on Simulation and Modeling Methodologies, Technologies and Applications (SIMULTECH-2014),
pages 739-744
ISBN: 978-989-758-038-3
Copyright
c
2014 SCITEPRESS (Science and Technology Publications, Lda.)
extrudes of 1.3 mm O.D. and 6 mm mean length and
silicon carbide of grain diameter 0.1 - 0.2 mm was
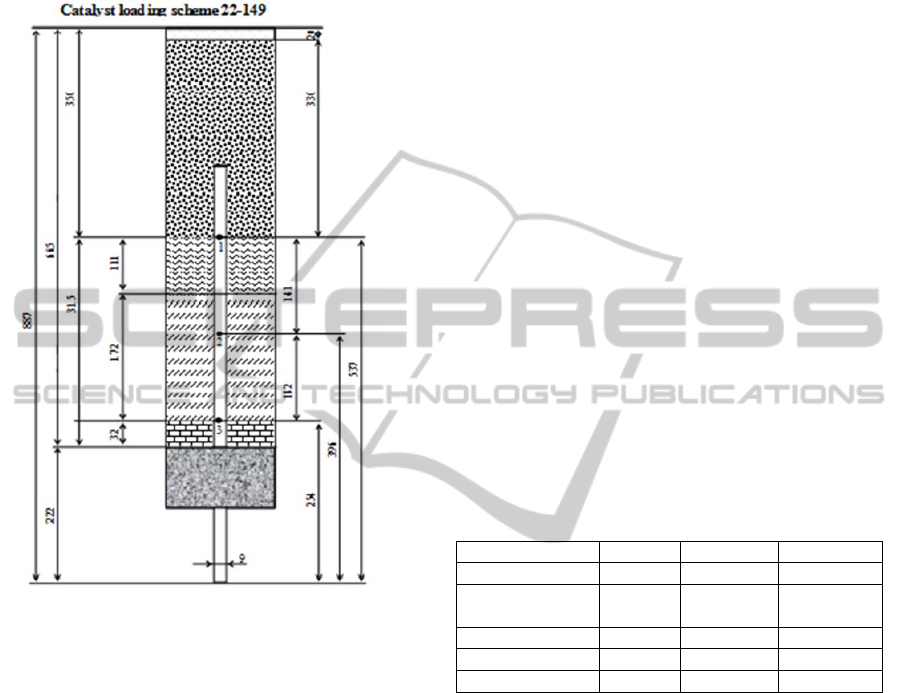
used as inert diluent. Scheme of pilot reactor is
presented in Figure 1.
Figure 1: Scheme of pilot trickle-bed reactor with packing
layers from top to bottom: silica wool, coarse SiC, diluted
catalyst by fine SiC 1:2, diluted catalyst by fine SiC 1:1,
coarse SiC, silica wool.
Middle distillates, petroleum fractions for diesel
fuel – atmospheric gas oil (AGO) and light cycle oil
(LCO) were chosen for catalyst activity tests, their
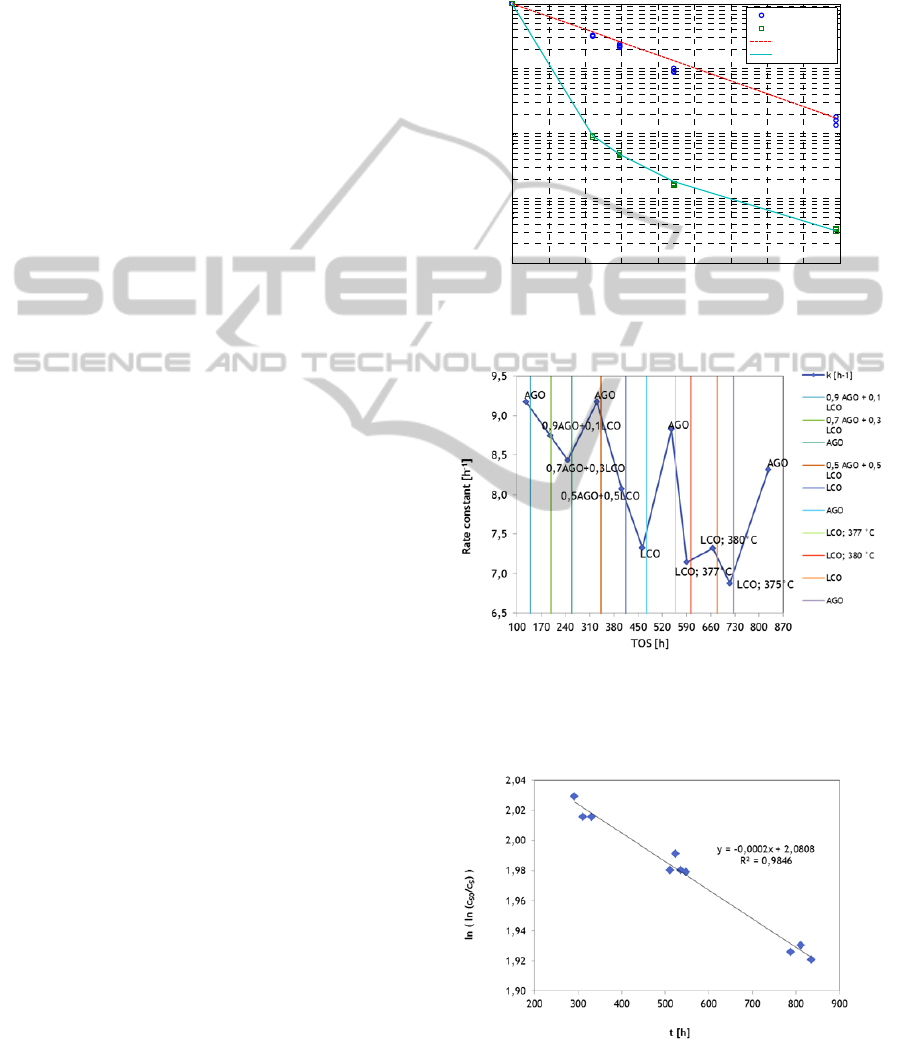
main properties are presented in Table 1. Results of
hydrodesulfurization tests carried out with these oils
were available to evaluate kinetic parameters,
example see in Figure 2.
Kinetic experiments with chosen typical sulfuric
substances were carried out in 500 mL stainessteel
autoclave equipped by catalyst basket to test activity
of industrial shaped hydrodesulfurization catalysts.
Both different temperature and hydrogen partial
pressure were applied to evaluate kinetic parameters
- rate constant and activation energy.
Chemical analysis of content of sulfuric
compounds in raw liquid feed and product was made
by ASTM standard methods.
Laboratory hydrodynamics test column having
identical geometry with pilot reactor consist of glass
tube, equipped by three conductivity electrodes with
axially located joint ground, which was represented
by temperature probe located in axis of tube.
Residence time distribution (RTD) method and
piston-dispersion (PD) hydrodynamic model were
used. Signal responses to impulse injection of
concentrated aqueous solution of potassium chloride
were measured by three conduct-meters connected
with fast multichannel data acquisition system. Air
(7.10
-4
– 42.10
-4
kg m
-2
s
-1
) and water (0.02 – 0.12 kg
m
-2
s
-1
) feed rate was controlled by mass flow meters
on the same values of mass superficial velocities as
in the case when diesel fuel and hydrogen were
applied. Hydrodynamic parameters (residence time,
liquid holdup and Peclet number of axial dispersion)
were obtained both by moment method of response
curves and nonlinear fitting by numerical simplex
method.
Typical properties of raw feed liquid are
presented in Table 1. While, AGO exhibits two
times greater sulfur content compared to LCO, the
last one contains much greater concentration of
nitrogen compounds responsible for transient
catalyst deactivation.
Table 1: Properties of middle distillates.
Feedstock AGO LCO
Density, 15 °C kg/m
3
857.1 968.6
Refractive index,
20 °C
1.4763 1.563
Color 0.9 2.8
Sulfur content mg/kg 12900 6346
Nitrogen content mg/kg 201 750
3 PROCESS SIMULATION
Evaluation of experimental data and process
simulation are divided to several sections: i)
evaluation of kinetic parameters of chemical
reactions by nonlinear simplex method, ii) linear
regression of catalyst deactivation kinetics, iii)
fitting of RTD data to find parameters of PD
hydrodynamic model, and finally, iv) formulation of
heterogeneous reactor model.
3.1 Reaction Kinetics
In the porous bed, a reaction takes place (Bellos and
Papayannakos, 2003) that consumes species A and B
and produces C and D, where A, B, C, D represent
hydrogen, dibenzothiophene, sulphane, and
SIMULTECH2014-4thInternationalConferenceonSimulationandModelingMethodologies,Technologiesand
Applications
740

biphenyle, respectively in case of sulfur compounds
and hydrogen, carbazole, ammonia and biphenyle
for nitrogen compounds.
2A + B C + D (1)
R
i
the reaction rate for species i (mol/(m
3
s)).
Because the reaction takes place in the porous
catalytic bed only, the reaction term is zero in the
free-flow regions. The reaction rates are given by
R
A
= -2 k p
A
c
B
n
(2)
R
B
= R
A
/2 (3)
R
C
= -R
B
(4)
R
D
= -R
B
(5)
where k is the reaction rate constant, p
A
partial
pressure of hydrogen and c molar concentration.
3.2 Pseudohomogeneous Reactors
Psudohomogeneous plug flow 1D model in Matlab
was used to evaluate kinetic parameters of HDS and
HDN from the pilot tests. Pseudomomogeneous
model represents reactor approximation by ideal
piston fluid flow and neglecting of mass and heat
transfer limitations. Integrated forms of reactor
model for first and other than first reaction order are
described by equations 6 and 7, respectively.
Parameter WHSV represents weight liquid hourly
space velocity. Parameters of the equations were
estimated by nonlinear simplex Nelder-Mead fitting
procedure.
2
0
1
ln
i
iH
i
c
kp
cWHSV
(6)
1
1
(7)
3.3 Heterogeneous Reactor
CFD 3D model of hydrodynamics in pilot reactor
was made in Comsol Multiphysics FEM solver
(Zimmerman, 2007). Heterogeneous reactor model
incorporates mass and heat transfer limitations. The
developed model incorporates of Navier-Stokes
momentum balance of fluid flow with Brinkman
extension for porous reactor bed. Both chemical
kinetic, mass transfer of reactants and heat
convention and conduction are taking into account.
3.3.1 Domain Equations - Fluid Flow
The stationary Navier-Stokes equations describe the
fluid flow in the free-flow regions. In the porous
bed, the Brinkman equations for porous media is
applied.
From assumption that the modeled species are
present in low concentrations compared to the
solvent oil. follows that using of a Fickian approach
for the diffusion term in the mass transport is
aproved. Model involve the mass transport for the
four species A, B, C, and D with the convection-
diffusion equation
This model shows the flow field in an
experimental reactor for studies of heterogeneous
catalysis.
0
0
T
p
uu uu
u
(8)
The model couples the free fluid and porous
media flow through the Navier-Stokes equations and
Brinkman’s extension of Darcy’s law.
The mass transport of three species in the reactor
is modelled through the diffusion and convection
equation.
0
0
T
p
k
uu u
u
(9)
In the above equations
denotes the viscosity,
the density, and k the permeability.
3.3.2 Domain Equations – Mass Transport
The mass transport is given by the diffusion and
convection equation:
()
ii i i
Dc c R
u
(10)
where c
i
denotes the concentration (mol/m
3
)
of species i, u the velocity vector D
i
the diffusivity
(m
2
/s), and R
i
the reaction rate (mol/(m
3
.s)) for
species i.
3.3.3 Boundary Conditions
A constant velocity profile is assumed at the inlet
boundaries:
u = u
i
n
(11)
1/WHSV
,
h
.
k
g
K
/k
g
L
SimulationofHDSTestsinTrickle-BedReactor
741
For the outlets, pressure conditions are applied.
In the mass transport, the concentrations at the inlet
are fixed:
c
i
= c
i0
,
inlet
(12)
At the outlet, assume that convection dominates
the mass transport:
n (-D
i
c
i
) = 0
(13)
This implies that the gradient of c
i
in the
direction perpendicular to the outlet boundary is
negligible. This is a common assumption for tubular
reactors with a high degree of transport by
convection in the direction of the main reactor axis.
The condition eliminates the need for specifying a
concentration or a fixed value for the flux at the
outlet boundary. At all other boundaries, insulating
conditions apply:
n (-D
i
c
i
+ c
i
u) = 0
(14)
4 RESULTS AND DISCUSSION
Following presented results deals with estimated
kinetic parameters and catalyst deactivation rate
combined with hydrodynamic results obtained by
RTD method. The last part represents results of
reactor model.
4.1 Kinetic Parameters
Kinetic parameters of equation 2 were evaluated
from experiments with different weight liquid hourly
space velocity (WHSV). It follows from Figure 2
that reaction order with respect to sulfuric
compounds was found 1.37 and first order with
respect to nitrogen compounds.
4.2 Catalyst Deactivation
Deactivation of HDS catalyst in course of operation
period represents a serious problem. To predict
kinetics of deactivation a long time experiments are
necessary. Possible way how to accelerate
deactivation process is to combine raw liquid feeds,
AGO and LCO, respectively, with different content
of coke precursors, e.g., aromatics.
Result of this arrangement is possible to see on
Figure 3, HDS rate constant course in time on
stream (TOS). By periodic setting of standard
reaction condition: feed composition and
temperature and pressure, data presented in Figure 4
were obtained. Data measured at standard reaction
conditions represent decrease of reaction rate in time
due to catalyst deactivation. From this Figure 4
deactivation constant for presumed first deactivation
order was evaluated by linear regression.
Figure 2: Rate constant and reaction orders with respect to
sulfuric and nitrogen compounds.
Figure 3: Example of typical accelerated activity test with
AGO an LCO feedstock. Operating parameters: pressure
4.5 MPa, Oil feed 1 kg/dm
3
cat.
, hydrogen/liquid feed 300
Nm
3
/m
3
.
Figure 4: Linear fitting of first order deactivation.
0 0.1 0.2 0.3 0.4 0.5 0.6 0.7 0.8 0.9
10
-4
10
-3
10
-2
10
-1
10
0
1/WHSV, h.kg
K
/kg
L
C/C
0
N
S
N:order 1.00
S:order 1.37
SIMULTECH2014-4thInternationalConferenceonSimulationandModelingMethodologies,Technologiesand
Applications
742
4.3 RTD
To formulate hydrodynamic model of the pilot
reactor determination of flow pattern in catalytic bed
is necessary. This is possible experimentally by the
RTD method. Resulting parameters of piston
dispersion (PD) model (Villermaux and van Swaaij,
1969), ie, Pe number and liquid holdup were
evaluated by nonlinear fitting simplex procedure of
Equation 15.
1/2 1/2
2
1(1) /1
() exp
2422
Pe
Pe Pe Pe Pe
Eeerfc
(15)
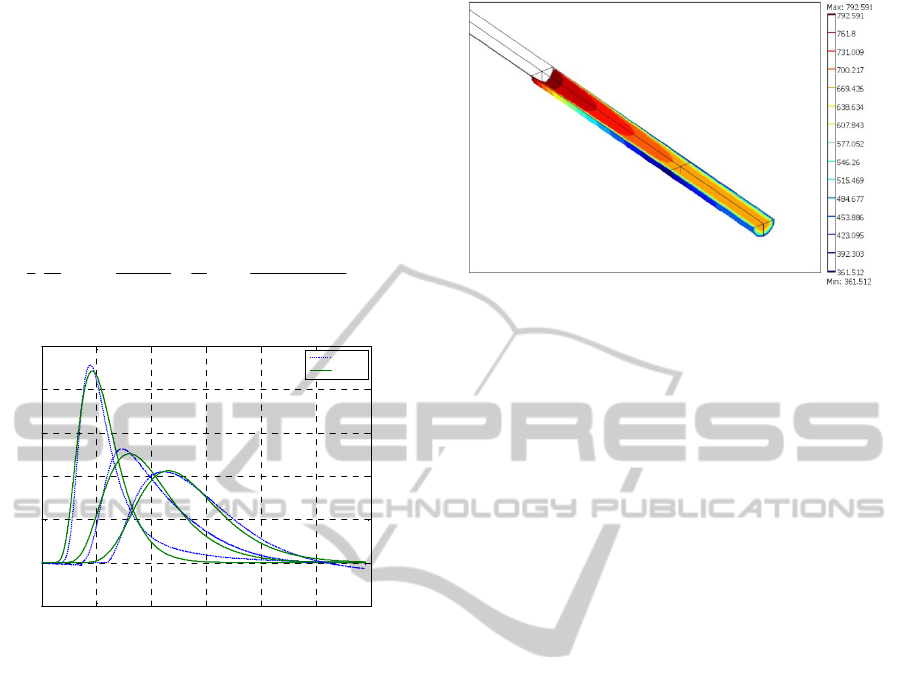
Figure 5: Comparison of PD model with RTD experiment.
E represents tracer distribution function,
is
dimensionless time, and Pe is Peclet number. Good
agreement between PD hydrodynamic model
(Equation 15) and experiment is presented in Figure
5.
4.4 CFD Reactor Model
In the Figure 5 the CFD model solution of sulfur
concentration field in tested trickle bed reactor is are
presented. Reactor bed is divided to three zones with
different porosity: i) calming zone to reach phase
equilibrium and steady state fluid velocity profile, ii)
first reaction zone of diluted catalyst and, iii) second
reaction zone of diluted catalyst. To evaluate an
influence of resulting parabolic velocity profile on
sulfur compound concentration is possible.
Decreased porosity of diluted catalytic reactor bed
exhibit more flat velocity profile, so as more even
reactants concentration on bed cross-section. Kinetic
Equation 2 of hydrodesulfurization of different
compounds, e.g. dibenzothiophene, were
incorporated into model to simulate real reactor
behavior.
Figure 6: CFD model of pilot reactor with
dibenzothiophene concentration field.
5 CONCLUSIONS
To support experimental testing of
hydrodesulfirization catalysts in pilot scale trickle-
bed reactor a methodology based on process
simulation was developed. Time dependent models
were used to evaluate both kinetic of HDS and HDN
reactions and description of catalyst activity decay
based on experiments. Also RTD measurement of
liquid holdup and axial dispersion in catalytic bed
was evaluated by piston dispersion (PD)
hydrodynamic model of time response characteristic.
Resulting kinetic parameters, deactivation constant
and Peclet number were used to formulate steady
state heterogeneous reactor model. Effect of
different inert diluent grain size on performance of
pilot scale HDS catalytic reactor was successfully
evaluated by CFD model. Time dependent kinetic in
combination with steady state flow velocity was
used to compare with experimental measurements.
ACKNOWLEDGEMENTS
This publication is a result of the project no. FR-
TI3/084, supported by the Ministry Industry and
Trade, which is being carried out in the UniCRE
centre whose infrastructure was supported by the
European Regional Development Fund and the state
budget of the Czech Republic. Also financial
support from specific university research (MSMT
CR no. 20/2014) is also acknowledged.
0 500 1000 1500 2000 2500 3000
-0.5
0
0.5
1
1.5
2
2.5
x 10
-3
t, s
E(t), s
-1
exp
model
SimulationofHDSTestsinTrickle-BedReactor
743

REFERENCES
Ancheyta, J., 2011. Modeling and Simulation of Catalytic
Reactors for Petroleum Refining, John Wiley & Sons,
Inc. Hoboken, 1
st
edition.
Bej, S.K., Dalai, A.K., Maity, S.M., 2001. Effect of diluent
size on the performance of a micro-scale fixed bed
multiphase reactor in up flow and down flow modes of
operation. Catalysis Today 64, 333-345.
Bellos, G.D., Papayannakos, N.G., 2003. The use of a
three phase microreactor to investigate HDS kinetics.
Catalysis Today 79–80, 349-355.
Mary, G., Chaouki, J., Luck, F., 2009. Trickle-bed
laboratory reactors for kinetic studies. International
Journal of Chemical Reactor Engineering 7 R2, 1-68.
Tukač, V., Šimíčková, M., Chyba, V., Lederer, J., Kolena,
J., Hanika, J., Jiřičný, V., Staněk, V., Stavárek P.,
2007. The behavior of pilot trickle-bed reactor under
periodic operation. Chemical Engineering Science 62,
4891-4895.
Villermaux, J., van Swaaij, W.P.M., 1969. Modèle
représentatif de la distribution des temps de séjour
dans un réacteur semi-infini à dispersion axiale avec
zones stagnantes. Application a l’écoulement
ruisselant dans des colonnes d’anneaux Raschig.
Chemical Engineering Science 24, 1097-1111.
Zimmerman, W.B.J., 2007. Multiphysics Modelling with
Finite Element Methods, World Scientific, Singapore.
2
nd
edition.
SIMULTECH2014-4thInternationalConferenceonSimulationandModelingMethodologies,Technologiesand
Applications
744
