
A High-level Petri Nets Approach for Multi-Objective Optimization in
Pipeline Networks
Hela Kadri and Belhassen Zouari
LIP2 Laboratory, University of Tunis El Manar, Campus El Manar, Tunis, Tunisia
Keywords:
High-level Petri Nets, Pipeline Networks, Dynamic Reliability, Dijkstra’s Algorithm, Multi-objective
Optimization.
Abstract:
High-level Petri nets are a powerful modelling language appropriate to represent massive, dynamic, and com-
plicated systems like pipeline networks. Finding the optimal path in these networks is not an easy task,
especially when we are concerned with multi-objective problems such as in the present study: minimizing
path’s length and maximizing valves’ dynamic reliability which depends on time and conditions of use.
This work aims, firstly to calculate the dynamic reliability of the valves engaged in the path’s search accord-
ing to their behavior, and secondly, to transform the multi-objective optimization problem into a shortest path
problem through a scalarization method and then to find an optimal path using the Dijkstra’s algorithm de-
veloped with a High-level Petri nets. This contribution is applied in the transport of oil but it is potentially
applicable in many other areas.
1 INTRODUCTION
Pipeline networks - for oil, natural gas, chemicals,
water, etc. - represent an important part of critical
infrastructures for many countries, impact in many ar-
eas of our daily lives and are essential to all industries.
Particularly crude oil , which is (with natural gas) the
most important raw material for energy production,
is found in locations far away from where they are
processed or refined into fuels, and these processing
locations are also far away from where they are con-
sumed. While many forms of transportation are used
to move this product to marketplaces, pipelines re-
main the safest, most reliable, efficient and economi-
cal way to move this natural resource.
An oil pipeline network is intricate and can be in-
stalled above the ground, under the ground, or un-
derwater. Pipelines operate all-day, everyday with
the help of powerful pumps, oil additives that move
the oil with less resistance and the laws of physics.
Pipeline networks are also used to store oil and to con-
nect the different means of transport (tankers, trucks,
trains, etc.) via a set of loading arms. The oil transfer
is carried out by selecting an alignment (i.e. path) of
pipelines linking the two elements of interest and en-
abling oil flow by opening the valves in the alignment
and closing all adjacent valves in order to isolate it to
avoid oil mixture.
Although every pipeline company is working to
properly manage her facilities and to achieve incident-
free operations, accidents do happen with serious
economic, financial, environmental and technologi-
cal impacts. Having relevant information about the
state of these pipelines along the time (monitoring)
allows estimating its behavior in the future (progno-
sis) and can significantly improve safety policies. Dy-
namic reliability is one of the efficient indicators to
assess performance degradation during pipeline net-
work’s life. It takes into account the failure rate ver-
sus time, as well as impact of operating constraints
(Dominique et al., 2007). In industry there exists the
growing perception that on one hand constant failure
rates - respecting Markovian hypothesis - are no more
sufficient to characterize resource confidence (Loman
and Wendai, 2002), and on the other hand some influ-
ence factors determine the evolution of failure distri-
bution laws (Devooght and Lewins, 1997) and denote
the natural impact of the environment on duration of
equipment’s life.
Using reliable alignments and respecting the time
delivery constraints of pipeline companies, are the
challenges that this work aims to face, leading to a
multi-objective optimization problem. For that, firstly
the concept of dynamic reliability is applied to the
riskiest component to failure in the oil pipeline net-
work: the valve (SINTEF, 2002); secondly, a scalari-
211
Kadri H. and Zouari B..
A High-level Petri Nets Approach for Multi-Objective Optimization in Pipeline Networks.
DOI: 10.5220/0005092602110218
In Proceedings of the 4th International Conference on Simulation and Modeling Methodologies, Technologies and Applications (SIMULTECH-2014),
pages 211-218
ISBN: 978-989-758-038-3
Copyright
c
2014 SCITEPRESS (Science and Technology Publications, Lda.)

sation of multi-objective optimization problem is de-
fined to formulate a single objective optimization
problem of shortest path resolved by Dijkstra’s algo-
rithm and developed in a High-level Petri net (HLP-
net) framework taking into account the existing align-
ments. In order to validate the proposed algorithm
which finds the shortest reliable path, a representative
example inspired from a real case of a seaport for oil
export is applied. The remainer of the paper is organ-
ised as follows. Section 2 describes the considered
problem and the proposed solution. In Section 3, a
case study is described, a brief overview on the HLP-
nets used in this paper is presented and the related
HLP-nets model is detailed. Section 4 presents the
results of the experimentation of the model. Finally,
Section 5 sums up the paper and presents some ideas
for future works.
2 MULTI-OBJECTIVE
OPTIMIZATION PROBLEM
Multiple, often conflicting objectives arise naturally
in most real-world optimization scenarios such as the
problem treated in this paper: the search of the align-
ment that guarantees simultaneously
• maximum dynamic reliability on valves, and
• minimum distance of pipes in pipeline networks.
These networks are characterized by complex facili-
ties with multiple components (tubes, pumps, valves,
etc.) submitted to heavy working conditions that lead
usually to a decrease in their reliability. Valves’ reli-
ability is most affected and without proper control it
may lead to accidents with severe environmental and
economical consequences.
2.1 Pipe Reliability
Dynamic reliability is an efficient indicator to assess
performance degradation during system’s life. It de-
pends on time and operating conditions. Pipe relia-
bility depends on the dynamic reliability on one side
of the corresponding valve to open and on the other
side of all the valves that isolate it from the rest of the
network (i.e. to close).
Definition 1. Pipe reliability R
Pipe
(t, Z) is calculated
as the product of dynamic reliability of n involved
valves v among which one is to open and all the others
are to close.
R
Pipe
(t, Z) = R
v to open
(t, Z) ×
n−1
∏
i=0
R
v to close
i
(t, Z).
(1)
Definition 2. The dynamic reliability R(t, Z) defined
by the conventional expression depending of the dy-
namic failure rate λ(t, Z),
R(t, Z) = e
−
R
t
t
0
λ(τ,Z)dτ
(2)
where
• t
0
and t are respectively the initial instant of func-
tioning and the date of the failure occurrence,
• Z represents the set of influence factors. Those
choice depend on the application.
Definition 3. The dynamic failure rate λ(t, Z) de-
pends on time t and influence factors Z,
λ(t, Z) = λ
0
(t) × g(Z) (3)
Definition 4. The failure rate base λ
0
(t), which illus-
trated in Fig. 1, is modeled by the Weibull distribution
with two parameters β and η.
λ
0
(t) =
β
η
× (
t
η
)
β−1
(4)
where:
β : the shape parameter, unitless;
η : the scale parameter in units of time.
Figure 1: Bath-tub shape of the failure rate base.
Definition 5. The influence function g(Z) represents
system’s external and internal characteristics,
g(Z) = e
B×Z
= e
∑
m
k=1
b
k
×z
k
(5)
where:
m : the number of influence factors taken in the
model;
B = (b
1
, · · · , b
m
) : coefficients’ vector of the Cox
model (Cox, 1972);
Z = (z
1
, · · · , z
m
) : influence factors’ vector.
2.1.1 Estimation of the Dynamic Reliability
Parameters
The coefficients of the dynamic reliability function
were determined through the calculi detailed in (Do-
minique et al., 2007). The input data needed to iden-
tify coefficients were obtained from a database of
measurements generated from OREDA database re-
liability (SINTEF, 2002) which is a data collection
SIMULTECH2014-4thInternationalConferenceonSimulationandModelingMethodologies,Technologiesand
Applications
212

from various industries. In fact, OREDA provides a
representation of the failure rate with a normal distri-
bution characterized by its mean and standard devia-
tion. So, firstly, we randomly generated a sufficient
number of failure rate values with MATLAB soft-
ware environment (Hahn and Valentine, 2013). We
use these values of failure rate to find the correspon-
dent time and influence factors using the Naval Sur-
face Warfare Center (NSWC) approach (Tyrone and
Jones, 2011).
2.2 Scalarizing the Multi-objective
Optimization Problem into a
Shortest Path Problem
We want to minimize the path distance D
p
D
p
= min
n
∑
i=1
l
i
(6)
where
- n: the number of engaged pipes in the path.
- l
i
: length of the i
th
engaged pipe.
and to maximize the path reliability R
p
R
p
(t, Z) = max
n
∏
i=1
R
Pipe
i
(t, Z) (7)
where
- n: the number of engaged pipes in the path.
- R
Pipe
i
: pipe reliability of the i
th
engaged pipe.
(6) and (7) define a multi-objective problem, that can
be approached by scalarizing it.
Scalarizing a multi-objective optimization prob-
lem aims to formulate a single-objective optimiza-
tion problem such that optimal solutions to the single-
objective optimization problem are optimal Pareto so-
lutions to the multi-objective optimization problem
(Ching-Lai and AbuSyed, 1979). There exist many
scalarization methods (Pagani and Pellegrini, 2009),
but we will define a new method more appropriate for
our case, as follows.
Definition 6. The scalar cost SC
i
(t, Z, l
i
) of the i
th
pipe is defined as the pipe length divided by the pipe
reliability:
SC
i
(t, Z, l
i
) =
l
i
R
Pipe
i
(t, Z)
. (8)
This scalarization allowed us to transform our
multi-objective optimization problem into a shortest
path problem. With time, pipe reliability decreases
causing the increase of scalar costs; this will prevent
the algorithm to select paths that although short in dis-
tance have lower reliability.
Different algorithms have been proposed to find
the optimal routes in graphs. Dijkstra’s algorithm is
probably the best known; it is a graph search algo-
rithm that solves the single-source shortest path prob-
lem for a graph with nonnegative edge costs, produc-
ing a shortest path tree (Dijkstra, 1959).
Definition 7. Shortest reliable path SRP(t, Z, L), ac-
cording to Dijkstra’s algorithm, will be calculated
from the sum of the scalar costs of the n pipes engaged
in the path.
SRP(t, Z, L) =
n
∑
i=1
SC
i
(t, Z, l
i
) (9)
where
L =
n
∑
i=1
l
i
. (10)
2.2.1 Brief Review of the Dijkstra’s Algorithm
as Used
Let the pipe where we are starting be called an initial
pipe. Let the cost to a pipe Y be the SRP(t, Z, L) from
the initial pipe to it. Dijkstra’s algorithm will assign
some initial cost value and will try to improve them
step-by-step as follows:
1. Assign to the initial pipe a cost value.
2. Set initial node as current.
3. For current pipe, consider all its unvisited and
available (i.e. is not in use by alignments) neigh-
bors and calculate their cost (from the initial pipe).
4. When we are done considering all neighbors of
the current pipe, mark it as visited.
5. Set the unvisited node with the smallest cost (from
the initial pipe) as the next ”current pipe” and con-
tinue from step 3).
With these steps, the shortest reliable path from
the starting point to the destination can be effectively
achieved. And thus this algorithm has been widely
used in routing systems, namely in oil pipelines net-
works: (Rojas-D’Onofrio et al., 2011; Kadri and
Zouari, 2014) using respectively automaton and HLP-
nets model.
3 CASE STUDY
3.1 Oil Pipeline Network Description
The case study is a simplified pipeline network rep-
resentative of an oil-exporting seaport (see Fig. 2). It
AHigh-levelPetriNetsApproachforMulti-ObjectiveOptimizationinPipelineNetworks
213

is composed by a set of pipes linking a set of tanks
storing oil to a set of loading arms placed at the docks
of the seaport. Loading arms are connected to tankers
that receive the oil and transport it to different desti-
nations. Valves and pumps are the only elements that
can be controlled. Valves are, most of the time, in
one of two different states: opened or closed, whereas
pumps can be on or off. The transitions between these
states can be considered instantaneous when com-
pared with the time spent in any of the states.
Alignments are established using valves: some
valves are opened along a path linking the elements,
whereas some other valves are closed around the path,
isolating it from the rest of the pipe network.
Figure 2: Oil seaport example. Figure 3: Its undirected
graph model.
Fig. 3 shows the example as an undirected graph
in which arcs represent the valves. The nodes repre-
sent pipes with lengths. blue nodes represent an align-
ment, blue arcs its opened valves and orange arcs its
closed valves. To satisfy any request, this work aims
to find the shortest reliable path that minimizes SRP
in (9).
For each valve, the studied influence factors z
i
are
components of the Z influence vector
Z = (C
s
, T, S). (11)
where:
C
s
: Commutation stress, the total number of chang-
ing state from opened to closed or the contrary.
T : The total operating time in opened and in closed
states.
S : The last valve state (opened or closed). This state
will be compared to the new state of its corre-
sponding valve in order to detect the changing
state.
From (5), considering these three influence factors,
we can write
g(Z) = e
(b
1
×C
s
+b
2
×T +b
3
×S)
. (12)
The constant b
3
is also called the gamma factor i.e.
probability of failure (to close/open) (Cacheux and
Collas, ).
To illustrate our approach, we used the previous
example developed using the environment CPN Tools
4 (Westergaard and Kristensen, 2009).
3.2 High-level Petri Nets
HLP-nets allow a concisely representation in a unified
structure both of the static and the dynamic aspects of
the considered system, thanks to its twofold represen-
tation - graphical and mathematical. The graphical
aspect enables a concise way to design and verify the
model, while the mathematical aspect allows formal
modelling of these interactions and analysis of the
modelled system properties (Jensen and Kristensen,
2009).
Among the several types of HLP-nets (Colored,
timed, Stochastic, etc.), we use particularly the fol-
lowing:
Colored Petri Nets associate color to each token dis-
tinguishing one token from the other and their
value can be manipulated and tested with “Meta
Language” during arcs, transitions and guards.
Hierarchical HLP-nets allow to divide the model
into submodels small enough to be easily tracked,
and to verify independently each submodel prop-
erties.
Timed Petri Nets allow to modelling timed informa-
tion related to the functioning of the proposed
model.
Reset Nets extend Petri nets with a special type of
arc, the reset arc. It does not impose a precon-
dition on firing, and empties the place when the
transition fires.
Petri Nets with Inhibitor Arcs which imposes the
precondition that the transition may only fire
when the place connected to it has zero tokens.
Prioritised Petri Nets add priorities to transitions,
whereby a transition cannot fire, if a higher-
priority transition is enabled (i.e. can fire).
These types of HLP-nets revealed adequate and prac-
tical to model the optimal path search problem of
pipeline networks, as shown in the following.
3.3 HLP-nets Model
This section describes the HLP-nets modeling tech-
nique used to search the shortest reliable path. In par-
ticular, the model developed in this paper is referred
SIMULTECH2014-4thInternationalConferenceonSimulationandModelingMethodologies,Technologiesand
Applications
214

to a seaport pipeline network, but it can be easily ap-
plied to any pipeline network.
The model in Fig. 4 presents the upper layer
of the hierarchical HLP-nets model describing the
generic behavior of the Dijkstra’s algorithm applied
to a pipeline in operation:
Figure 4: Path search algorithm model.
• The token of the place ”New Orders” defines the
related information of an order: Source, destina-
tion and duration. For each order, the shortest re-
liable path search is repeated every 48 hours (2
days is the average time to fulfill a normal tanker,
but this time can be adapted by the user) in order
to maintain the proper alignment choice for long-
term orders.
• The sequentiality of the three steps of Dijkstra’s
algorithm is verified via a token in the place
”Control Steps”.
• The topology of the pipeline network is defined
as a set of tokens in the place ”Topology”. Ev-
ery token is a triplet containing a valve connecting
each two pipes (pipe
1
, valve, pipe
2
) based on the
rule: ” between two pipes there is one and only
one valve”. The order of the pipes in the triplet
informs us the direction of oil flow.
Note that this simple technique makes the model
sufficiently generic to present any pipeline net-
work independently of its size and its shape, and
is also flexible for the modification of the pipeline
topology: joining or deleting pipes or valves re-
duces to simply create of delete tokens.
• When search is started, the place ”Path Tree” con-
tains the produced shortest reliable paths. We
have two cases:
Destination reached: when the transition ”End
Of Search” is fired which is a higher-priority
transition,
- the shortest reliable path is placed in the place
”Path Found” with its SRP value and its start-
ing time;
- a reset arc empties the place ”Path Tree” and
a mechanism of recovering the used tokens
from the place ”Topology” is activated in or-
der to re-initialize the model.
Destination not reached: - the substitution tran-
sition ”Selection Of Current Path” sets the
path with the lowest SRP in the place ”Cur-
rent Path”;
- the substitution transition ”Determine Next
Pipes” creates new paths as concatenation of
current path with its unvisited neighbor pipes
and stores them in the place ”New Paths”.
- the substitution transition ”Calculi Shortest
Reliable Path” computes the SRP of each new
path.
3.3.1 Submodel ”Treatment Of Orders”
The submodel of Fig. 5 models the operation of the
pipeline. It contains a place based on external events
called ”State Valve” which represents the characteris-
tics of each elementary valve such as the initial instant
of functioning, the identity, availability, etc., in addi-
tion to its influence factors values: the commutation
stress (C
s
), the operating time (T ), and the last valve
state (S). Order by the pipeline alignment, the valve
will be committed to opened or closed state based on
its current state and the specificity of the alignment
and its characteristics will be updated.
Figure 5: Submodel ”Treatment Of Orders”.
3.3.2 Submodel ”Selection Of Current Path”
In this HLP-nets submodel (Fig. 6), the steps of the
shortest reliable path selection are:
- from ”Path Tree”, one path is chosen randomly;
- for each other path, the submodel compares its
SRP with that of the chosen one, makes as cho-
sen the path with the lowest SRP and places the
other in the place ”Paths Tested”;
AHigh-levelPetriNetsApproachforMulti-ObjectiveOptimizationinPipelineNetworks
215
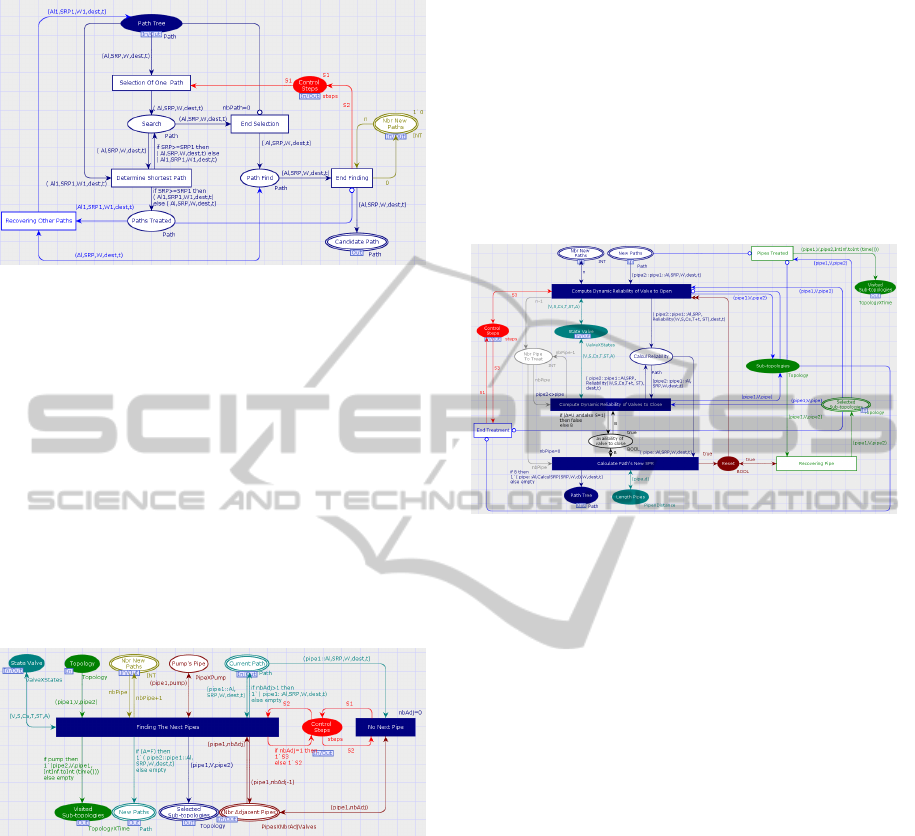
Figure 6: Submodel ”Selection Of Current Path”.
- when all candidate paths are tested, the one with
the lowest SRP is placed in the place ”Path Find”
first and then in the place ”Current Path”.
- before moving to the next step by firing the tran-
sition ”End Finding”, the transition ”Recovering
Other Paths” is fired enough times to recover all
paths from the place ”Paths Tested” to the place
”Path Tree”.
3.3.3 Submodel ”Determine Next Pipes”
This HLP-nets submodel (Fig. 7) aims to create paths
from the current path and its unvisited neighbor pipes.
Figure 7: Submodel ”Determination of neighbor pipes”.
If there are neighbor pipes, the transition ”Finding
the next pipes” will be fired enough times that the
current path has adjacent pipes in possible direc-
tions (i.e. possible oil flow) causing
• the search of all unvisited and available neigh-
bor pipes, and their storage in the place ”Se-
lected Sub-topology”;
• the replacement of the current path by new ones
corresponding to each pipe found concatenated
with the current path;
• for all pipes found containing a pump, their to-
kens representing the other oil flow direction
are placed in the place “Visited Sub-topology”.
If there are no neighbor pipes, the transition ”No
next pipes” will be fired causing the deletion of
the token representing the current path and the
return to the previous step for selecting another
path.
3.3.4 Submodel ”Calculi Shortest Reliable Path”
The objective of this submodel (Fig. 8) is, for every
new path created, the computation of its SRP value
(7).
Figure 8: Submodel ”Calculi Shortest Reliable Path”.
The submodel incorporates a computation proce-
dure to assess the scalar cost (SC(l, t, Z)) (6) of each
pipe based on its length l and on the dynamic reliabil-
ity (R(t, Z)) (2) of these valves involved in opening or
in closing.
In order to determine the SRP for each path in the
place ”New Paths”, the following steps must be
achieved:
- from the place ”Selected Sub-topology”, determi-
nation of the new valve invoked to opening and
the computing of its (R(t, Z));
- determination of its new valves invoked to clos-
ing and computation of their R(t, Z) and the pipe
reliability (R
pipe
(t, Z)) from all the remaining to-
kens in the place ”Selected Sub-topology” repre-
senting possible neighbor pipes by firing enough
times the transition ”Calculate Dynamic Reliabil-
ity of Valves to Close”;
- computation of the SC(l, t, Z) and updating the
SRP via the transition ”Calculate Path’s New
SRP”;
- placing the used tokens from the place ”Selected
Sub-topologies” in the place ”Sub-Topologies”
and those from the place ”Topology” in the place
”Adjacent Sub-topologies”;
- Deleting paths with valve to close engaged to
open with an existing order.
SIMULTECH2014-4thInternationalConferenceonSimulationandModelingMethodologies,Technologiesand
Applications
216

- if there are still paths: the transition ”Recover-
ing Pipes” is fired enough times to recu-
perate all tokens in the place ”Selected sub-
topologies” from the place ”Sub-topology”.
If there are no more paths: the transition
”Pipes Treated” is fired enough times to place
all tokens of the place ”Sub-topology” in the
place ”Next Sub-topologies”.
- At the end, the transition ”End Treatment” is fired
in order to return to the first step.
4 THE CASE STUDY:
SIMULATION AND RESULTS
To extract the coefficients of the failure rate base func-
tion and of the influence function, we have consid-
ered the OREDA database. It indicates, for valves
type Butterfly, that are widely used in oil pipeline net-
works their average lifetime is equal to 98, 500 hours
(i.e. more than 11 years). So, we divided this lifetime
between the two considered phases:
useful life phase (β = 1) for the first 71, 600 hours
(i.e. more than 8 years): it’s equivalent to the
operational time of these type’s valves estimated
based on a data collector conducted by OREDA.
wear-out phase (β = 4.748) for the rest.
The burn-in phase is not treated because it’s not in-
cluded in the OREDA database: it’s assumed that the
data collection is started with the useful life phase.
The η determined is 98522.167 hours; and the cal-
culated coefficients of influence factors are listed in
Table 1.
Table 1: The coefficients of influence factors.
Coefficient Value
b
C
s
−36.621 × 10
−5
b
T
−6.103 × 10
−5
b
S to open
1.118
b
S to close
1.125
The HLP-nets model of the Dijkstra’s algorithm
exploits the pipeline network to find the shortest reli-
able path. We will reconsider the oil seaport example
of Fig. 2 and Fig. 3 to answer to the order of trans-
porting the oil from tank T
1
to the loading arm LA
1
during 96 hours (4 days). First, let us assume that the
pipeline has already been used to satisfy previous or-
ders and initialized with the values of Table 2 and the
existing alignment of Fig. 3 will end in 48 hours.
Table 2: Valves coeficient.
Valve S C
s
T (hour) Valve S C
s
T (hour)
V 1 open 693 33264 V 15 open 1377 66096
V 2 open 365 17520 V 16 open 455 21840
V 3 close 148 7104 V 17 close 582 27936
V 4 open 1607 77136 V 18 close 494 71712
V 5 open 473 22704 V 19 open 1123 53904
V 6 open 629 30192 V 20 open 399 19152
V 7 open 205 9840 V 21 open 583 27984
V 8 open 451 21648 V 22 open 121 5808
V 9 close 388 18624 V23 open 1025 49200
V 10 close 536 25728 V24 close 38 1824
V 11 open 1297 62256 V 25 open 747 35856
V 12 close 318 15264 V26 open 173 8304
V 13 open 823 39504 V 27 open 23 1104
V 14 open 919 44112 V 28 close 952 45696
To reach the destination point LA
1
from tank T
1
,
the developed algorithm determines minimal paths
based on pipes’ length and valves’ dynamic reliability
engaged to open and to close. The results computed
by the proposed model are given in Table 3.
Table 3: Results.
Shortest reliable path SRP(t, Z, L) time
T
1
, P
1
, P
7
, P
9
, P
10
, LA
1
492.5712 0
T
1
, P
1
, P
6
, P
8
, P
10
, LA
1
390.0216 48
When an alignment is chosen to satisfy one or
more orders, it will be used throughout the period nec-
essary. If this period is too long it would impact the
dynamic reliability of its valves and some orders have
been completed and others began. Consequently, the
proposed model will favor another alignment to fin-
ish the current order or for similar orders and that is
what happened in the studied example. For an order
with a duration of four days, an optimal alignment is
obtained for the first 48 hours and another for the re-
maining two days.
During the simulation of the shortest path search,
a set of monitors can be integrated into the HLP-
nets model to estimate, based on dynamic reliability,
valves’ lifetime and their maintenance timeout.
Furthermore, the simulation allows the validation
of certain properties of the studied system:
• Flexibility: the modification of pipeline network
topology (i.e. maintenance, extension, etc.) does
not influence the developed model because the re-
lated information of the network topology is spec-
ified only in the tokens.
• Boundedness: the number of paths in the place
”Path Tree” which represents the calculated
shortest reliable paths, is bounded because it is
less than or equal to the number of all possible
paths in the network which is also bounded.
The use of hierarchical model has major advantages.
Indeed, added to the ability to make easier the mod-
AHigh-levelPetriNetsApproachforMulti-ObjectiveOptimizationinPipelineNetworks
217

elling of the complex system, such alternative allows
to independently verifying each submodel properties
and having more compact and understandable mod-
els. Using each submodel makes easier the validation
of every step of Dijkstra’s algorithm.
5 CONCLUSIONS
This research work addressed the problem of multi-
objective optimization in oil pipeline network: the
calculation of the shortest reliable path is taking into
account pipes’ length and valves’ dynamic reliability
which varies with time and with conditions of use.
The study proposed, firstly, the definition of dy-
namic reliability and the determination of its pa-
rameters; secondly, the adoption of the scalarization
method in order to transform the multi-objective opti-
mization problem into a shortest path problem solved
by Dijkstra’s algorithm and based on a HLP-nets
model.
The implementation of this algorithm in the
framework of HLP-nets has the important advantage
of avoiding the curse of dimensionality that can ap-
pear in combinatorial optimization problems concern-
ing real pipeline networks. With this framework
the problem dimension is independent of the graph’s
nodes’ number, since the dimension impacts only in
the tokens’ number.
Another important issue is the global network
management when several orders must be satisfied
simultaneously and several non-intercepting align-
ments must be used at the same time. This introduces
additional constrains in the minimal path search that
must be accommodated in the HLP-nets model to pre-
vent conflicts in pipe selection and concatenation.
Maintenance operations must be programmed to
prevent an exaggerated decrease in valves and pumps
reliability. The dynamic reliability, used in this work,
can eventually be used as a trigger to maintenance
plans that must be taken into consideration and rep-
resent another additional constraint in the problem.
These are interesting directions for future re-
search.
REFERENCES
Cacheux, P.-J. and Collas, S. Probability of failure due to
a demand : a concept needing clarification. In 18
ieme
congr
`
es.
Ching-Lai, H. and AbuSyed, M. M. (1979). Multiple ob-
jective decision making, methods and applications: a
state-of-the-art survey. Springer-Verlag.
Cox, D. (1972). Regression models and life tables. Journal
of the Royal Statistical Society, series B, vol. 34, no.
2.
Devooght, J. and Lewins, J. (1997). Dynamic Reliability, in
Advances in Nuclear Science & Technology. Springer
US, Volume 25.
Dijkstra, E. W. (1959). A note on two problems in connex-
ion with graphs. Numerische Mathematik 1, Springer-
Lehrbuch.
Dominique, C., Lyonnet, P., Brissaud, F., and Lanternier,
B. (2007). Mod
´
elisation des taux de d
´
efaillance en
m
´
ecanique. In Performances et Nouvelles Technolo-
gies en Maintenance.
Hahn, B. and Valentine, D. (2013). Essential Matlab for
Engineers and Scientists. Academic Press, London,
5th edition.
Jensen, K. and Kristensen, L. (2009). Coloured Petri Nets
– Modeling and Validation of Concurrent Systems.
Springer-Verlag, Berlin.
Kadri, H. and Zouari, B. (2014). Shortest path search in
dynamic reliability space: Hierarchical coloured petri
nets model and application to a pipeline network. In
6th International Conference on Modelling and Simu-
lation.
Loman, J. and Wendai, W. (2002). On reliability modeling
and analysis of highly reliable large systems. In Pro-
ceedings of Maintainability Symposium. IEEEXplore.
Pagani, E. and Pellegrini, L. (2009). Scalarization and
sensitivity analysis in Vector Optimization. The lin-
ear case. Working Paper Series, Department of Eco-
nomics, University of Verona.
Rojas-D’Onofrio, J., M
´
arquez, J., Boutleux, E., and Niel,
E. (2011). Path search algorithm for connections with
pumps in crude oil pipe networks. In IFAC World
Congress.
SINTEF, I. M. (2002). Offshore Reliability Data Handbook.
Det Norske Veritas (DNV).
Tyrone, L. and Jones, T. (2011). Handbook of Reliabil-
ity Prediction Procedures for Mechanical Eqfuipment.
Naval Surface Warfare Center West Bethesda, Mary-
land, 2nd edition.
Westergaard, M. and Kristensen, L. (2009). The access/cpn
framework: A tool for interacting with the cpn tools
simulator. In 30th International Conference on Appli-
cations and Theory of Petri Nets.
SIMULTECH2014-4thInternationalConferenceonSimulationandModelingMethodologies,Technologiesand
Applications
218
